| Param | Original file | Final file |
|---|---|---|
| Filename | modeM0/AS1A07_054T01_9000003370_22802cztM0_level2.evt | modeM0/AS1A07_054T01_9000003370_22802cztM0_level2_quad_clean.evt |
| Size (bytes) | 549,230,400 | 144,803,520 |
| Size | 523.8 MB | 138.1 MB |
| Events in quadrant A | 3,612,249 | 1,000,708 |
| Events in quadrant B | 3,750,485 | 993,757 |
| Events in quadrant C | 3,607,727 | 940,399 |
| Events in quadrant D | 5,152,973 | 928,029 |
| Mode M0 | |||
|---|---|---|---|
| Quadrant | BADHDUFLAG | Total packets | Discarded packets |
| A | 0 | 15586 | 2 |
| B | 0 | 15963 | 2 |
| C | 0 | 15573 | 2 |
| D | 0 | 20323 | 3 |
| Mode SS | |||
|---|---|---|---|
| Quadrant | BADHDUFLAG | Total packets | Discarded packets |
| A | 0 | 152 | 0 |
| B | 0 | 152 | 0 |
| C | 0 | 152 | 0 |
| D | 0 | 152 | 0 |
| Mode M9 | |||
|---|---|---|---|
| Quadrant | BADHDUFLAG | Total packets | Discarded packets |
| A | 0 | 3 | 0 |
| B | 0 | 3 | 0 |
| C | 0 | 3 | 0 |
| D | 0 | 3 | 0 |
| Quadrant | Total seconds | Saturated seconds | Saturation percentage |
|---|---|---|---|
| A | 7518 | 31 | 0.412344% |
| B | 7519 | 83 | 1.103870% |
| C | 7519 | 113 | 1.502859% |
| D | 7518 | 263 | 3.498271% |
Noise dominated data is calculated using 1-second bins in cleaned event files. If a bin has >2000 counts, and if more than 50% of those come from <1% of pixels, then it is considered to be noise-dominated and hence unusable.
| Quadrant | # 1 sec bins | Bins with >0 counts | Bins with >2000 counts | High rate bins dominated by noise | Noise dominated (total time) | Noise dominated (detector-on time) | Marked lightcurve |
|---|---|---|---|---|---|---|---|
| A | 7783 | 7519 | 0 | 0 | 0.00% | 0.00% | 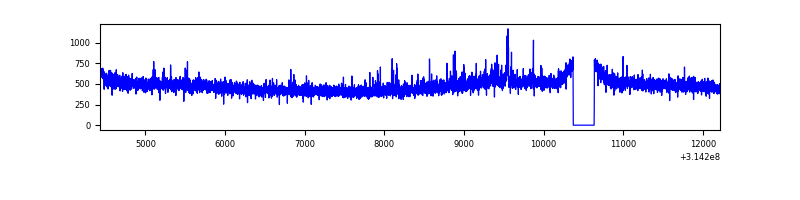 |
| B | 7784 | 7520 | 5 | 5 | 0.06% | 0.07% | 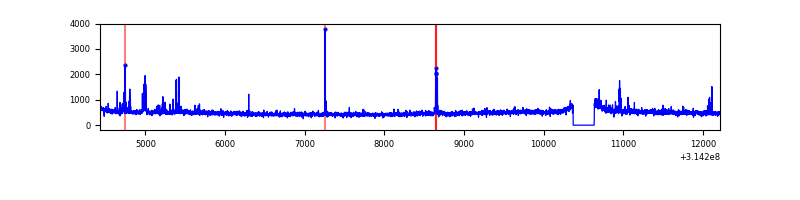 |
| C | 7784 | 7520 | 1 | 1 | 0.01% | 0.01% | 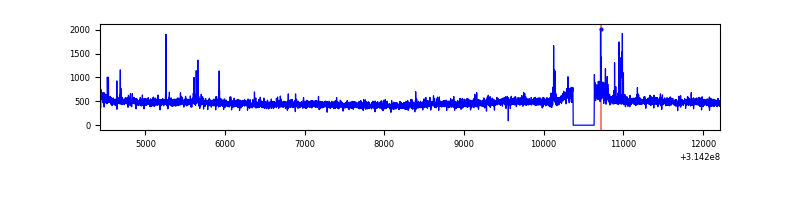 |
| D | 7783 | 7519 | 159 | 159 | 2.04% | 2.11% | 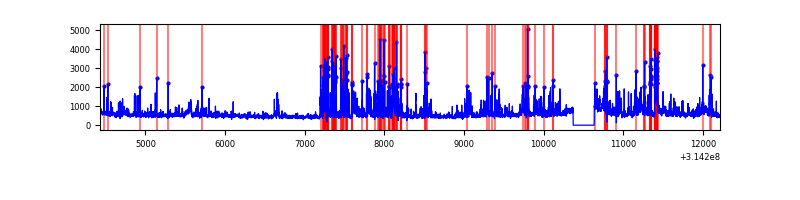 |
Top three noisy pixels from each quadrant. If the there are fewer than three noisy pixels in the level2.evt file, extra rows are filled as -1
| Pixel properties | Quadrant properties | ||||||
|---|---|---|---|---|---|---|---|
| Quadrant | DetID | PixID | Counts | Sigma | Mean | Median | Sigma |
| A | 11 | 47 | 75124 | 406.55 | 914 | 897 | 182.6 |
| A | 13 | 254 | 13959 | 71.54 | 914 | 897 | 182.6 |
| A | 13 | 252 | 9761 | 48.55 | 914 | 897 | 182.6 |
| B | 0 | 190 | 67658 | 391.55 | 906 | 884 | 170.5 |
| B | 0 | 228 | 48272 | 277.87 | 906 | 884 | 170.5 |
| B | 0 | 230 | 31393 | 178.9 | 906 | 884 | 170.5 |
| C | 14 | 238 | 138633 | 676.57 | 870 | 874 | 203.6 |
| C | 0 | 207 | 35266 | 168.91 | 870 | 874 | 203.6 |
| C | 2 | 16 | 27738 | 131.94 | 870 | 874 | 203.6 |
| D | 1 | 52 | 1518818 | 7112.39 | 883 | 859 | 213.4 |
| D | 2 | 152 | 66524 | 307.67 | 883 | 859 | 213.4 |
| D | 8 | 195 | 59797 | 276.15 | 883 | 859 | 213.4 |
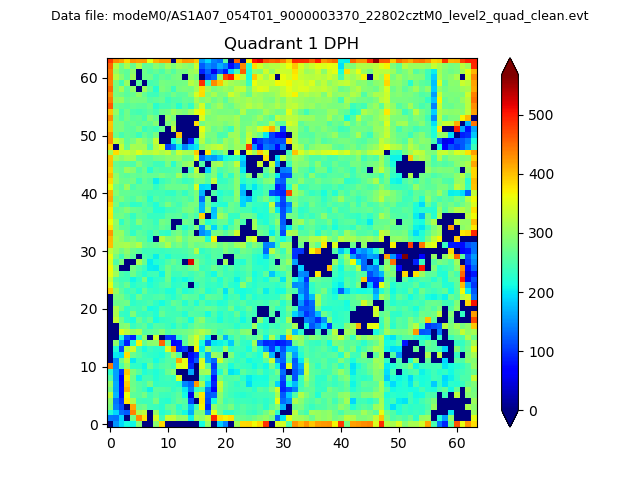
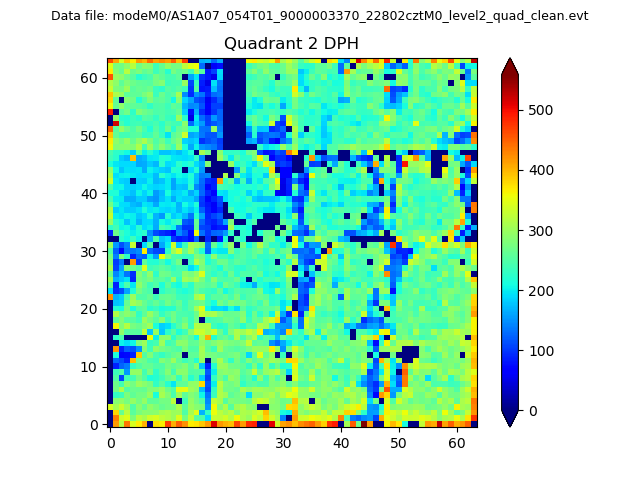
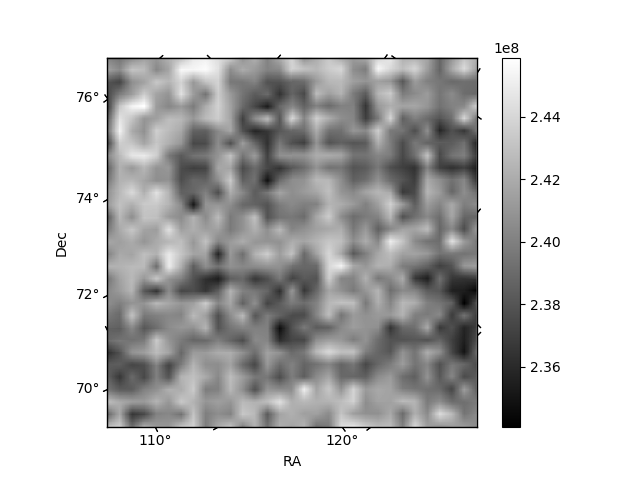
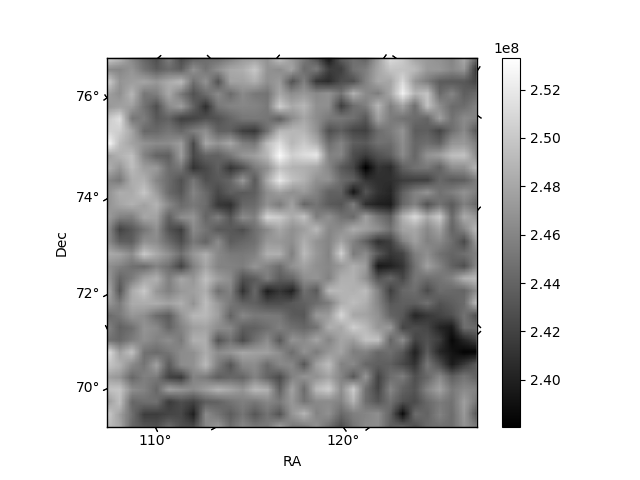
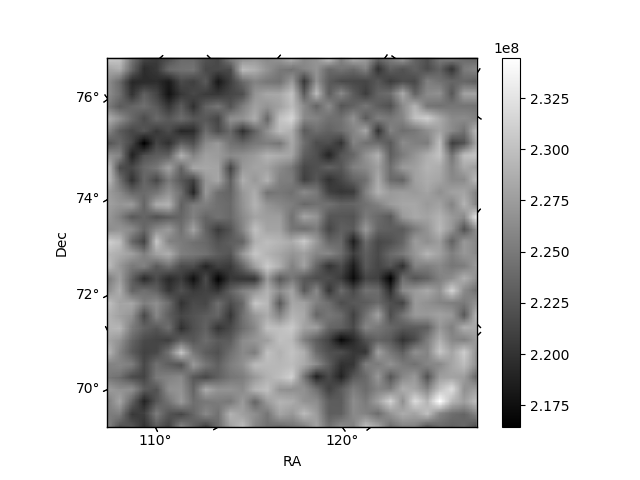
Histogram calculated using DETX and DETY for each event in the final _common_clean file
| Quadrant A |  |
 |
Quadrant B |
|---|---|---|---|
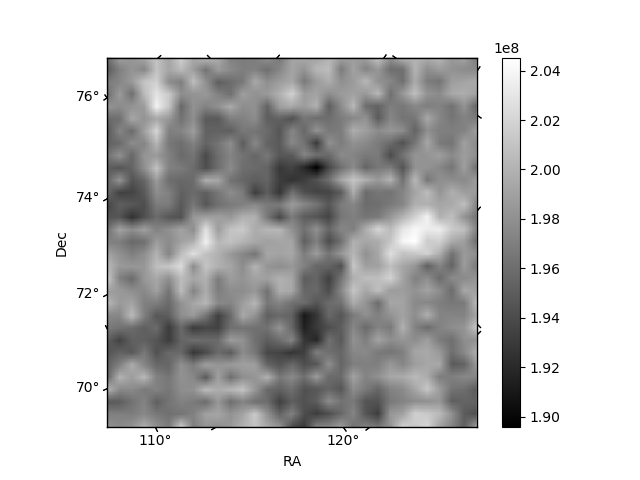
| Quadrant D |  |
 |
Quadrant C |
| Plot type | Count rate plots | Images |
|---|---|---|
| Comparison with Poisson distribution Blue bars denote a histogram of data divided into 1 sec bins. Red curve is a Poisson curve with rate = median count rate of data. |
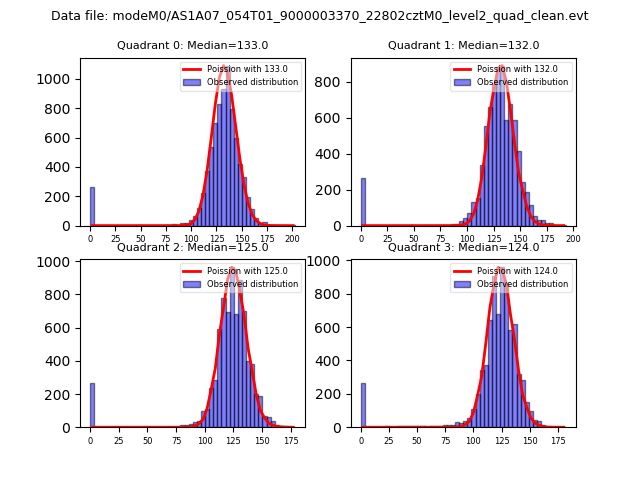 |
 |
| Quadrant-wise count rates Data is divided into 100 sec bins |
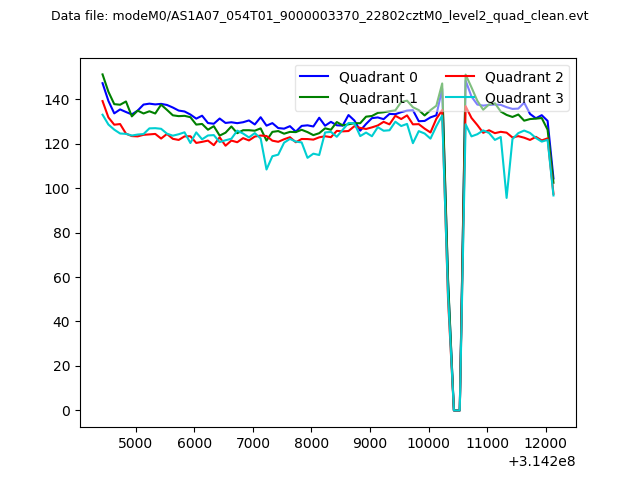 |
|
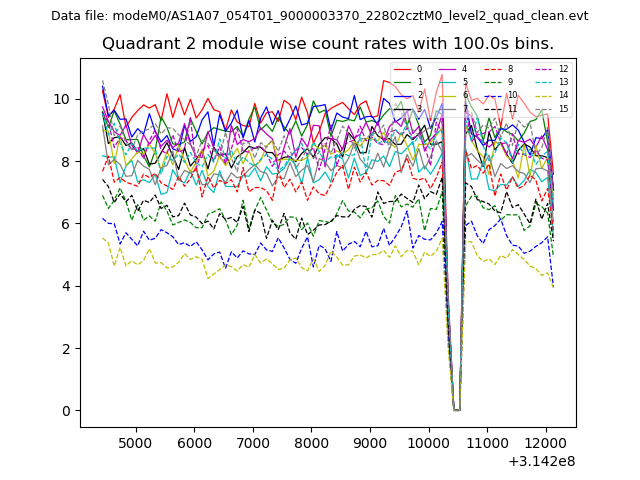
| Module-wise count rates for Quadrant A Data is divided into 100 sec bins |
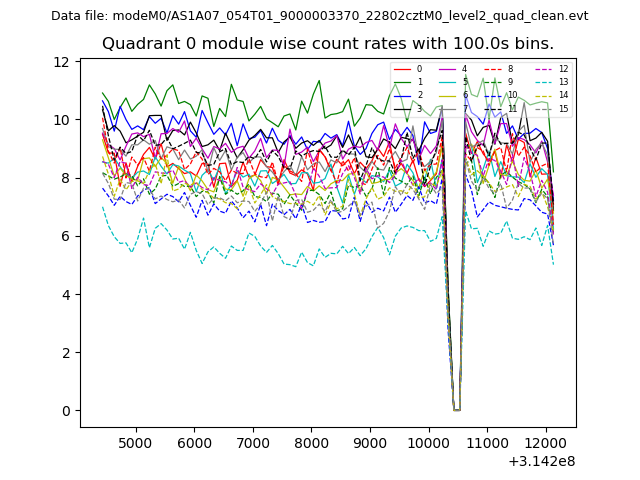 |
 |
| Module-wise count rates for Quadrant B Data is divided into 100 sec bins |
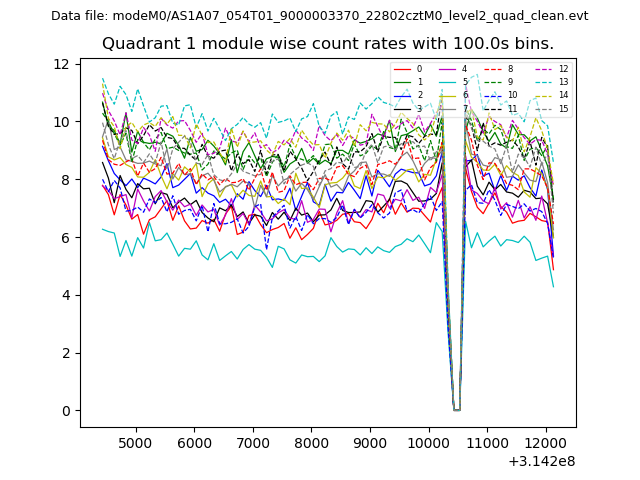 |
 |
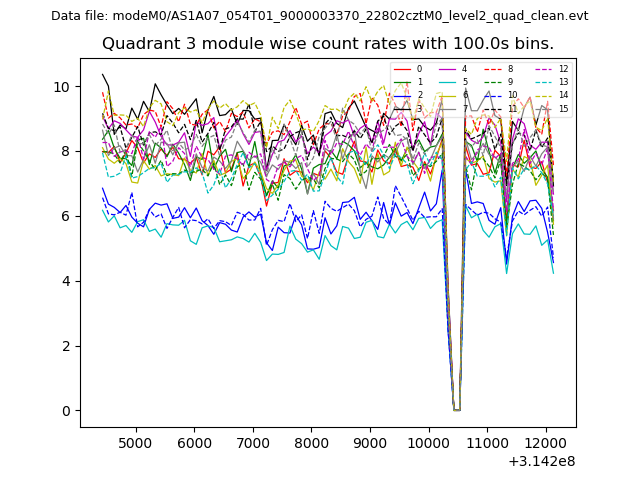
| Module-wise count rates for Quadrant C Data is divided into 100 sec bins |
 |
 |
| Module-wise count rates for Quadrant D Data is divided into 100 sec bins |
 |
 |
| Parameter | Plot |
|---|---|
| CZT HV Monitor | 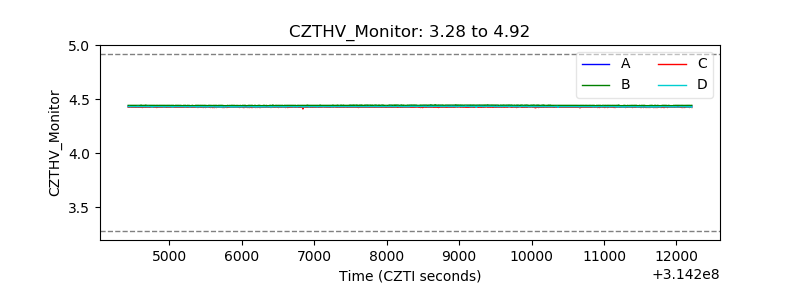 |
| D_VDD | 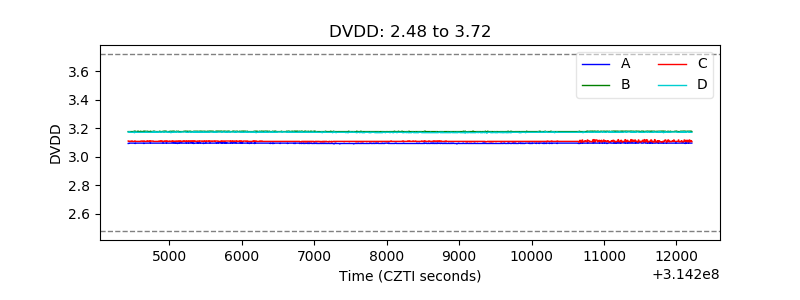 |
| Temperature 1 | 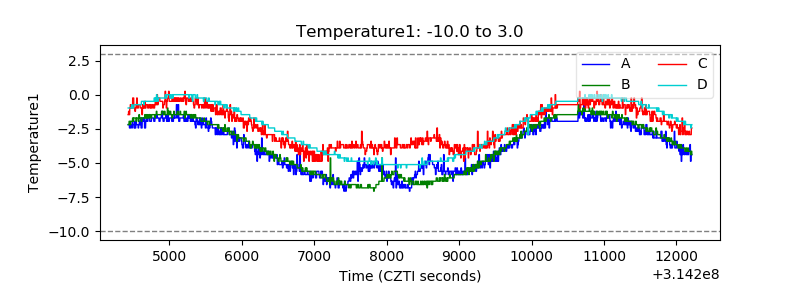 |
| Veto HV Monitor | 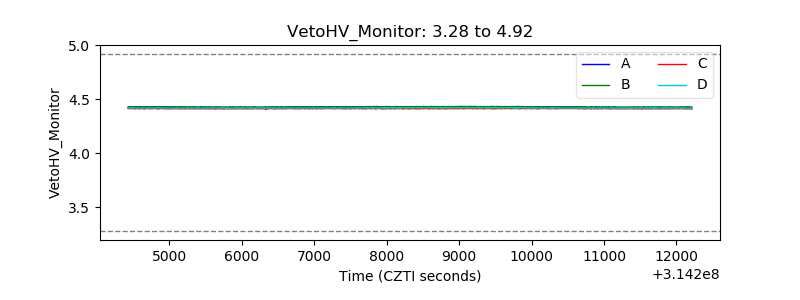 |
| Veto LLD | 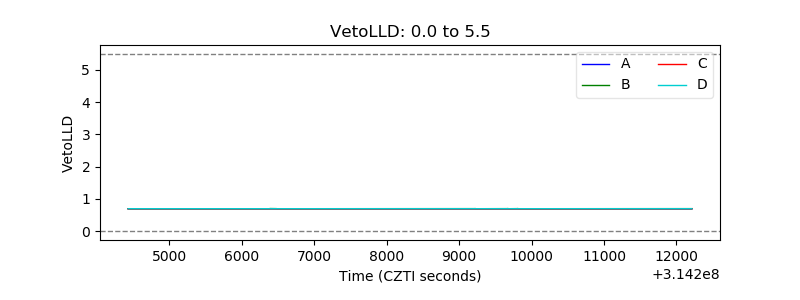 |
| Alpha Counter | 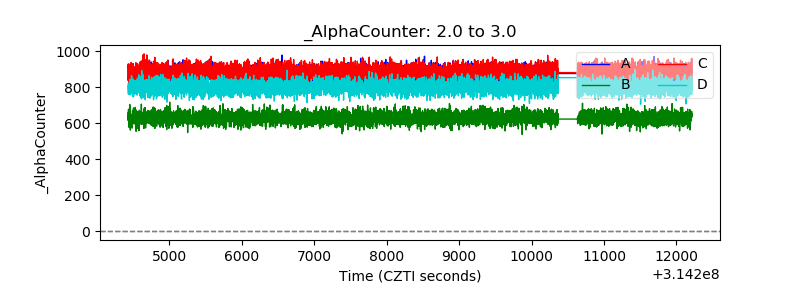 |
| _CPM_Rate |  |
| CZT Counter | 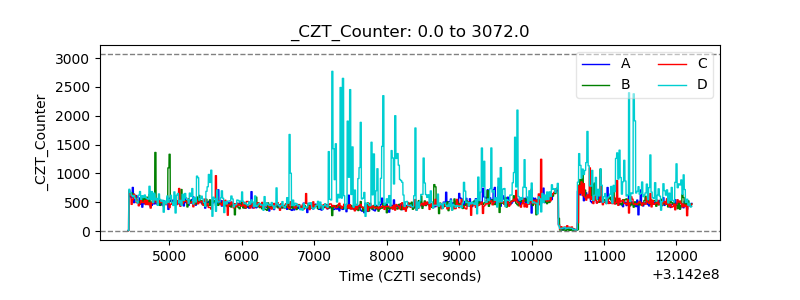 |
| +2.5 Volts monitor | 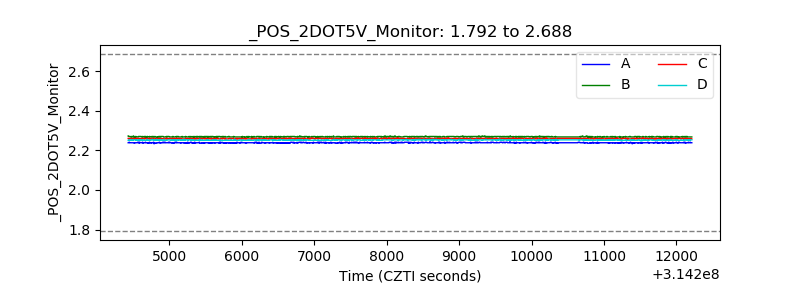 |
| +5 Volts monitor | 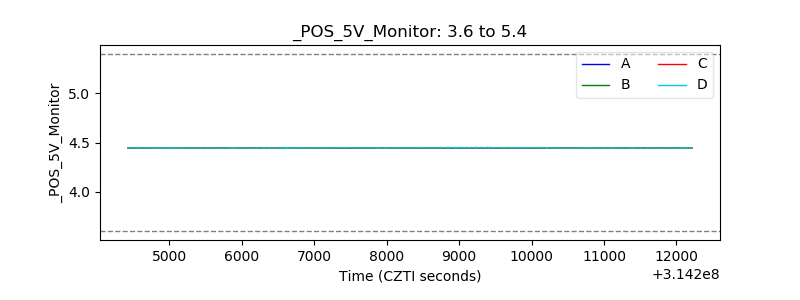 |
| _ROLL_ROT | 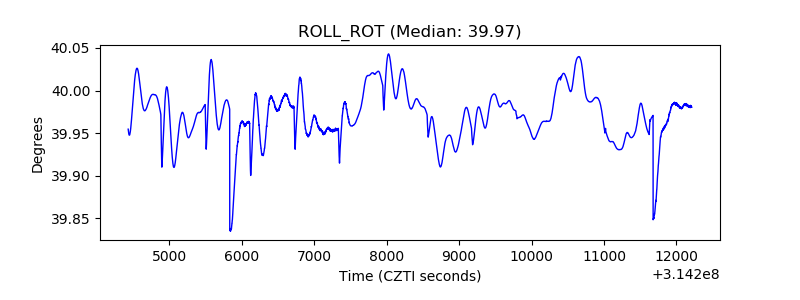 |
| _Roll_DEC | 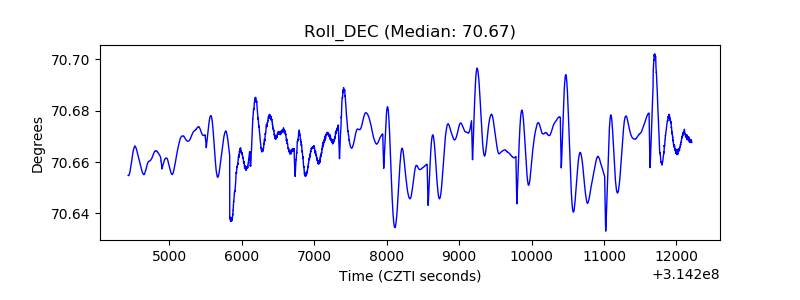 |
| _Roll_RA | 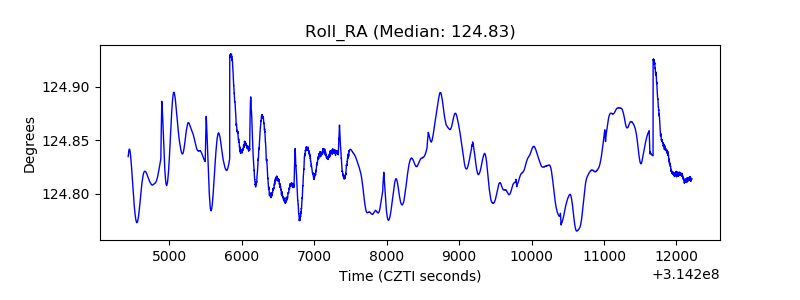 |
| Veto Counter | 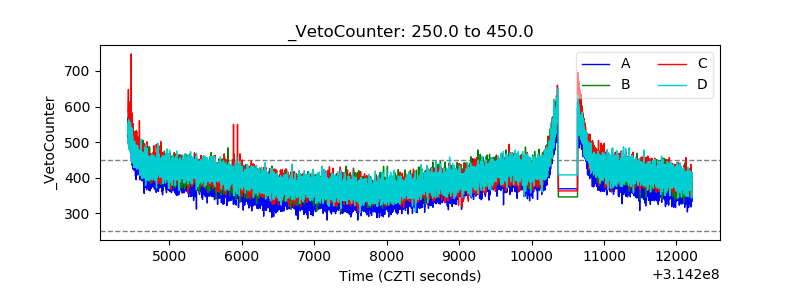 |