| Param | Original file | Final file |
|---|---|---|
| Filename | modeM0/AS1A07_054T01_9000003370_22803cztM0_level2.evt | modeM0/AS1A07_054T01_9000003370_22803cztM0_level2_quad_clean.evt |
| Size (bytes) | 569,592,000 | 141,733,440 |
| Size | 543.2 MB | 135.2 MB |
| Events in quadrant A | 3,500,970 | 981,658 |
| Events in quadrant B | 3,668,324 | 973,250 |
| Events in quadrant C | 3,604,716 | 925,922 |
| Events in quadrant D | 5,970,051 | 892,777 |
| Mode M0 | |||
|---|---|---|---|
| Quadrant | BADHDUFLAG | Total packets | Discarded packets |
| A | 0 | 15327 | 2 |
| B | 0 | 15744 | 2 |
| C | 0 | 15490 | 2 |
| D | 0 | 22760 | 2 |
| Mode SS | |||
|---|---|---|---|
| Quadrant | BADHDUFLAG | Total packets | Discarded packets |
| A | 0 | 152 | 0 |
| B | 0 | 152 | 0 |
| C | 0 | 152 | 0 |
| D | 0 | 152 | 0 |
| Mode M9 | |||
|---|---|---|---|
| Quadrant | BADHDUFLAG | Total packets | Discarded packets |
| A | 0 | 4 | 0 |
| B | 0 | 5 | 0 |
| C | 0 | 5 | 0 |
| D | 0 | 5 | 0 |
| Quadrant | Total seconds | Saturated seconds | Saturation percentage |
|---|---|---|---|
| A | 7458 | 41 | 0.549745% |
| B | 7458 | 100 | 1.340842% |
| C | 7458 | 124 | 1.662644% |
| D | 7458 | 644 | 8.635023% |
Noise dominated data is calculated using 1-second bins in cleaned event files. If a bin has >2000 counts, and if more than 50% of those come from <1% of pixels, then it is considered to be noise-dominated and hence unusable.
| Quadrant | # 1 sec bins | Bins with >0 counts | Bins with >2000 counts | High rate bins dominated by noise | Noise dominated (total time) | Noise dominated (detector-on time) | Marked lightcurve |
|---|---|---|---|---|---|---|---|
| A | 7808 | 7459 | 0 | 0 | 0.00% | 0.00% |  |
| B | 7808 | 7459 | 0 | 0 | 0.00% | 0.00% |  |
| C | 7808 | 7459 | 3 | 3 | 0.04% | 0.04% |  |
| D | 7808 | 7458 | 390 | 390 | 4.99% | 5.23% | 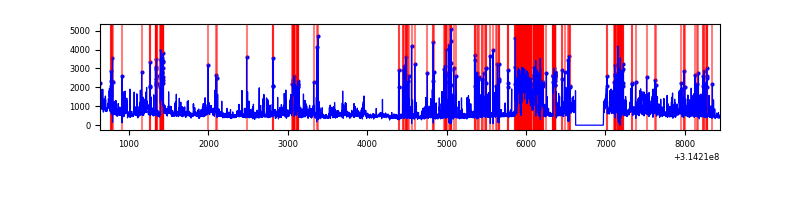 |
Top three noisy pixels from each quadrant. If the there are fewer than three noisy pixels in the level2.evt file, extra rows are filled as -1
| Pixel properties | Quadrant properties | ||||||
|---|---|---|---|---|---|---|---|
| Quadrant | DetID | PixID | Counts | Sigma | Mean | Median | Sigma |
| A | 13 | 254 | 14090 | 72.58 | 906 | 888 | 181.9 |
| A | 0 | 226 | 7950 | 38.83 | 906 | 888 | 181.9 |
| A | 3 | 137 | 7531 | 36.52 | 906 | 888 | 181.9 |
| B | 0 | 190 | 60228 | 349.78 | 897 | 873 | 169.7 |
| B | 0 | 228 | 46601 | 269.47 | 897 | 873 | 169.7 |
| B | 0 | 230 | 30023 | 171.78 | 897 | 873 | 169.7 |
| C | 14 | 238 | 138263 | 678.38 | 866 | 873 | 202.5 |
| C | 2 | 16 | 30696 | 147.25 | 866 | 873 | 202.5 |
| C | 0 | 207 | 22905 | 108.79 | 866 | 873 | 202.5 |
| D | 1 | 52 | 2250639 | 10912.87 | 857 | 835 | 206.2 |
| D | 6 | 112 | 167111 | 806.54 | 857 | 835 | 206.2 |
| D | 2 | 152 | 121988 | 587.66 | 857 | 835 | 206.2 |
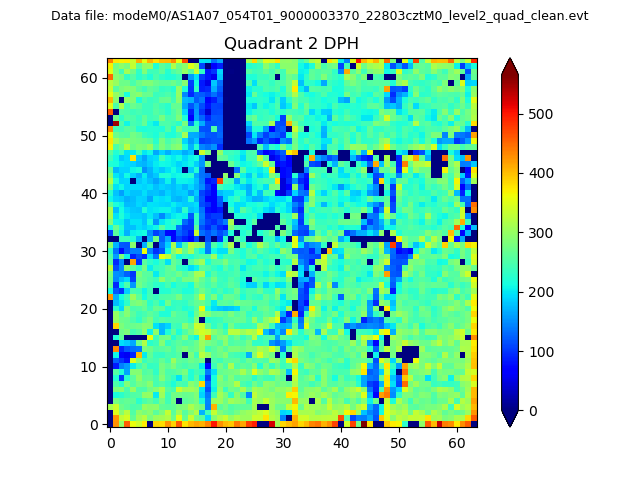
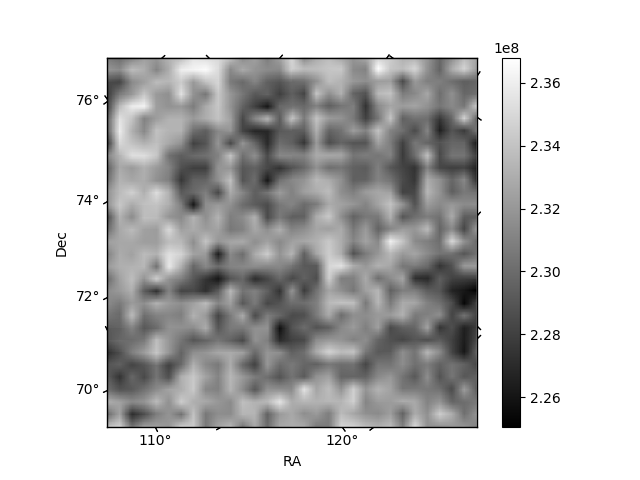
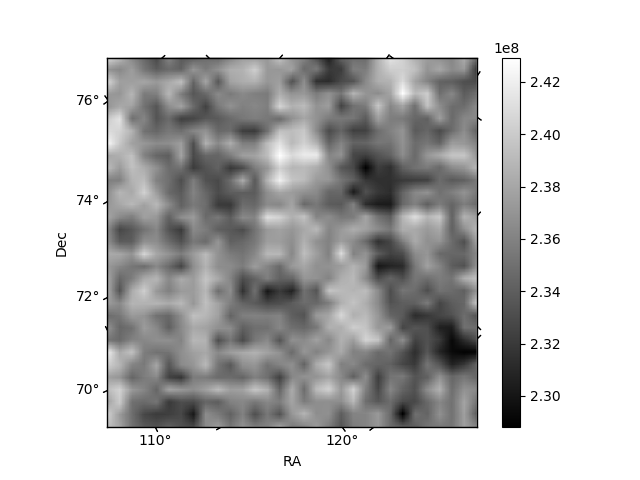
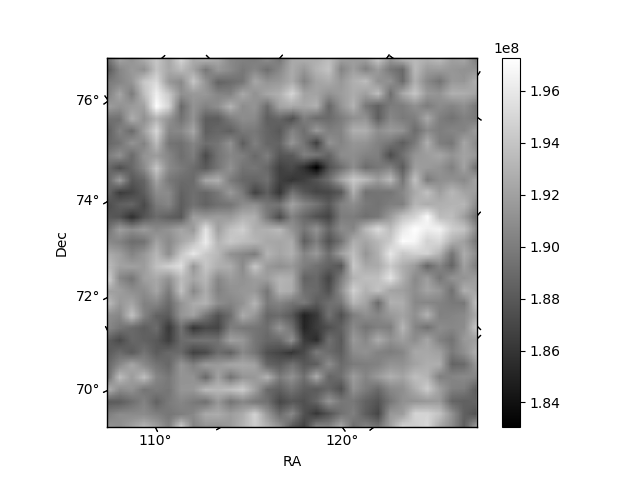
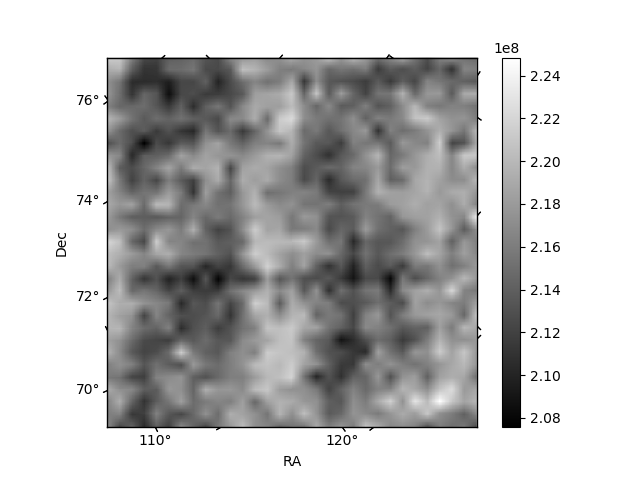
Histogram calculated using DETX and DETY for each event in the final _common_clean file
| Quadrant A | 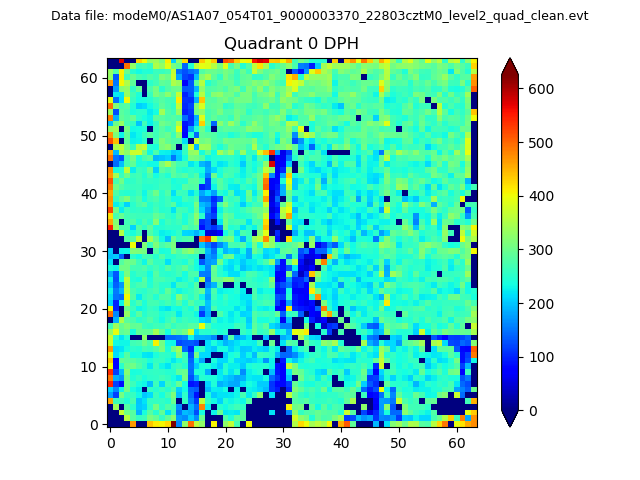 |
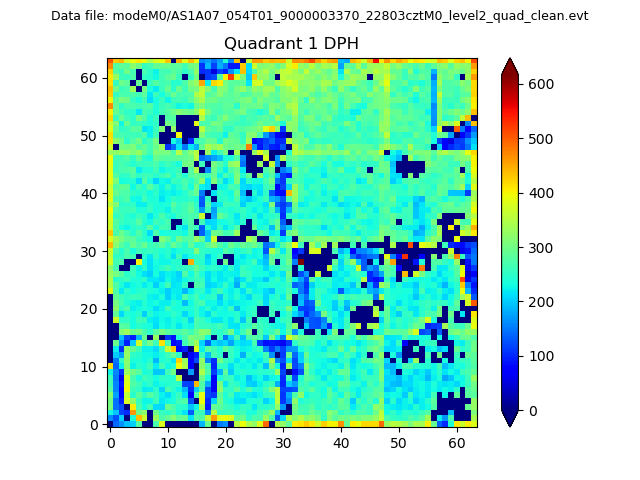 |
Quadrant B |
|---|---|---|---|
| Quadrant D | 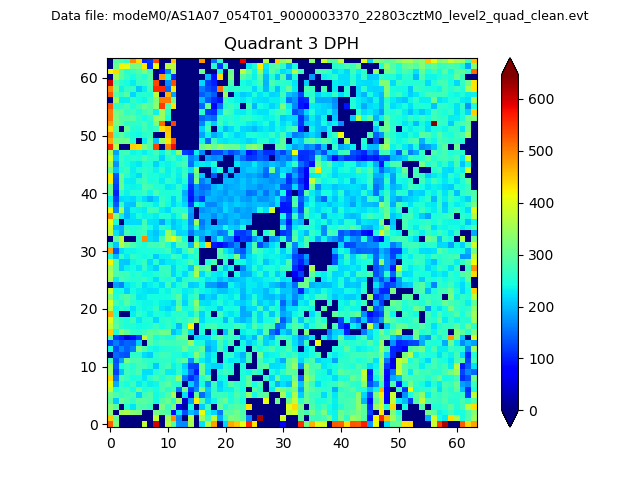 |
 |
Quadrant C |
| Plot type | Count rate plots | Images |
|---|---|---|
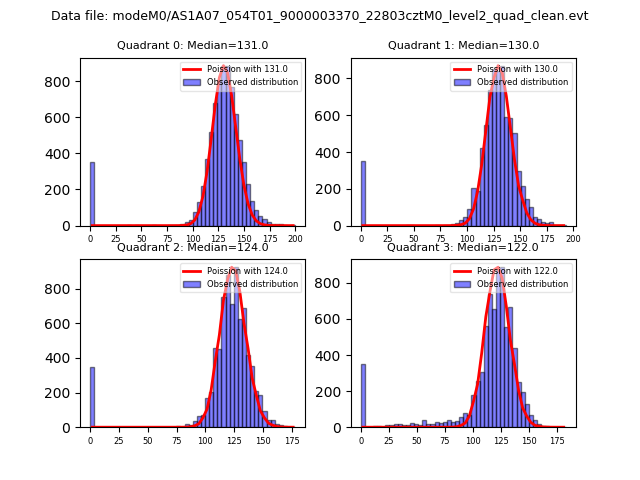
| Comparison with Poisson distribution Blue bars denote a histogram of data divided into 1 sec bins. Red curve is a Poisson curve with rate = median count rate of data. |
 |
 |
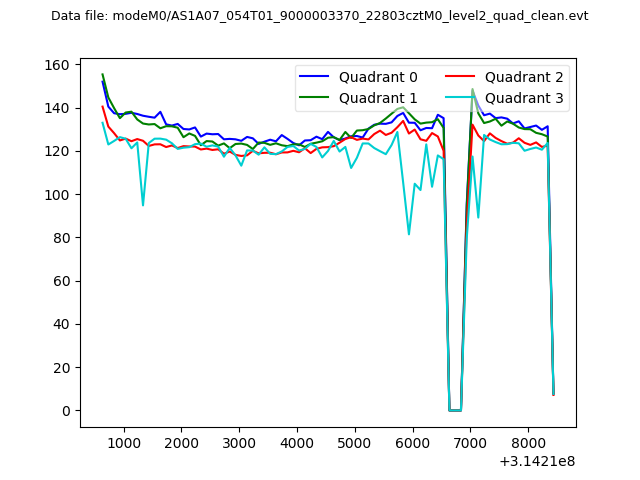
| Quadrant-wise count rates Data is divided into 100 sec bins |
 |
|
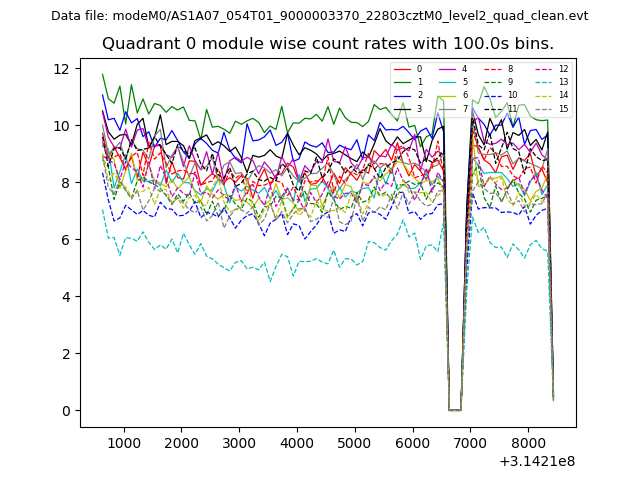
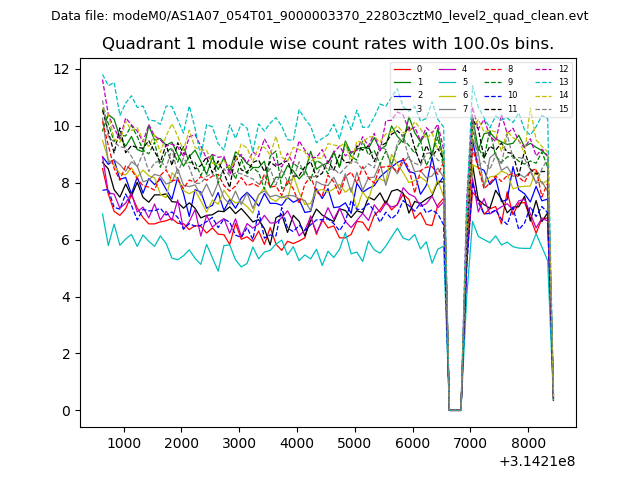
| Module-wise count rates for Quadrant A Data is divided into 100 sec bins |
 |
 |
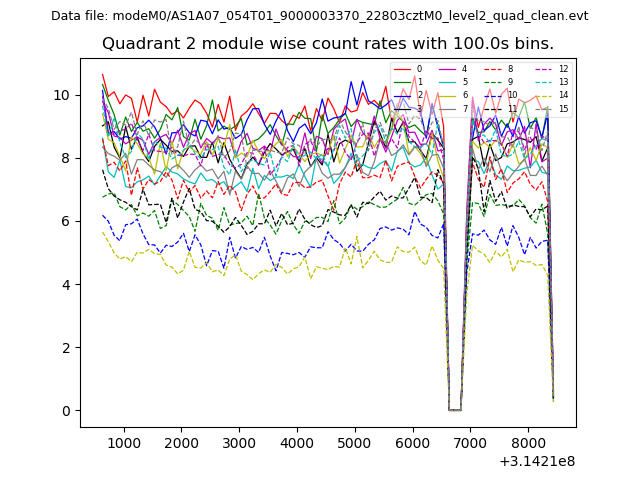
| Module-wise count rates for Quadrant B Data is divided into 100 sec bins |
 |
 |
| Module-wise count rates for Quadrant C Data is divided into 100 sec bins |
 |
 |
| Module-wise count rates for Quadrant D Data is divided into 100 sec bins |
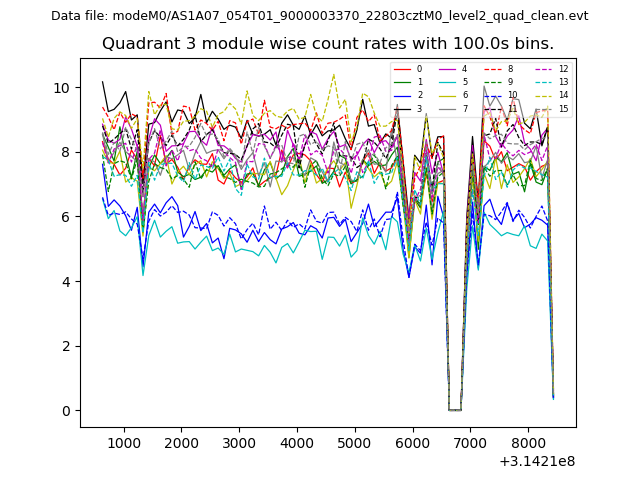 |
 |
| Parameter | Plot |
|---|---|
| CZT HV Monitor | 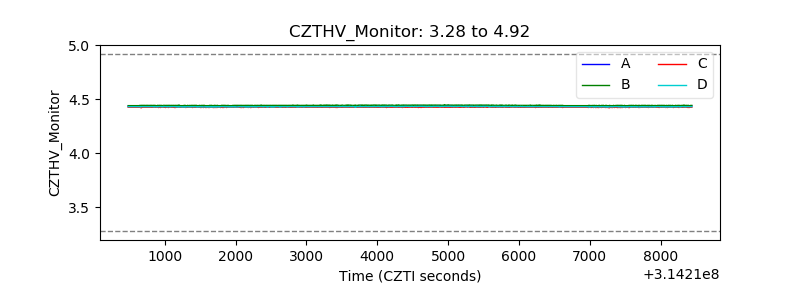 |
| D_VDD | 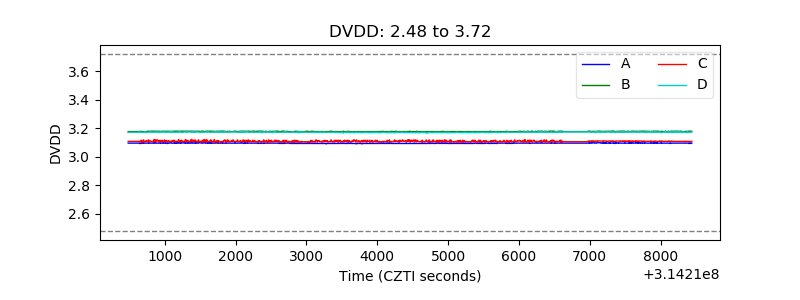 |
| Temperature 1 | 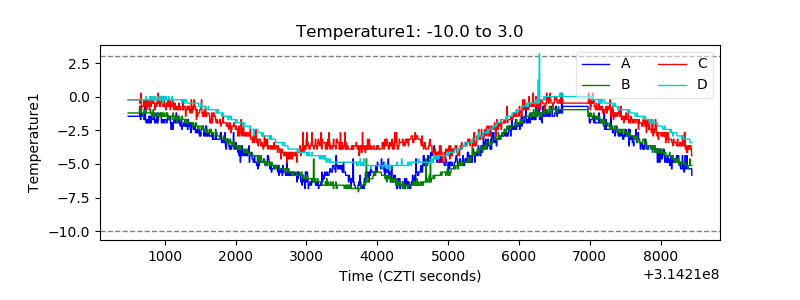 |
| Veto HV Monitor | 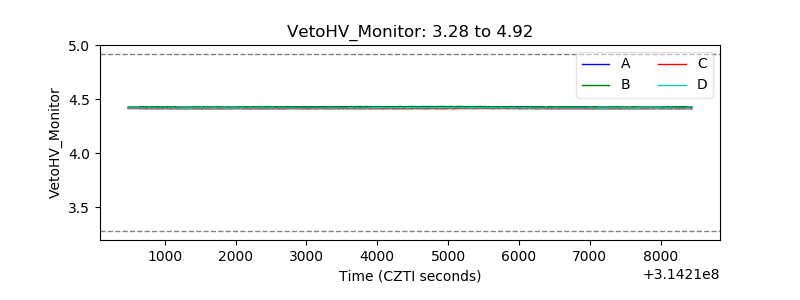 |
| Veto LLD | 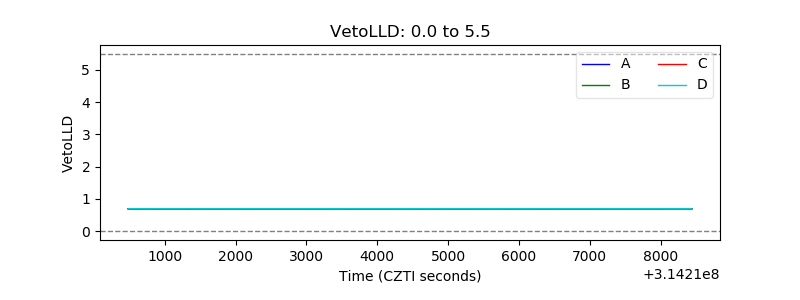 |
| Alpha Counter | 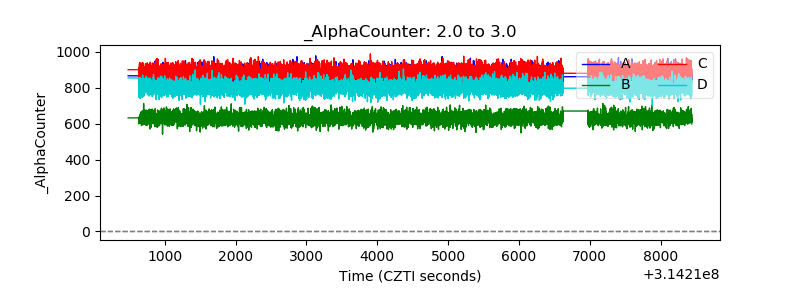 |
| _CPM_Rate | 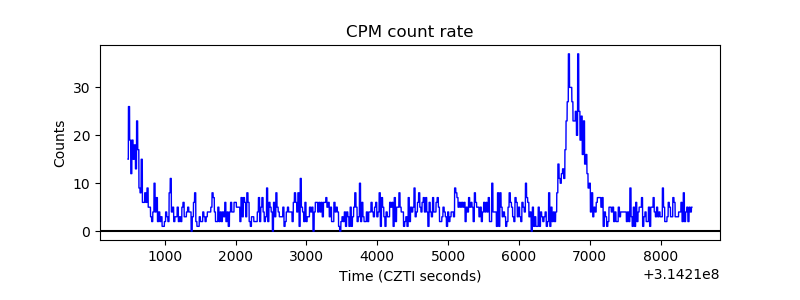 |
| CZT Counter | 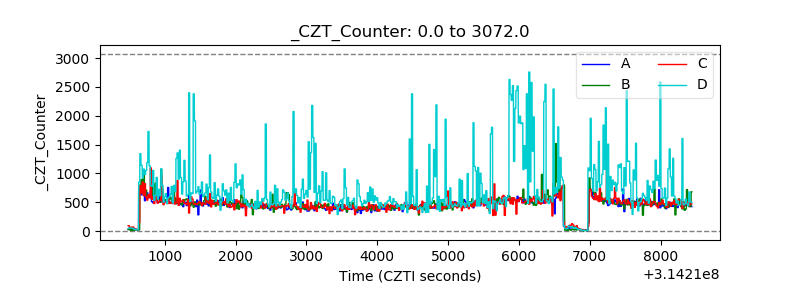 |
| +2.5 Volts monitor |  |
| +5 Volts monitor | 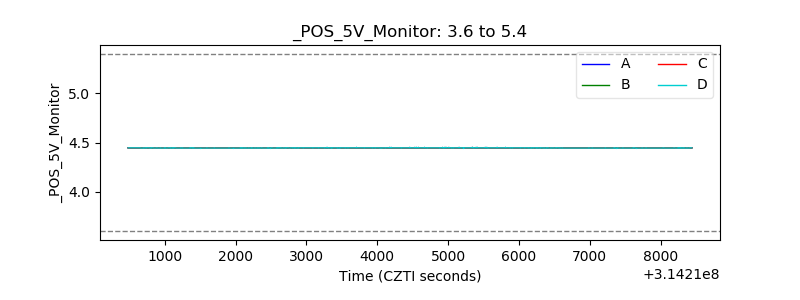 |
| _ROLL_ROT | 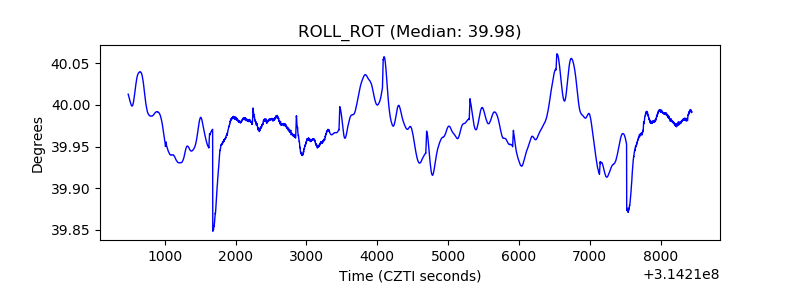 |
| _Roll_DEC | 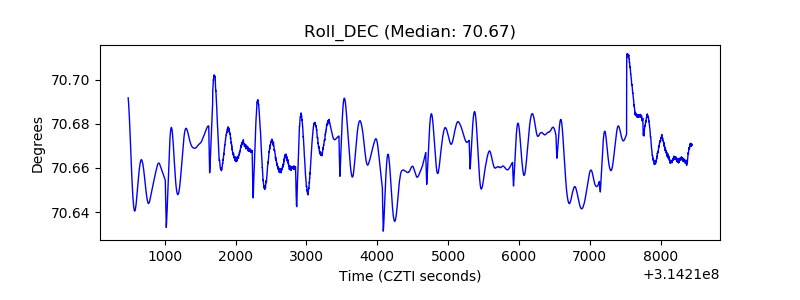 |
| _Roll_RA | 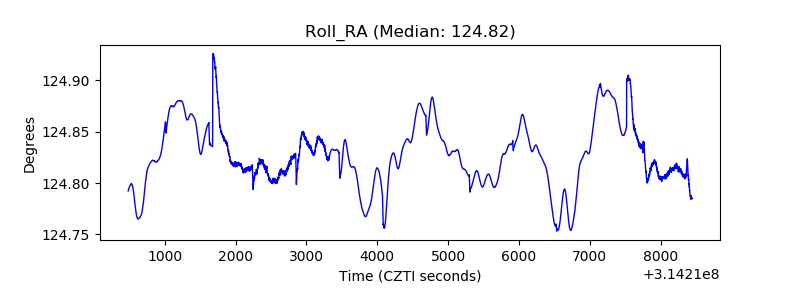 |
| Veto Counter | 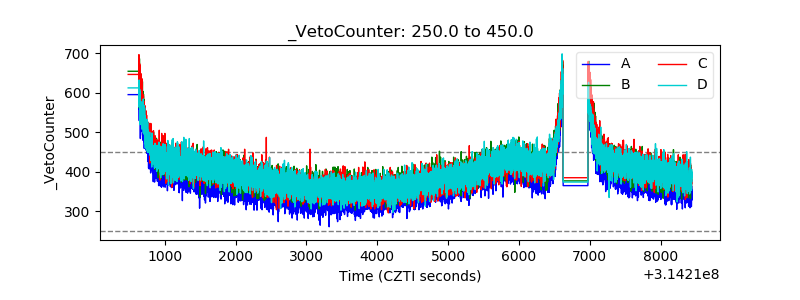 |