| Param | Original file | Final file |
|---|---|---|
| Filename | modeM0/AS1A07_054T01_9000003370_22806cztM0_level2.evt | modeM0/AS1A07_054T01_9000003370_22806cztM0_level2_quad_clean.evt |
| Size (bytes) | 1,383,125,760 | 348,246,720 |
| Size | 1.3 GB | 332.1 MB |
| Events in quadrant A | 8,507,121 | 2,397,989 |
| Events in quadrant B | 8,815,114 | 2,388,907 |
| Events in quadrant C | 8,697,058 | 2,295,595 |
| Events in quadrant D | 14,611,878 | 2,184,316 |
| Mode M0 | |||
|---|---|---|---|
| Quadrant | BADHDUFLAG | Total packets | Discarded packets |
| A | 0 | 37952 | 4 |
| B | 0 | 38760 | 4 |
| C | 0 | 38280 | 4 |
| D | 0 | 56457 | 5 |
| Mode SS | |||
|---|---|---|---|
| Quadrant | BADHDUFLAG | Total packets | Discarded packets |
| A | 0 | 380 | 0 |
| B | 0 | 380 | 0 |
| C | 0 | 380 | 0 |
| D | 0 | 380 | 0 |
| Mode M9 | |||
|---|---|---|---|
| Quadrant | BADHDUFLAG | Total packets | Discarded packets |
| A | 0 | 24 | 0 |
| B | 0 | 24 | 0 |
| C | 0 | 24 | 0 |
| D | 0 | 24 | 0 |
| Quadrant | Total seconds | Saturated seconds | Saturation percentage |
|---|---|---|---|
| A | 18602 | 51 | 0.274164% |
| B | 18603 | 125 | 0.671935% |
| C | 18603 | 234 | 1.257862% |
| D | 18602 | 1593 | 8.563595% |
Noise dominated data is calculated using 1-second bins in cleaned event files. If a bin has >2000 counts, and if more than 50% of those come from <1% of pixels, then it is considered to be noise-dominated and hence unusable.
| Quadrant | # 1 sec bins | Bins with >0 counts | Bins with >2000 counts | High rate bins dominated by noise | Noise dominated (total time) | Noise dominated (detector-on time) | Marked lightcurve |
|---|---|---|---|---|---|---|---|
| A | 21022 | 18606 | 0 | 0 | 0.00% | 0.00% | 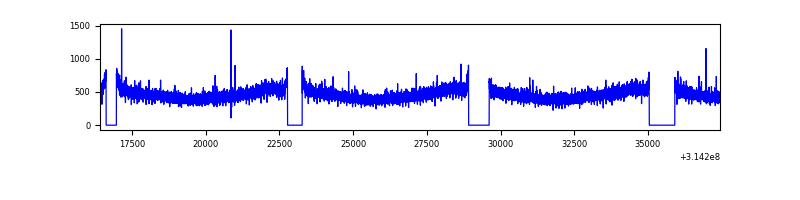 |
| B | 21023 | 18607 | 1 | 1 | 0.00% | 0.01% | 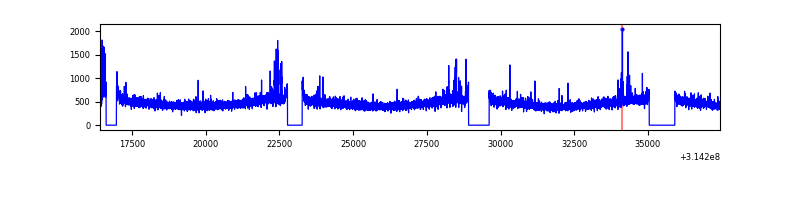 |
| C | 21023 | 18607 | 4 | 4 | 0.02% | 0.02% | 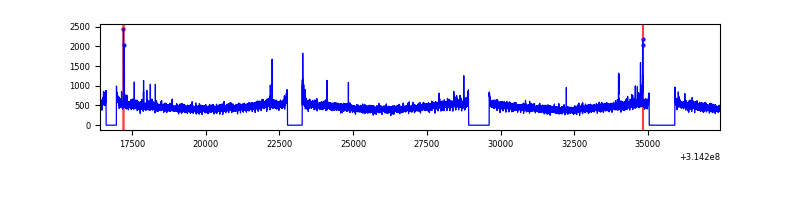 |
| D | 21022 | 18605 | 1040 | 1040 | 4.95% | 5.59% | 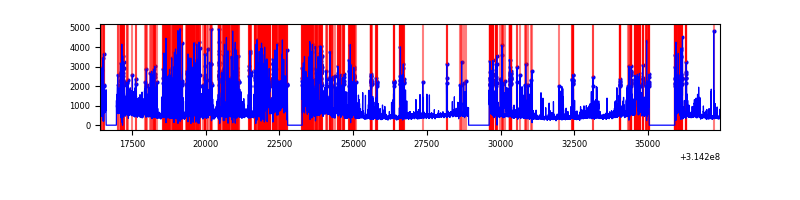 |
Top three noisy pixels from each quadrant. If the there are fewer than three noisy pixels in the level2.evt file, extra rows are filled as -1
| Pixel properties | Quadrant properties | ||||||
|---|---|---|---|---|---|---|---|
| Quadrant | DetID | PixID | Counts | Sigma | Mean | Median | Sigma |
| A | 13 | 254 | 33730 | 71.96 | 2204 | 2159 | 438.7 |
| A | 0 | 226 | 18839 | 38.02 | 2204 | 2159 | 438.7 |
| A | 3 | 137 | 18663 | 37.62 | 2204 | 2159 | 438.7 |
| B | 0 | 190 | 145029 | 346.37 | 2193 | 2135 | 412.5 |
| B | 12 | 111 | 50028 | 116.09 | 2193 | 2135 | 412.5 |
| B | 11 | 111 | 43353 | 99.91 | 2193 | 2135 | 412.5 |
| C | 14 | 238 | 335621 | 677.64 | 2116 | 2123 | 492.1 |
| C | 0 | 207 | 49783 | 96.84 | 2116 | 2123 | 492.1 |
| C | 0 | 239 | 22331 | 41.06 | 2116 | 2123 | 492.1 |
| D | 1 | 52 | 5183719 | 10344.2 | 2074 | 2011 | 500.9 |
| D | 13 | 172 | 661013 | 1315.56 | 2074 | 2011 | 500.9 |
| D | 2 | 152 | 407933 | 810.34 | 2074 | 2011 | 500.9 |
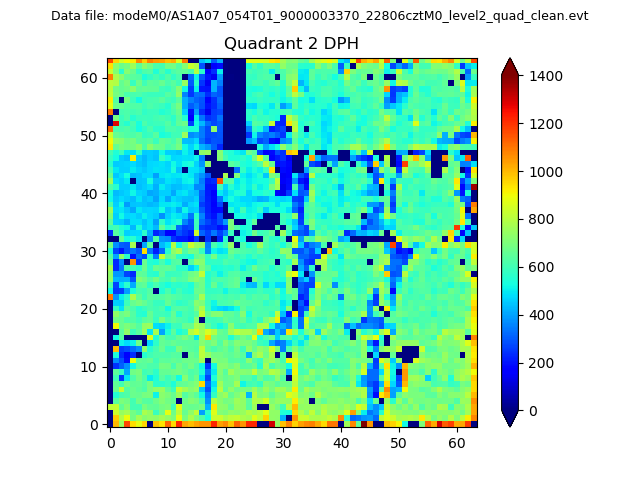
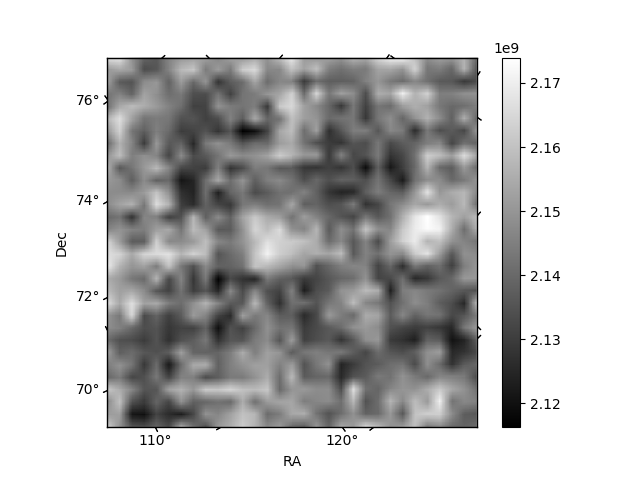
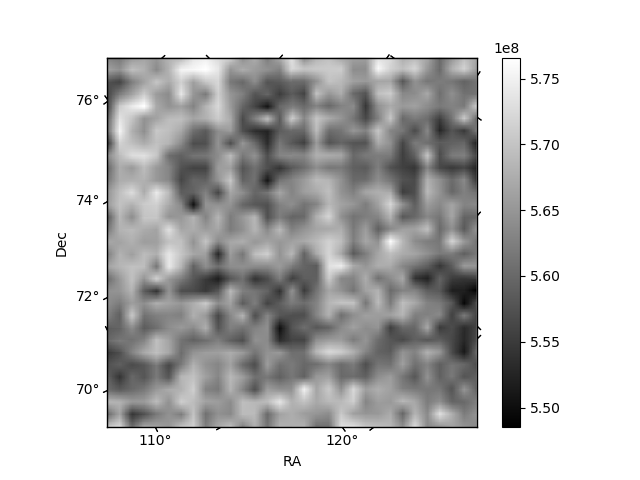
Histogram calculated using DETX and DETY for each event in the final _common_clean file
| Quadrant A | 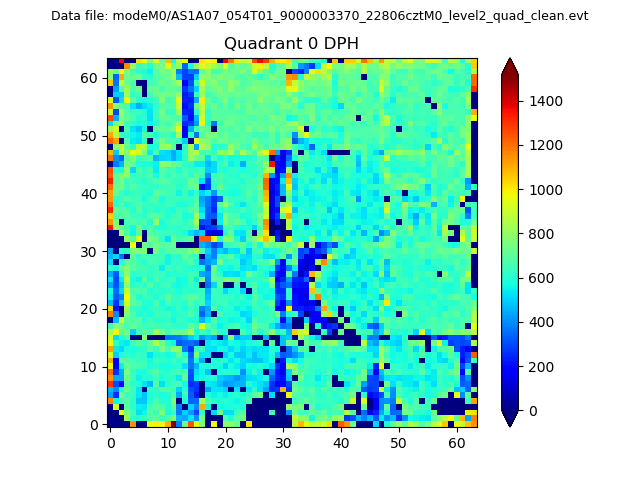 |
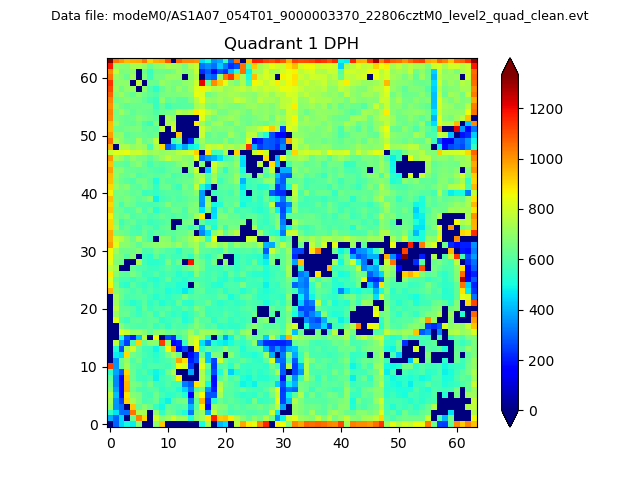 |
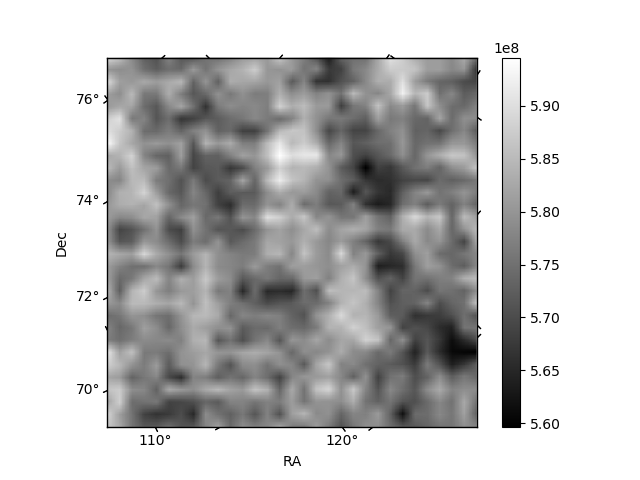
Quadrant B |
|---|---|---|---|
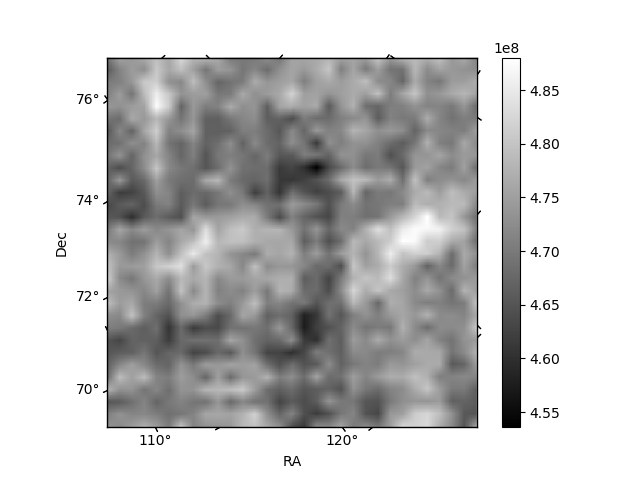
| Quadrant D | 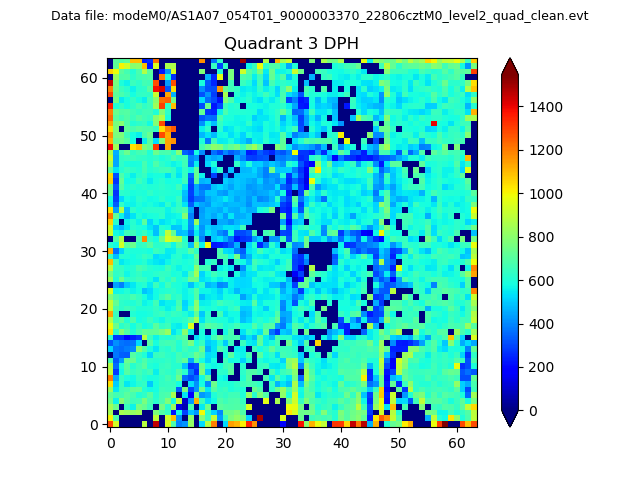 |
 |
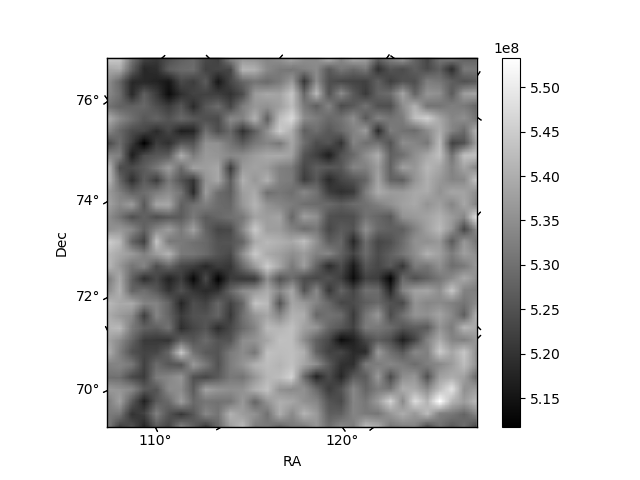
Quadrant C |
| Plot type | Count rate plots | Images |
|---|---|---|
| Comparison with Poisson distribution Blue bars denote a histogram of data divided into 1 sec bins. Red curve is a Poisson curve with rate = median count rate of data. |
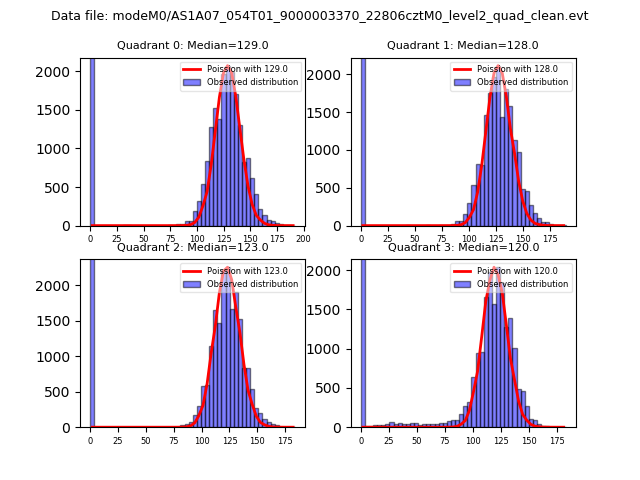 |
 |
| Quadrant-wise count rates Data is divided into 100 sec bins |
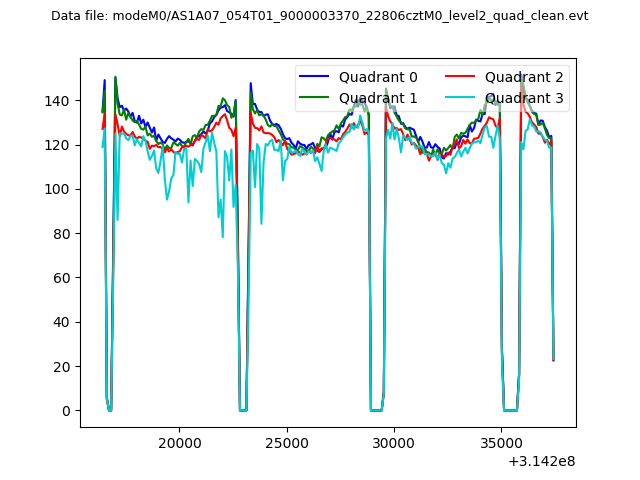 |
|
| Module-wise count rates for Quadrant A Data is divided into 100 sec bins |
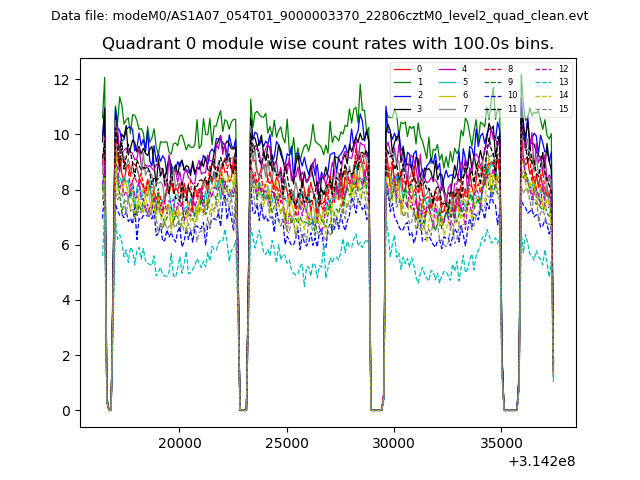 |
 |
| Module-wise count rates for Quadrant B Data is divided into 100 sec bins |
 |
 |
| Module-wise count rates for Quadrant C Data is divided into 100 sec bins |
 |
 |
| Module-wise count rates for Quadrant D Data is divided into 100 sec bins |
 |
 |
| Parameter | Plot |
|---|---|
| CZT HV Monitor |  |
| D_VDD |  |
| Temperature 1 | 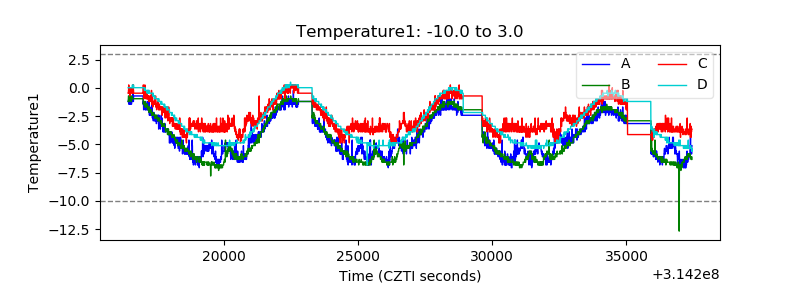 |
| Veto HV Monitor |  |
| Veto LLD | 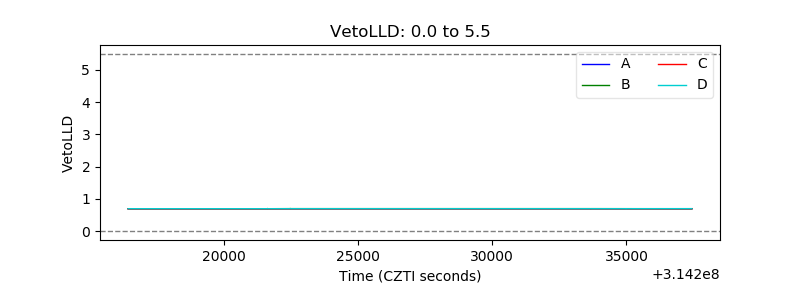 |
| Alpha Counter | 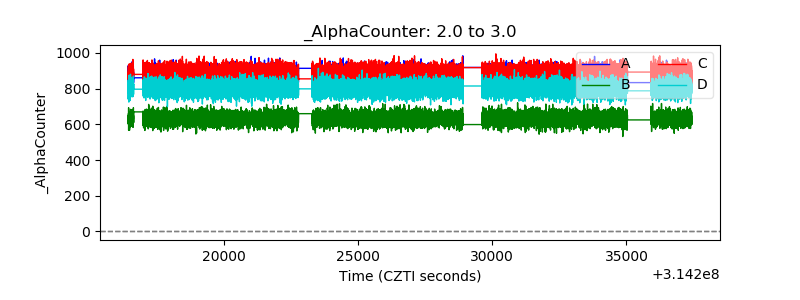 |
| _CPM_Rate | 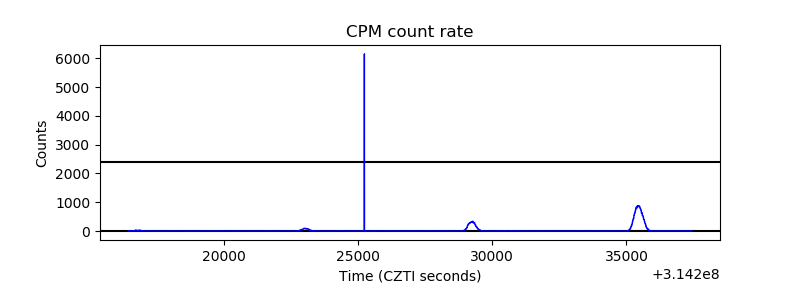 |
| CZT Counter | 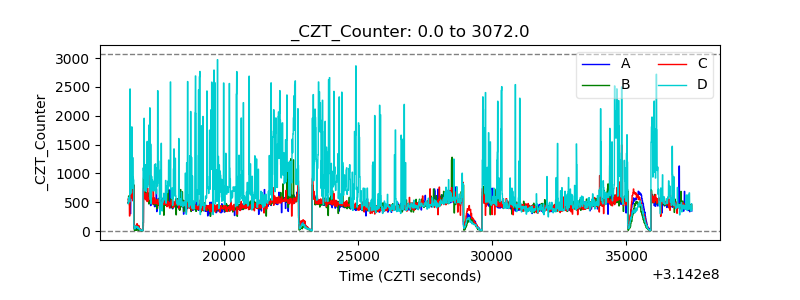 |
| +2.5 Volts monitor | 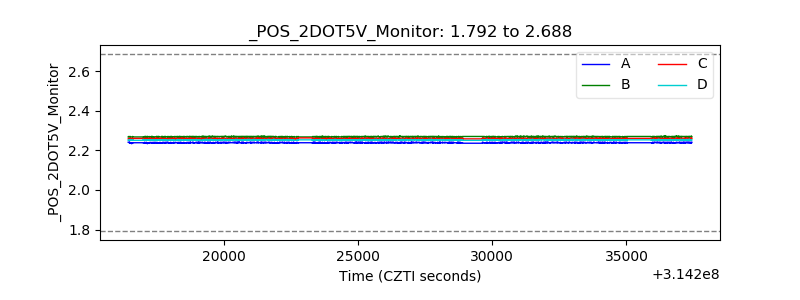 |
| +5 Volts monitor |  |
| _ROLL_ROT |  |
| _Roll_DEC |  |
| _Roll_RA | 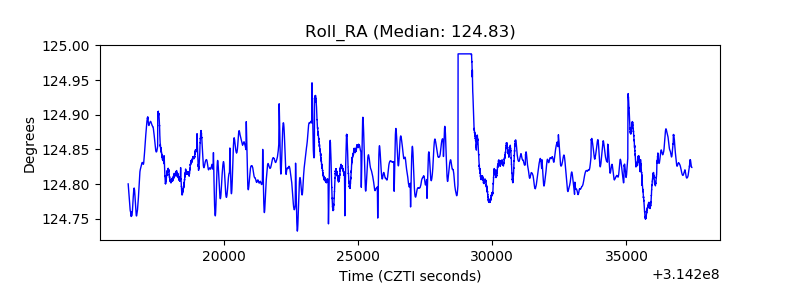 |
| Veto Counter |  |