| Param | Original file | Final file |
|---|---|---|
| Filename | modeM0/AS1A07_054T01_9000003370_22807cztM0_level2.evt | modeM0/AS1A07_054T01_9000003370_22807cztM0_level2_quad_clean.evt |
| Size (bytes) | 520,447,680 | 139,916,160 |
| Size | 496.3 MB | 133.4 MB |
| Events in quadrant A | 3,350,796 | 959,154 |
| Events in quadrant B | 3,440,114 | 962,683 |
| Events in quadrant C | 3,407,974 | 917,675 |
| Events in quadrant D | 5,070,332 | 893,085 |
| Mode M0 | |||
|---|---|---|---|
| Quadrant | BADHDUFLAG | Total packets | Discarded packets |
| A | 0 | 14788 | 3 |
| B | 0 | 14987 | 2 |
| C | 0 | 14963 | 2 |
| D | 0 | 20146 | 2 |
| Mode SS | |||
|---|---|---|---|
| Quadrant | BADHDUFLAG | Total packets | Discarded packets |
| A | 0 | 146 | 0 |
| B | 0 | 146 | 0 |
| C | 0 | 146 | 0 |
| D | 0 | 146 | 0 |
| Mode M9 | |||
|---|---|---|---|
| Quadrant | BADHDUFLAG | Total packets | Discarded packets |
| A | 0 | 20 | 0 |
| B | 0 | 20 | 0 |
| C | 0 | 20 | 0 |
| D | 0 | 20 | 0 |
| Quadrant | Total seconds | Saturated seconds | Saturation percentage |
|---|---|---|---|
| A | 7269 | 11 | 0.151328% |
| B | 7269 | 17 | 0.233870% |
| C | 7269 | 55 | 0.756638% |
| D | 7269 | 323 | 4.443527% |
Noise dominated data is calculated using 1-second bins in cleaned event files. If a bin has >2000 counts, and if more than 50% of those come from <1% of pixels, then it is considered to be noise-dominated and hence unusable.
| Quadrant | # 1 sec bins | Bins with >0 counts | Bins with >2000 counts | High rate bins dominated by noise | Noise dominated (total time) | Noise dominated (detector-on time) | Marked lightcurve |
|---|---|---|---|---|---|---|---|
| A | 9164 | 7271 | 0 | 0 | 0.00% | 0.00% | 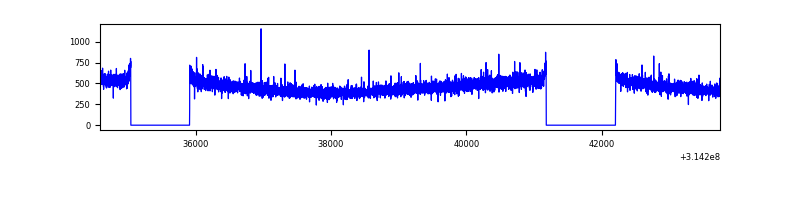 |
| B | 9164 | 7271 | 2 | 2 | 0.02% | 0.03% | 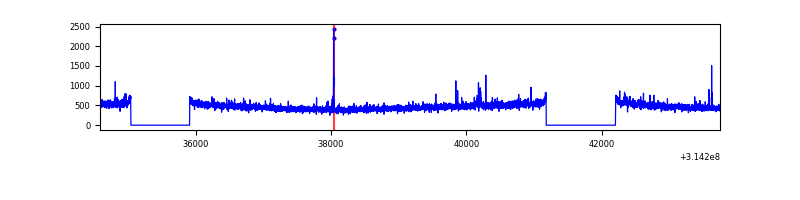 |
| C | 9164 | 7271 | 3 | 3 | 0.03% | 0.04% | 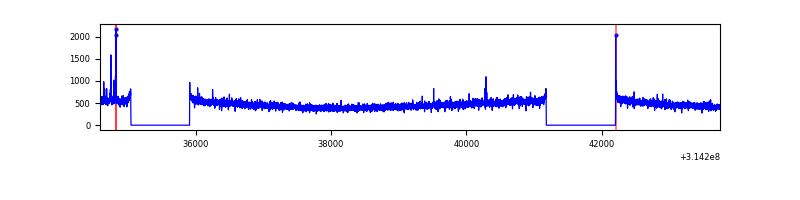 |
| D | 9164 | 7271 | 195 | 195 | 2.13% | 2.68% | 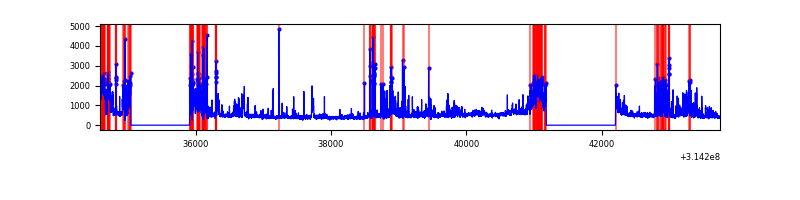 |
Top three noisy pixels from each quadrant. If the there are fewer than three noisy pixels in the level2.evt file, extra rows are filled as -1
| Pixel properties | Quadrant properties | ||||||
|---|---|---|---|---|---|---|---|
| Quadrant | DetID | PixID | Counts | Sigma | Mean | Median | Sigma |
| A | 13 | 254 | 12810 | 68.6 | 869 | 850 | 174.3 |
| A | 0 | 226 | 7358 | 37.33 | 869 | 850 | 174.3 |
| A | 3 | 137 | 7281 | 36.89 | 869 | 850 | 174.3 |
| B | 4 | 173 | 20941 | 123.13 | 865 | 845 | 163.2 |
| B | 12 | 111 | 19628 | 115.09 | 865 | 845 | 163.2 |
| B | 11 | 111 | 17063 | 99.37 | 865 | 845 | 163.2 |
| C | 14 | 238 | 133084 | 681.05 | 832 | 837 | 194.2 |
| C | 0 | 207 | 26345 | 131.36 | 832 | 837 | 194.2 |
| C | 3 | 233 | 7366 | 33.62 | 832 | 837 | 194.2 |
| D | 1 | 52 | 1720067 | 8533.32 | 830 | 804 | 201.5 |
| D | 2 | 152 | 114909 | 566.34 | 830 | 804 | 201.5 |
| D | 2 | 234 | 29921 | 144.52 | 830 | 804 | 201.5 |
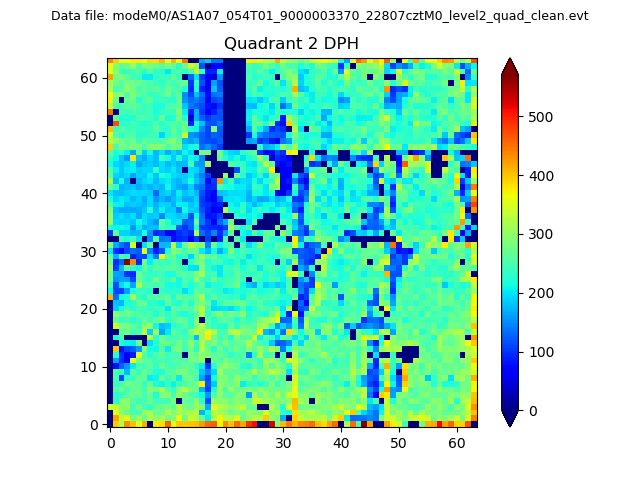
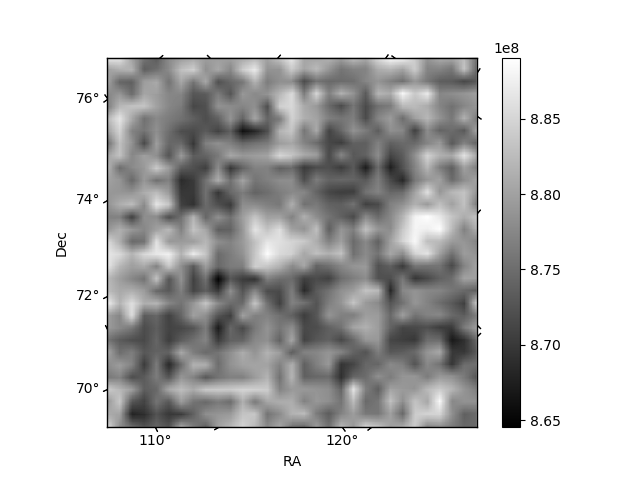
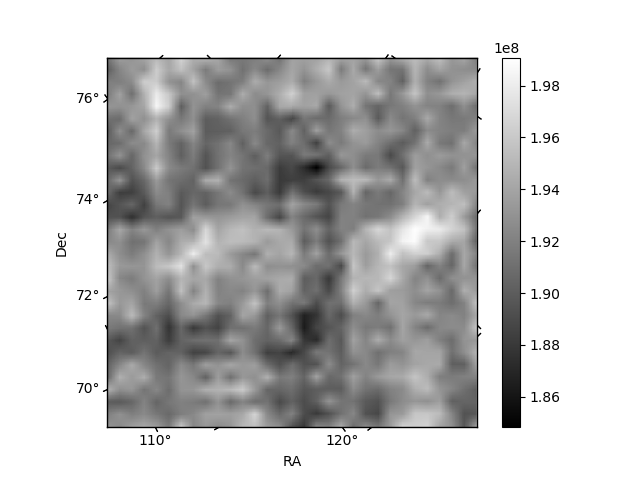
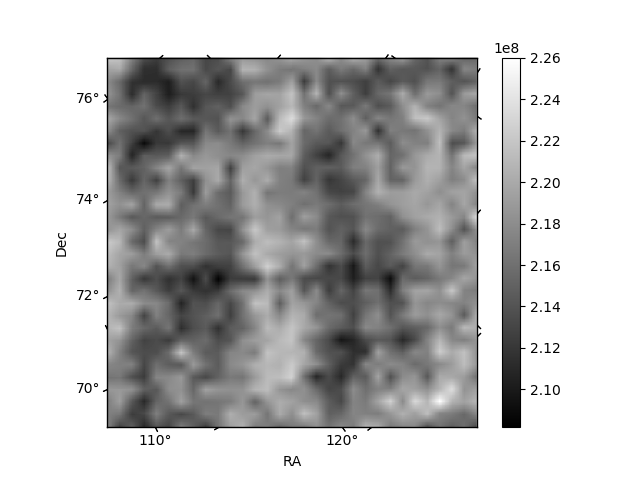
Histogram calculated using DETX and DETY for each event in the final _common_clean file
| Quadrant A | 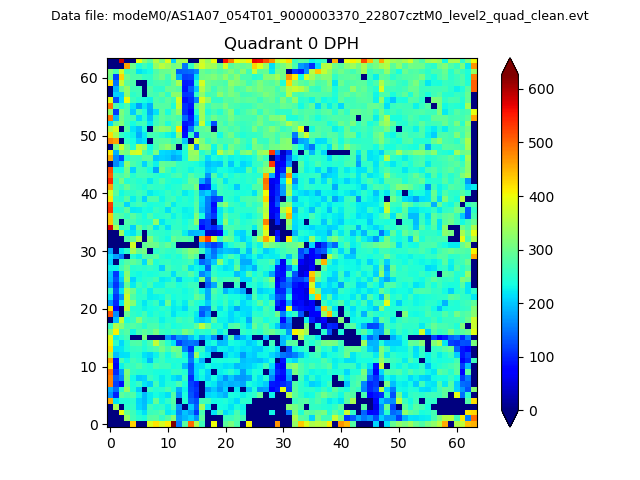 |
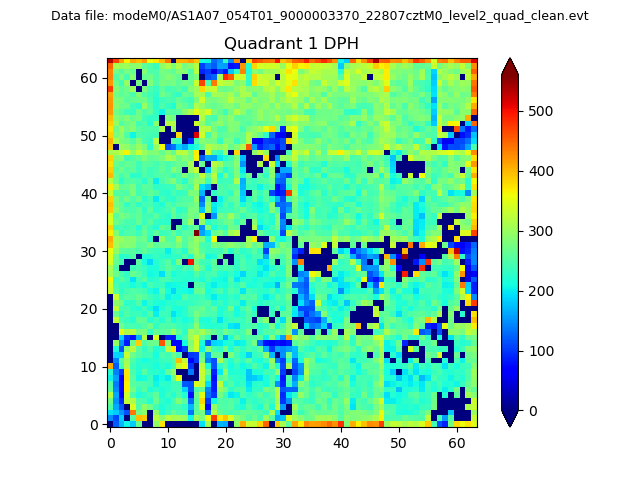 |
Quadrant B |
|---|---|---|---|
| Quadrant D | 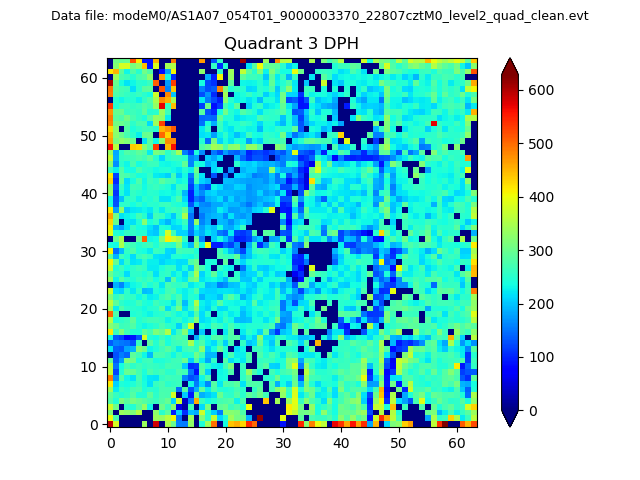 |
 |
Quadrant C |
| Plot type | Count rate plots | Images |
|---|---|---|
| Comparison with Poisson distribution Blue bars denote a histogram of data divided into 1 sec bins. Red curve is a Poisson curve with rate = median count rate of data. |
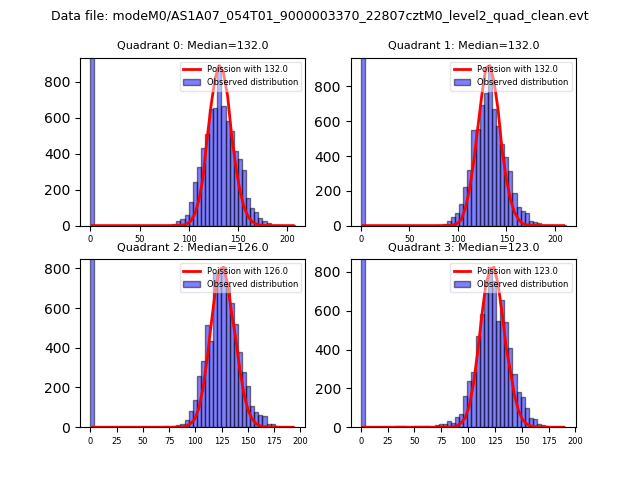 |
 |
| Quadrant-wise count rates Data is divided into 100 sec bins |
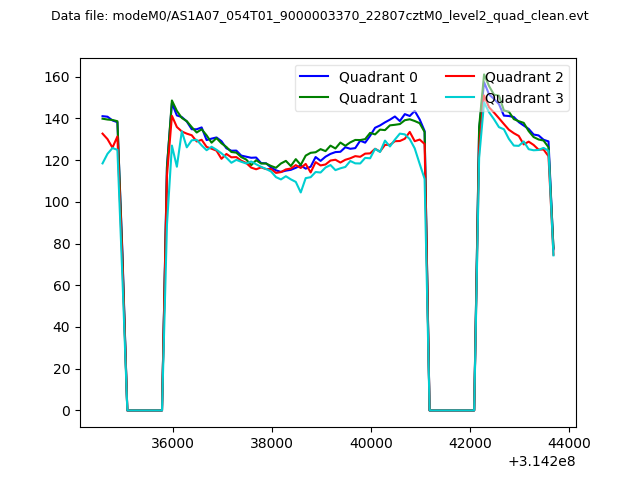 |
|
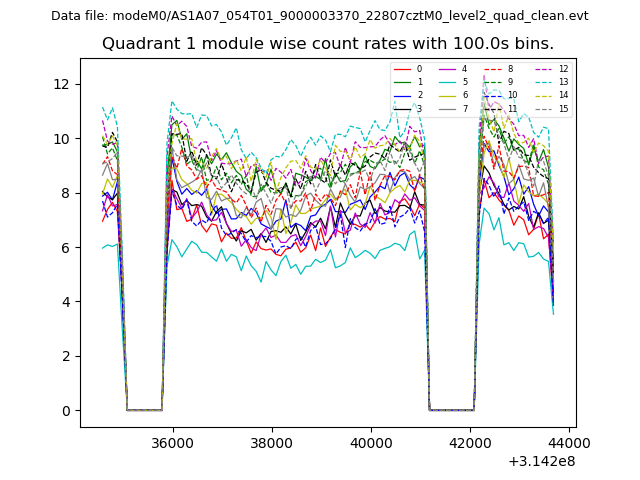
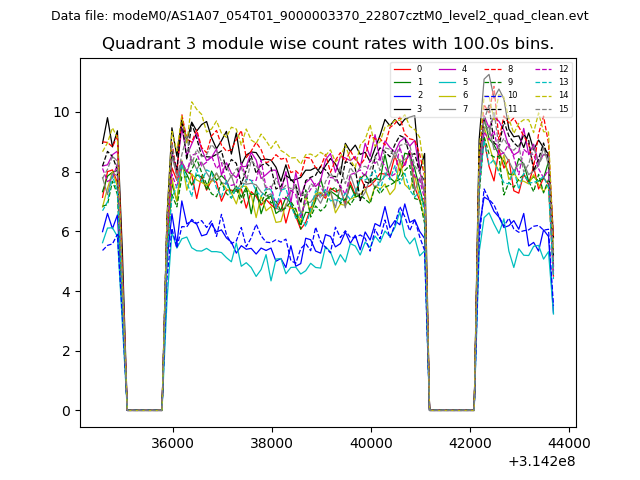
| Module-wise count rates for Quadrant A Data is divided into 100 sec bins |
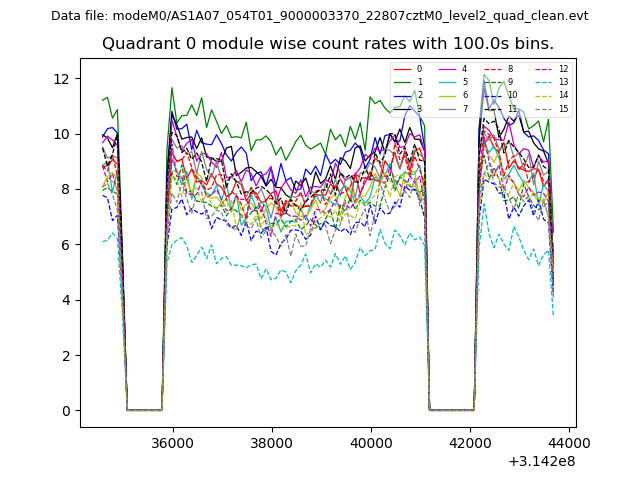 |
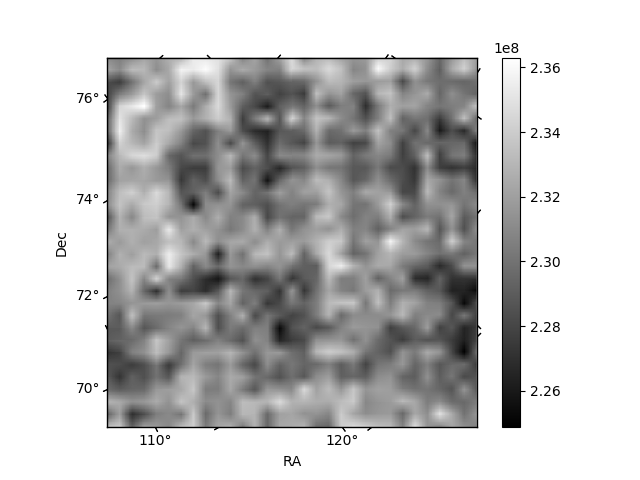 |
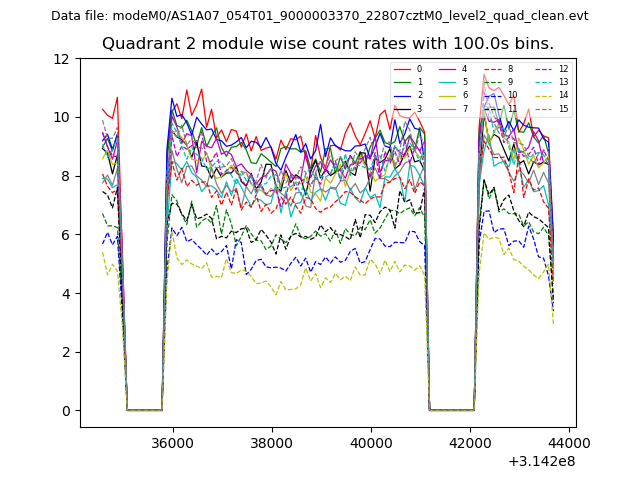
| Module-wise count rates for Quadrant B Data is divided into 100 sec bins |
 |
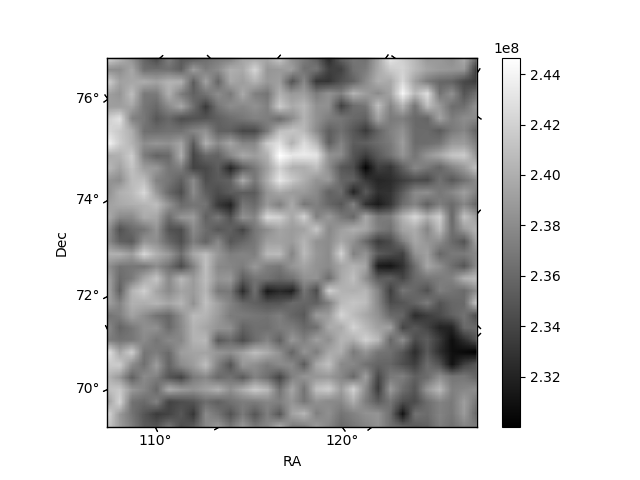 |
| Module-wise count rates for Quadrant C Data is divided into 100 sec bins |
 |
 |
| Module-wise count rates for Quadrant D Data is divided into 100 sec bins |
 |
 |
| Parameter | Plot |
|---|---|
| CZT HV Monitor | 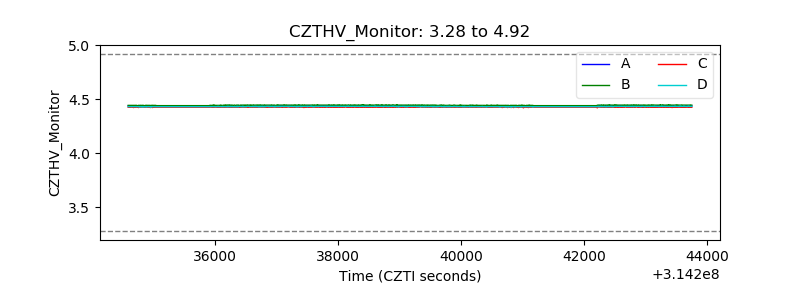 |
| D_VDD | 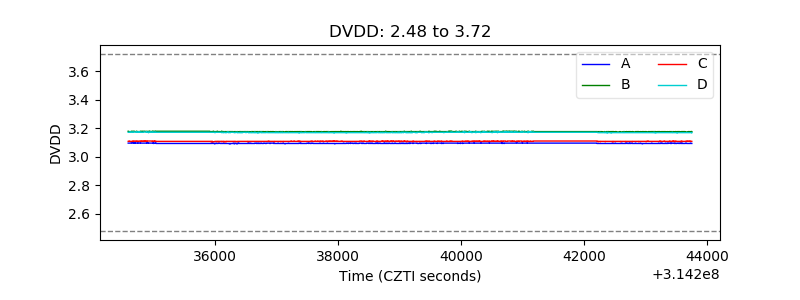 |
| Temperature 1 | 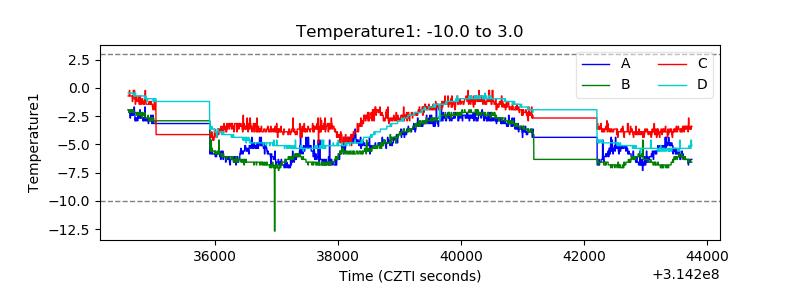 |
| Veto HV Monitor | 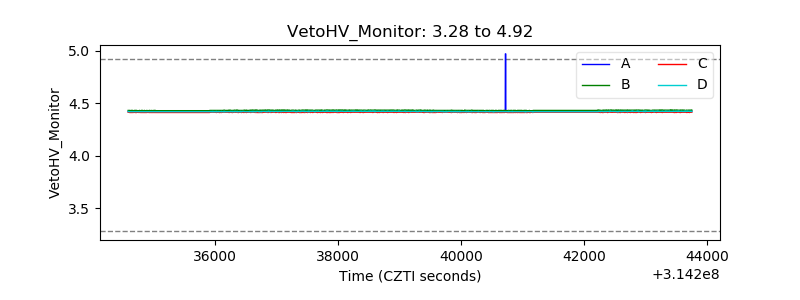 |
| Veto LLD | 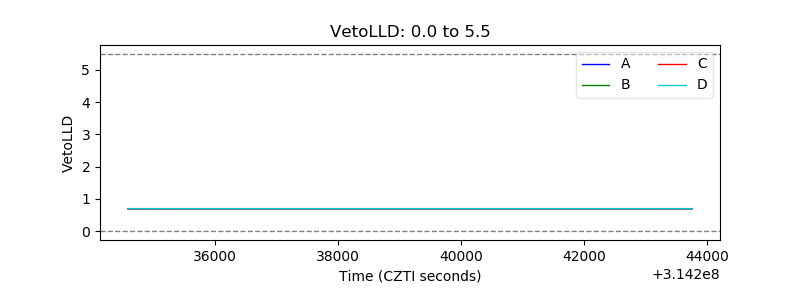 |
| Alpha Counter | 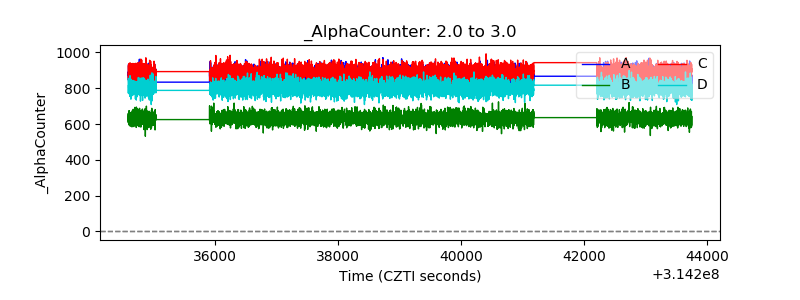 |
| _CPM_Rate | 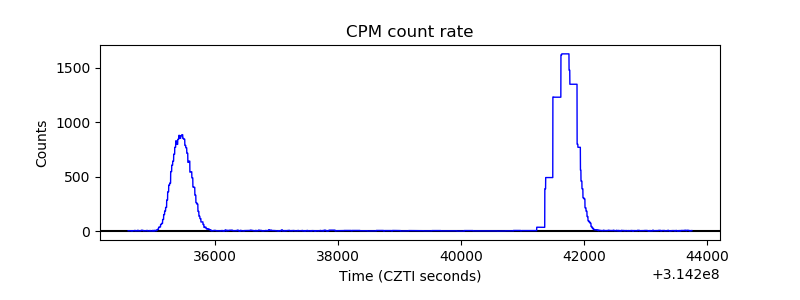 |
| CZT Counter | 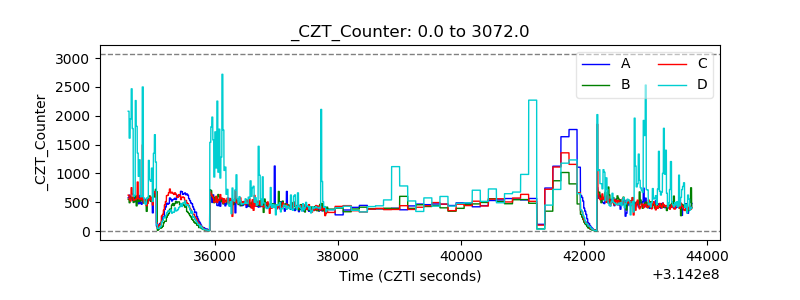 |
| +2.5 Volts monitor |  |
| +5 Volts monitor |  |
| _ROLL_ROT | 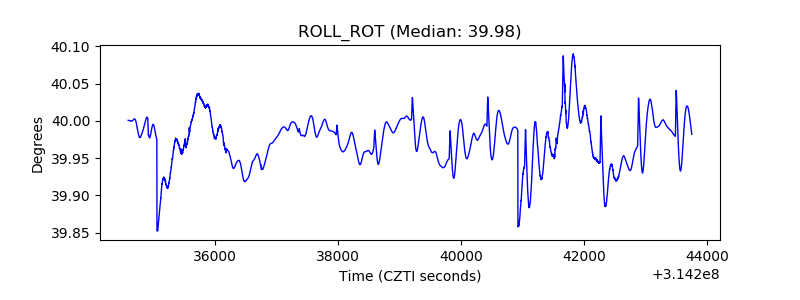 |
| _Roll_DEC | 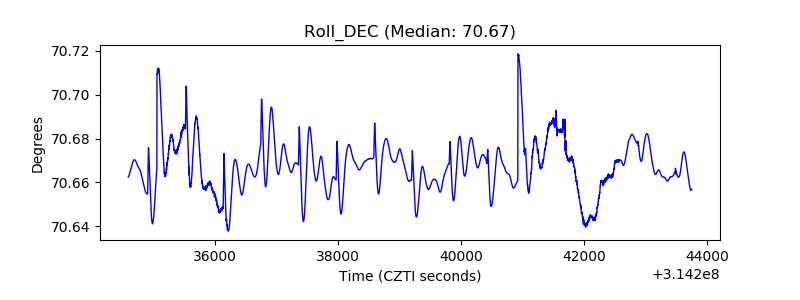 |
| _Roll_RA | 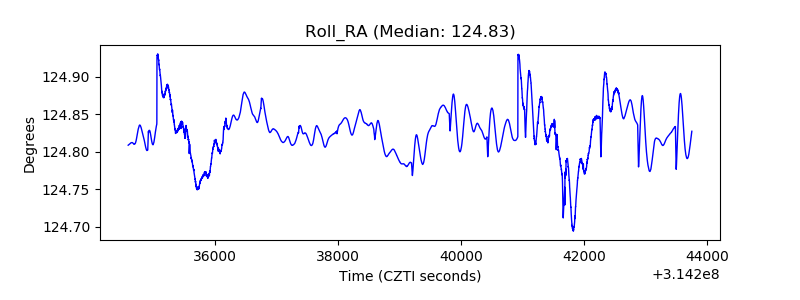 |
| Veto Counter | 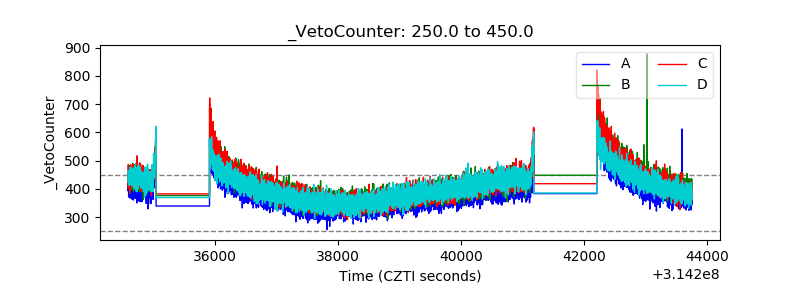 |