| Param | Original file | Final file |
|---|---|---|
| Filename | modeM0/AS1A07_054T01_9000003370_22809cztM0_level2.evt | modeM0/AS1A07_054T01_9000003370_22809cztM0_level2_quad_clean.evt |
| Size (bytes) | 511,174,080 | 131,935,680 |
| Size | 487.5 MB | 125.8 MB |
| Events in quadrant A | 3,105,375 | 914,528 |
| Events in quadrant B | 3,252,863 | 920,073 |
| Events in quadrant C | 3,112,999 | 868,065 |
| Events in quadrant D | 5,558,988 | 830,385 |
| Mode M0 | |||
|---|---|---|---|
| Quadrant | BADHDUFLAG | Total packets | Discarded packets |
| A | 0 | 13532 | 2 |
| B | 0 | 13917 | 2 |
| C | 0 | 13611 | 2 |
| D | 0 | 21192 | 2 |
| Mode SS | |||
|---|---|---|---|
| Quadrant | BADHDUFLAG | Total packets | Discarded packets |
| A | 0 | 134 | 0 |
| B | 0 | 134 | 0 |
| C | 0 | 134 | 0 |
| D | 0 | 134 | 0 |
| Mode M9 | |||
|---|---|---|---|
| Quadrant | BADHDUFLAG | Total packets | Discarded packets |
| A | 0 | 13 | 0 |
| B | 0 | 14 | 0 |
| C | 0 | 14 | 0 |
| D | 0 | 14 | 0 |
| Quadrant | Total seconds | Saturated seconds | Saturation percentage |
|---|---|---|---|
| A | 6644 | 16 | 0.240819% |
| B | 6644 | 32 | 0.481638% |
| C | 6644 | 49 | 0.737508% |
| D | 6643 | 484 | 7.285865% |
Noise dominated data is calculated using 1-second bins in cleaned event files. If a bin has >2000 counts, and if more than 50% of those come from <1% of pixels, then it is considered to be noise-dominated and hence unusable.
| Quadrant | # 1 sec bins | Bins with >0 counts | Bins with >2000 counts | High rate bins dominated by noise | Noise dominated (total time) | Noise dominated (detector-on time) | Marked lightcurve |
|---|---|---|---|---|---|---|---|
| A | 7774 | 6645 | 0 | 0 | 0.00% | 0.00% | 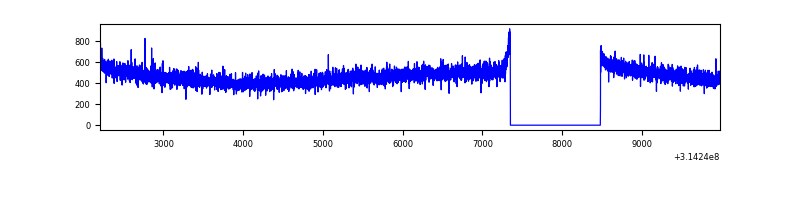 |
| B | 7774 | 6645 | 4 | 4 | 0.05% | 0.06% | 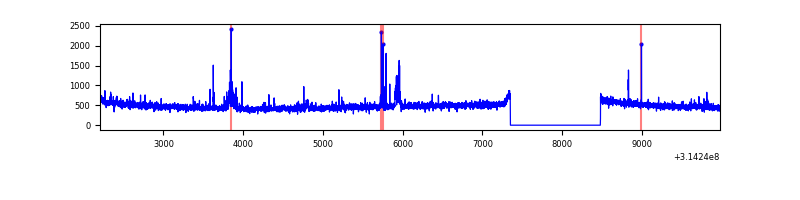 |
| C | 7774 | 6645 | 1 | 1 | 0.01% | 0.02% | 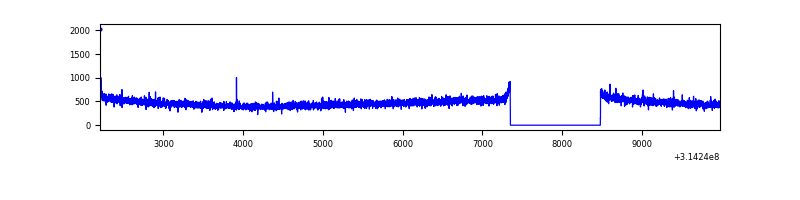 |
| D | 7773 | 6644 | 362 | 362 | 4.66% | 5.45% | 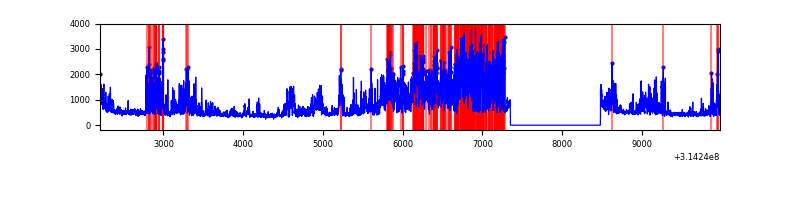 |
Top three noisy pixels from each quadrant. If the there are fewer than three noisy pixels in the level2.evt file, extra rows are filled as -1
| Pixel properties | Quadrant properties | ||||||
|---|---|---|---|---|---|---|---|
| Quadrant | DetID | PixID | Counts | Sigma | Mean | Median | Sigma |
| A | 13 | 254 | 12149 | 70.7 | 805 | 790 | 160.7 |
| A | 0 | 226 | 6941 | 38.28 | 805 | 790 | 160.7 |
| A | 3 | 137 | 6441 | 35.17 | 805 | 790 | 160.7 |
| B | 0 | 229 | 49214 | 319.29 | 801 | 782 | 151.7 |
| B | 3 | 64 | 22877 | 145.66 | 801 | 782 | 151.7 |
| B | 4 | 173 | 19295 | 122.05 | 801 | 782 | 151.7 |
| C | 14 | 238 | 122420 | 690.21 | 763 | 767 | 176.3 |
| C | 3 | 233 | 6176 | 30.69 | 763 | 767 | 176.3 |
| C | 13 | 61 | 5332 | 25.9 | 763 | 767 | 176.3 |
| D | 1 | 52 | 2531798 | 13966.95 | 754 | 731 | 181.2 |
| D | 2 | 152 | 94469 | 517.27 | 754 | 731 | 181.2 |
| D | 9 | 85 | 39668 | 214.86 | 754 | 731 | 181.2 |
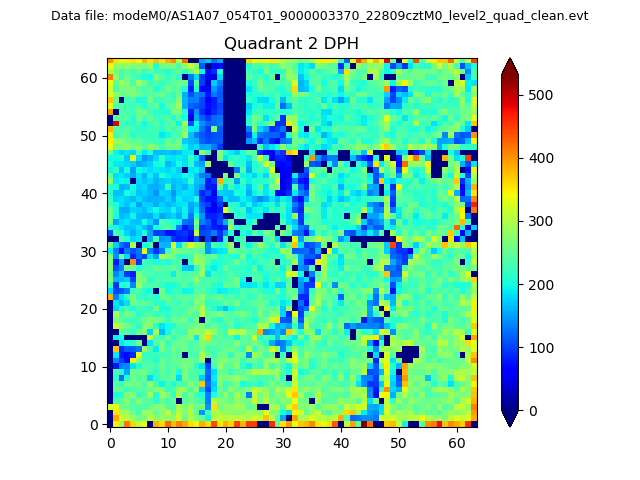
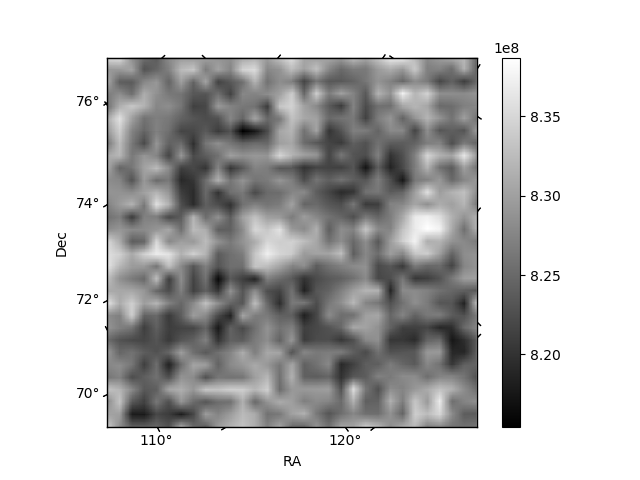
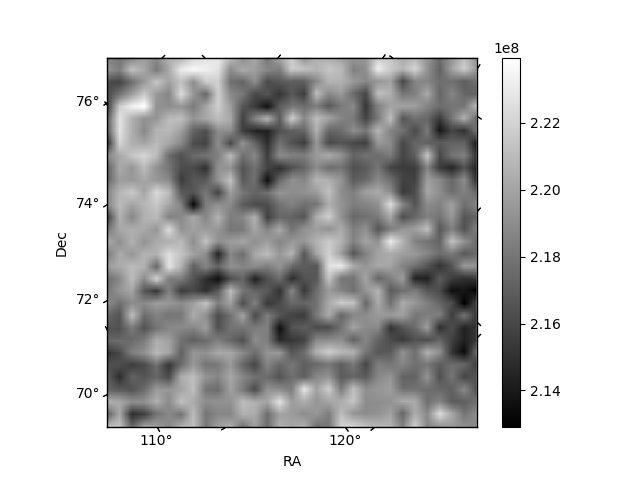
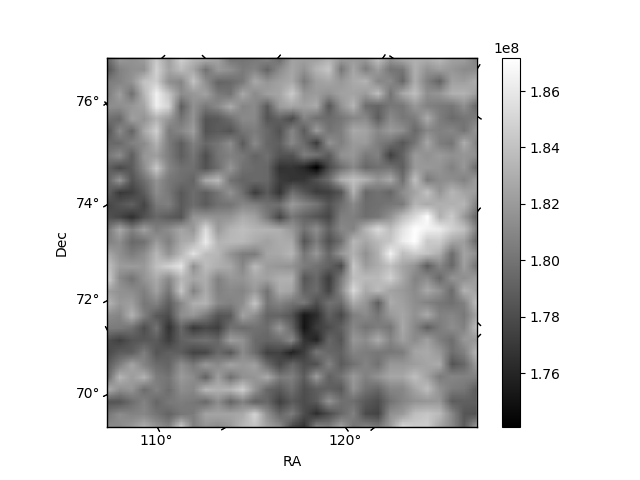
Histogram calculated using DETX and DETY for each event in the final _common_clean file
| Quadrant A | 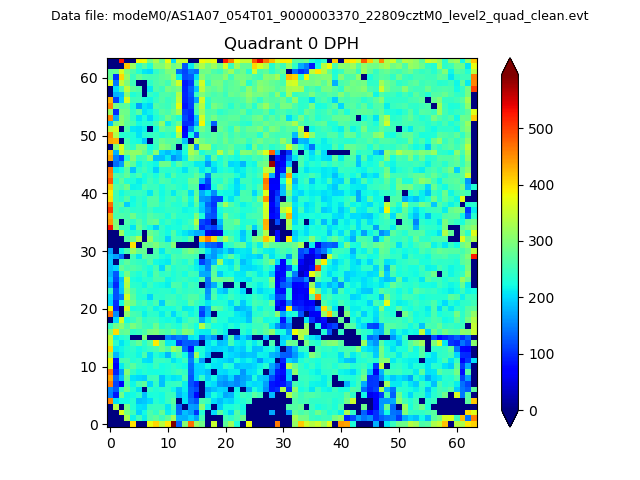 |
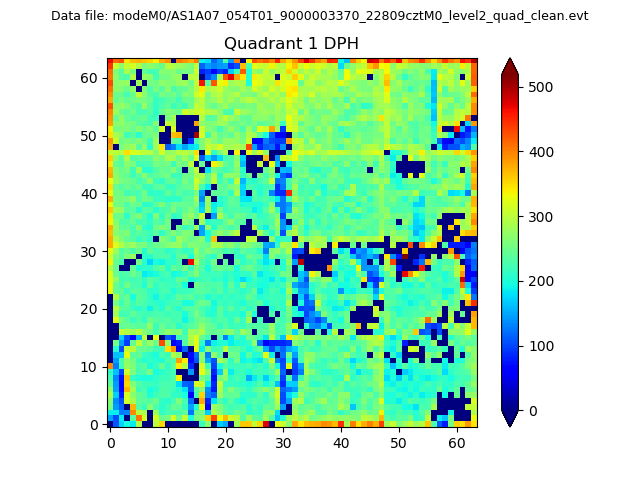 |
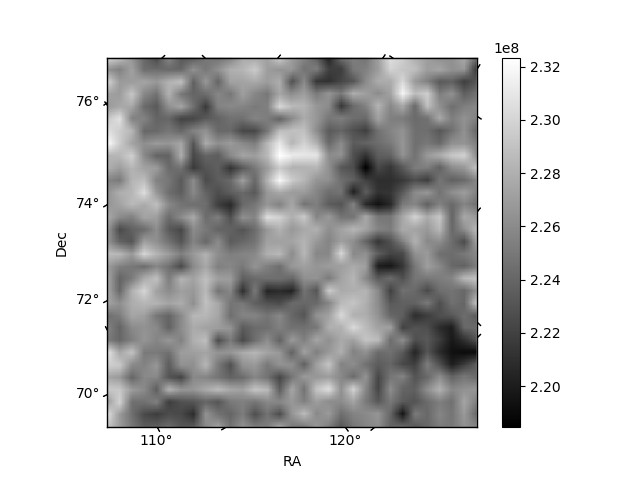
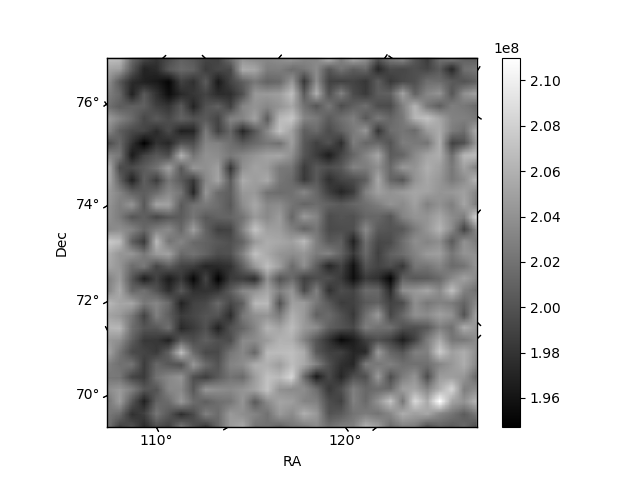
Quadrant B |
|---|---|---|---|
| Quadrant D | 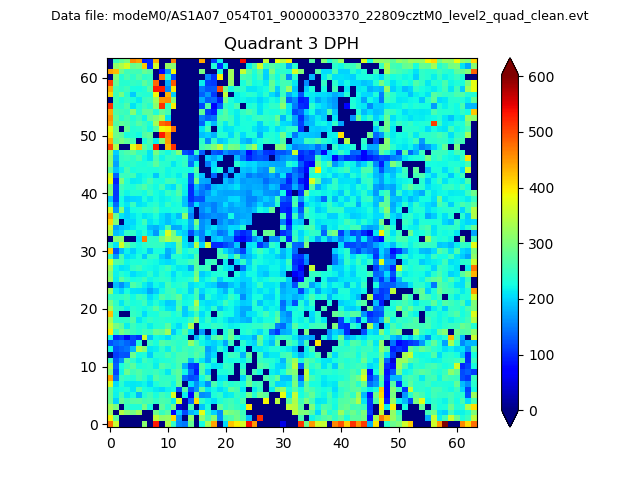 |
 |
Quadrant C |
| Plot type | Count rate plots | Images |
|---|---|---|
| Comparison with Poisson distribution Blue bars denote a histogram of data divided into 1 sec bins. Red curve is a Poisson curve with rate = median count rate of data. |
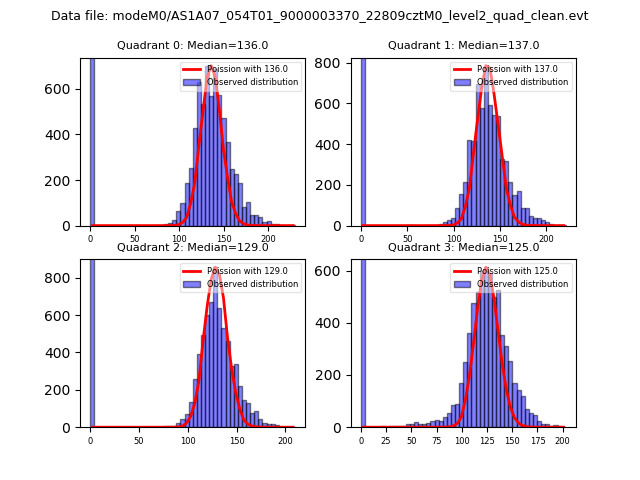 |
 |
| Quadrant-wise count rates Data is divided into 100 sec bins |
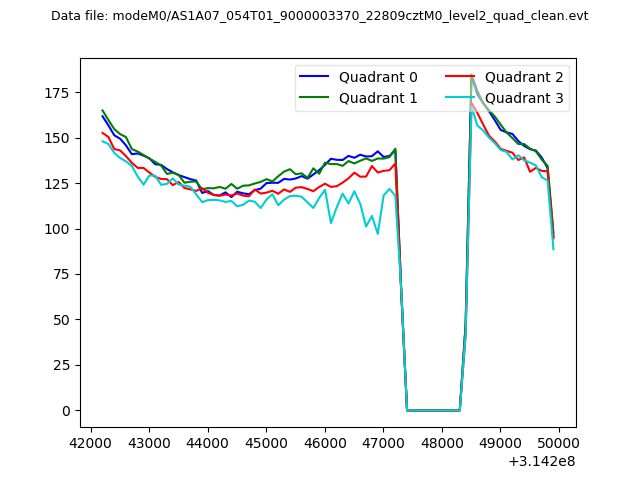 |
|
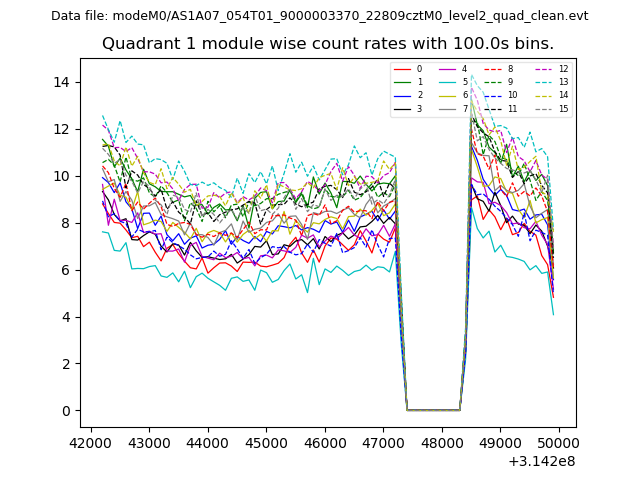
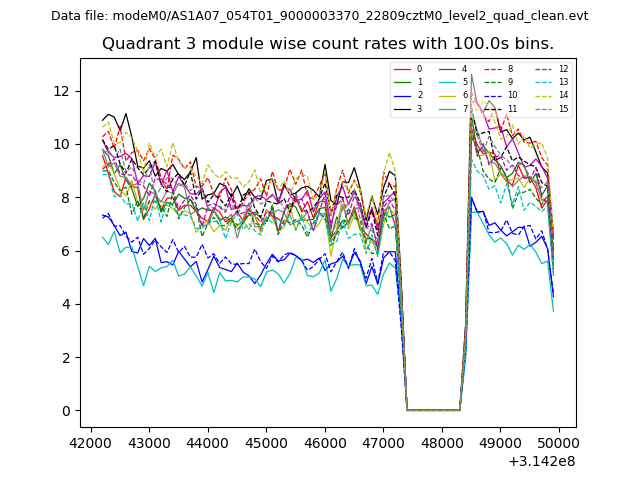
| Module-wise count rates for Quadrant A Data is divided into 100 sec bins |
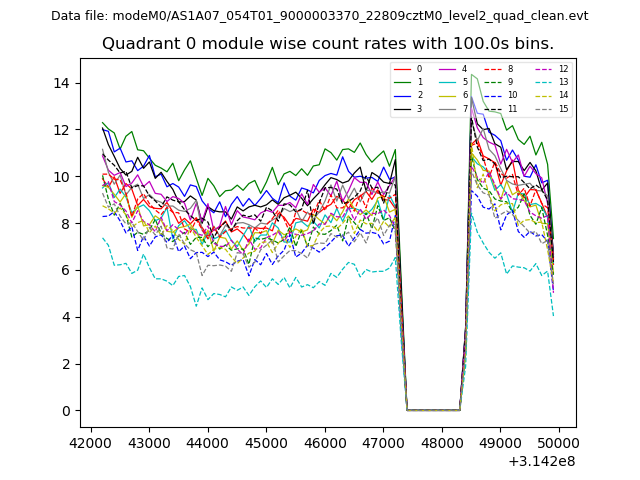 |
 |
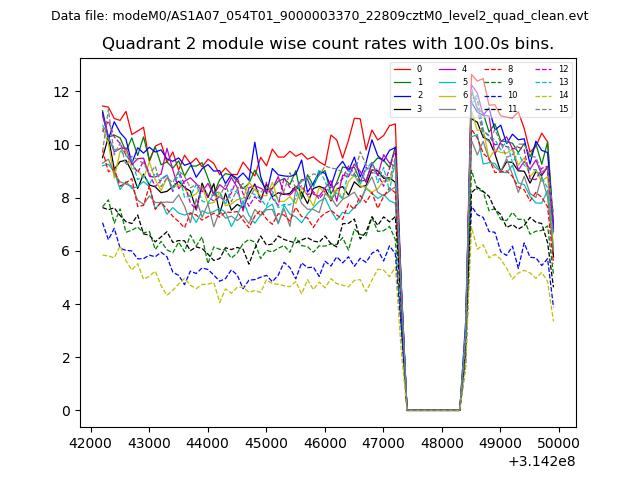
| Module-wise count rates for Quadrant B Data is divided into 100 sec bins |
 |
 |
| Module-wise count rates for Quadrant C Data is divided into 100 sec bins |
 |
 |
| Module-wise count rates for Quadrant D Data is divided into 100 sec bins |
 |
 |
| Parameter | Plot |
|---|---|
| CZT HV Monitor | 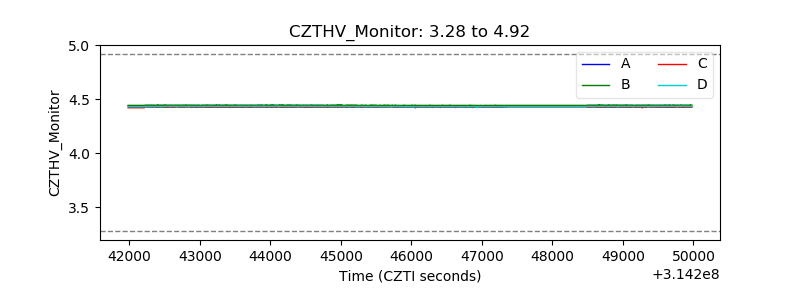 |
| D_VDD |  |
| Temperature 1 | 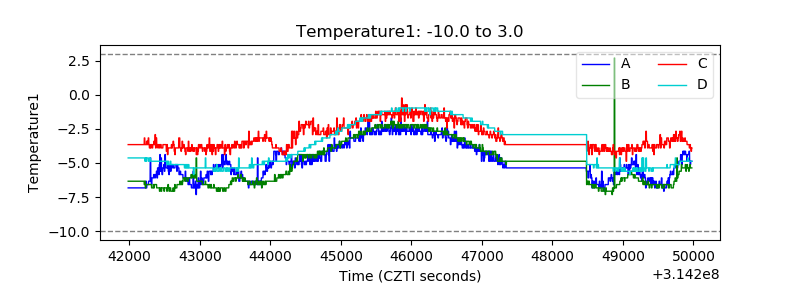 |
| Veto HV Monitor | 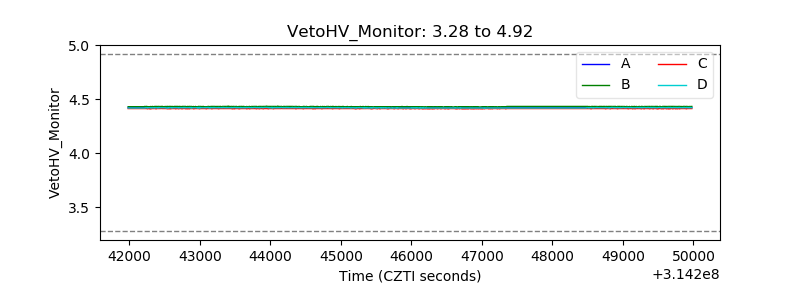 |
| Veto LLD | 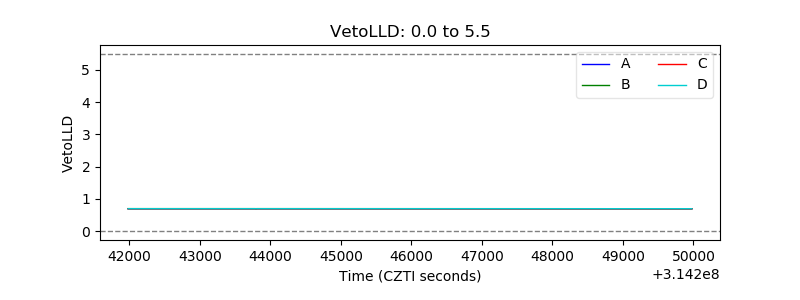 |
| Alpha Counter | 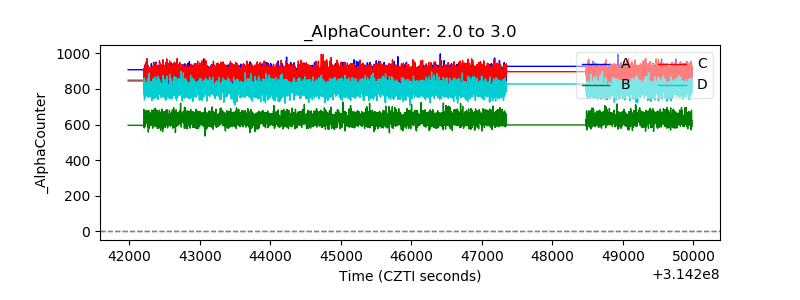 |
| _CPM_Rate | 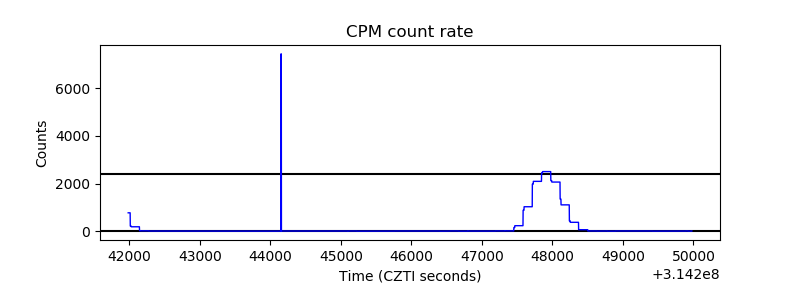 |
| CZT Counter | 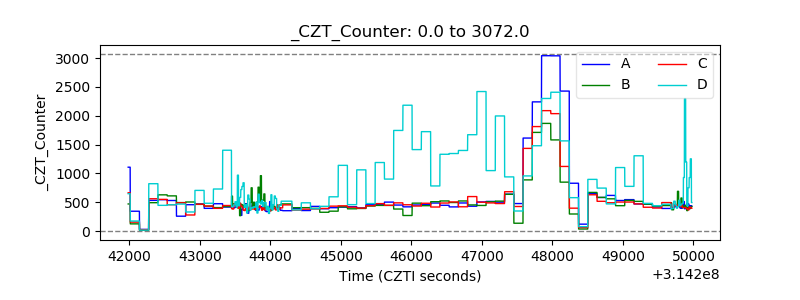 |
| +2.5 Volts monitor |  |
| +5 Volts monitor |  |
| _ROLL_ROT | 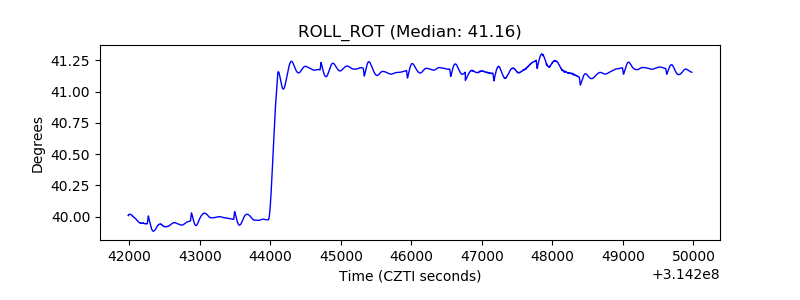 |
| _Roll_DEC | 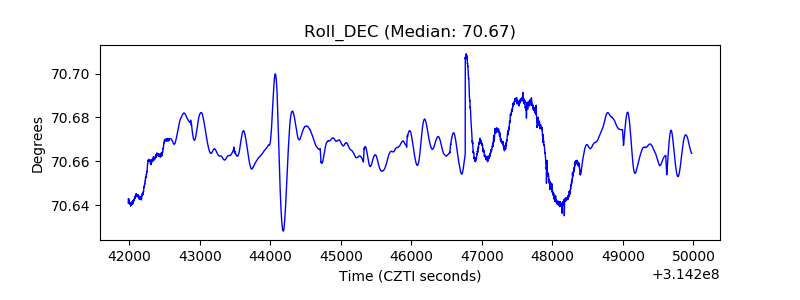 |
| _Roll_RA | 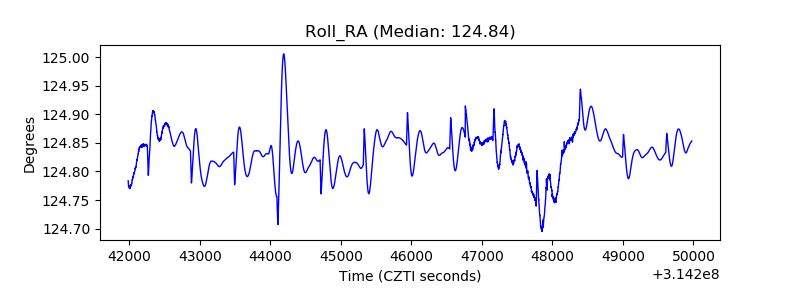 |
| Veto Counter | 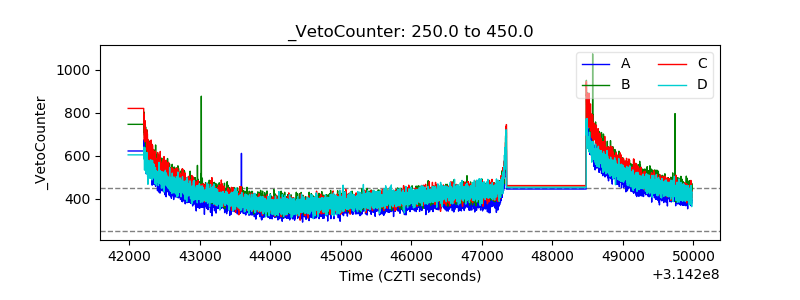 |