| Param | Original file | Final file |
|---|---|---|
| Filename | modeM0/AS1A07_054T01_9000003370_22812cztM0_level2.evt | modeM0/AS1A07_054T01_9000003370_22812cztM0_level2_quad_clean.evt |
| Size (bytes) | 391,608,000 | 121,907,520 |
| Size | 373.5 MB | 116.3 MB |
| Events in quadrant A | 2,832,653 | 857,165 |
| Events in quadrant B | 2,896,156 | 853,386 |
| Events in quadrant C | 2,762,883 | 794,685 |
| Events in quadrant D | 2,989,871 | 798,293 |
| Mode M0 | |||
|---|---|---|---|
| Quadrant | BADHDUFLAG | Total packets | Discarded packets |
| A | 0 | 11591 | 1 |
| B | 0 | 11783 | 1 |
| C | 0 | 11447 | 1 |
| D | 0 | 12374 | 1 |
| Mode SS | |||
|---|---|---|---|
| Quadrant | BADHDUFLAG | Total packets | Discarded packets |
| A | 0 | 114 | 0 |
| B | 0 | 114 | 0 |
| C | 0 | 114 | 0 |
| D | 0 | 114 | 0 |
| Mode M9 | |||
|---|---|---|---|
| Quadrant | BADHDUFLAG | Total packets | Discarded packets |
| A | 0 | 13 | 0 |
| B | 0 | 13 | 0 |
| C | 0 | 13 | 0 |
| D | 0 | 13 | 0 |
| Quadrant | Total seconds | Saturated seconds | Saturation percentage |
|---|---|---|---|
| A | 5556 | 54 | 0.971922% |
| B | 5557 | 69 | 1.241677% |
| C | 5557 | 79 | 1.421630% |
| D | 5557 | 66 | 1.187691% |
Noise dominated data is calculated using 1-second bins in cleaned event files. If a bin has >2000 counts, and if more than 50% of those come from <1% of pixels, then it is considered to be noise-dominated and hence unusable.
| Quadrant | # 1 sec bins | Bins with >0 counts | Bins with >2000 counts | High rate bins dominated by noise | Noise dominated (total time) | Noise dominated (detector-on time) | Marked lightcurve |
|---|---|---|---|---|---|---|---|
| A | 6906 | 5557 | 0 | 0 | 0.00% | 0.00% |  |
| B | 6907 | 5558 | 1 | 1 | 0.01% | 0.02% |  |
| C | 6907 | 5558 | 2 | 2 | 0.03% | 0.04% |  |
| D | 6907 | 5558 | 26 | 26 | 0.38% | 0.47% |  |
Top three noisy pixels from each quadrant. If the there are fewer than three noisy pixels in the level2.evt file, extra rows are filled as -1
| Pixel properties | Quadrant properties | ||||||
|---|---|---|---|---|---|---|---|
| Quadrant | DetID | PixID | Counts | Sigma | Mean | Median | Sigma |
| A | 13 | 252 | 10502 | 67.62 | 732 | 719 | 144.7 |
| A | 13 | 254 | 9818 | 62.89 | 732 | 719 | 144.7 |
| A | 0 | 226 | 6455 | 39.64 | 732 | 719 | 144.7 |
| B | 0 | 190 | 82186 | 612.54 | 713 | 697 | 133.0 |
| B | 12 | 111 | 14914 | 106.87 | 713 | 697 | 133.0 |
| B | 11 | 111 | 13183 | 93.86 | 713 | 697 | 133.0 |
| C | 14 | 238 | 111343 | 717.85 | 675 | 681 | 154.2 |
| C | 10 | 22 | 14220 | 87.82 | 675 | 681 | 154.2 |
| C | 13 | 61 | 4709 | 26.13 | 675 | 681 | 154.2 |
| D | 1 | 239 | 78197 | 466.13 | 700 | 680 | 166.3 |
| D | 6 | 112 | 75986 | 452.83 | 700 | 680 | 166.3 |
| D | 1 | 52 | 71375 | 425.1 | 700 | 680 | 166.3 |
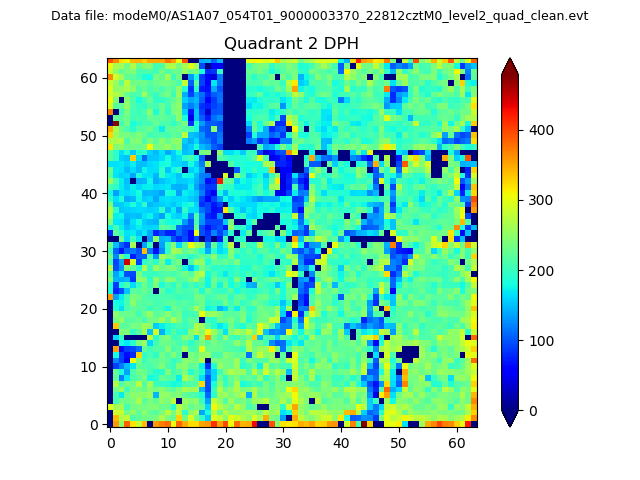
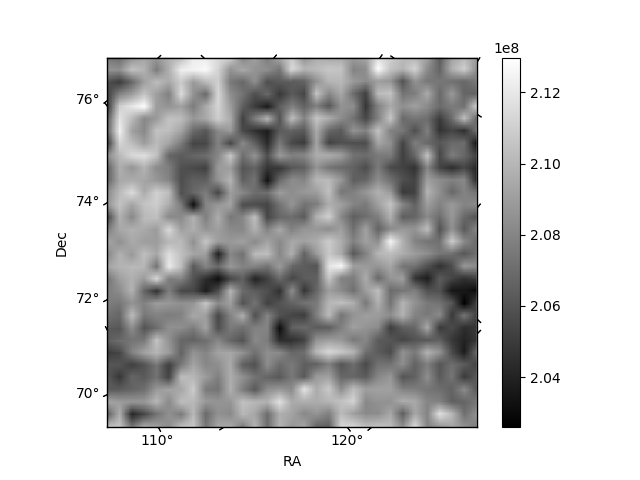
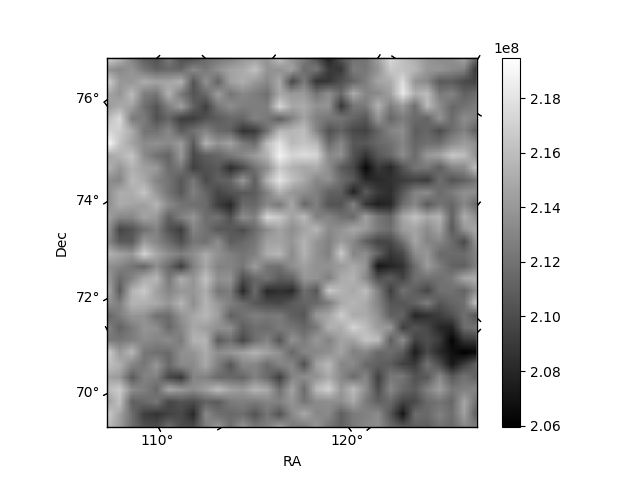
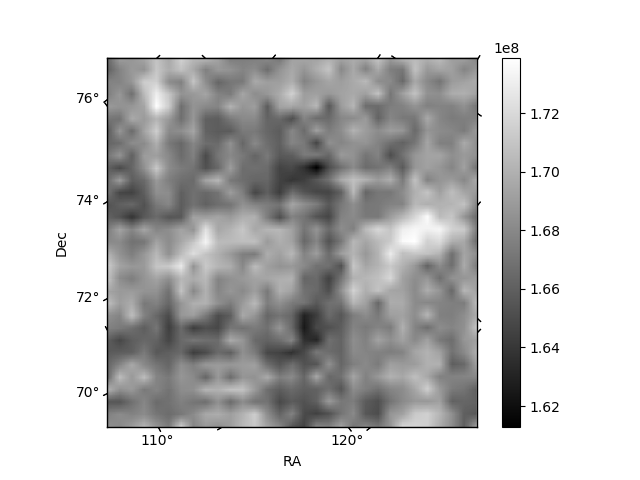
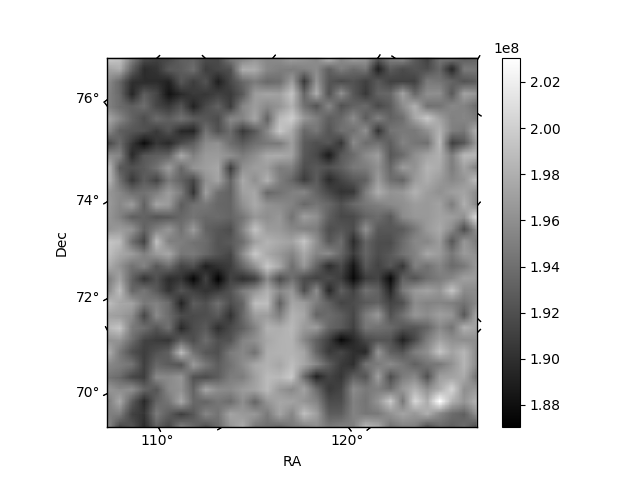
Histogram calculated using DETX and DETY for each event in the final _common_clean file
| Quadrant A |  |
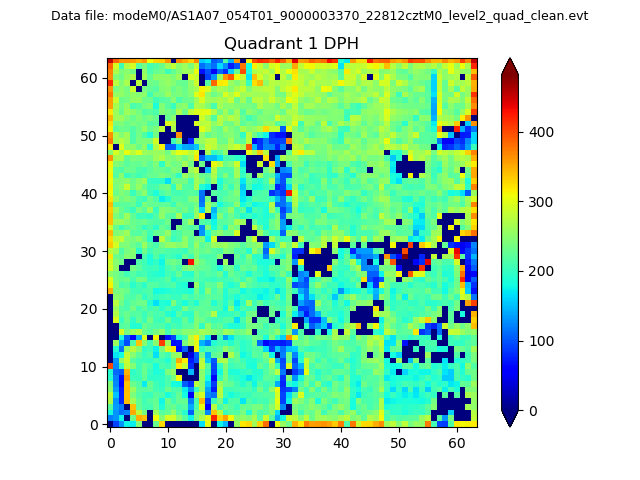 |
Quadrant B |
|---|---|---|---|
| Quadrant D |  |
 |
Quadrant C |
| Plot type | Count rate plots | Images |
|---|---|---|
| Comparison with Poisson distribution Blue bars denote a histogram of data divided into 1 sec bins. Red curve is a Poisson curve with rate = median count rate of data. |
 |
 |
| Quadrant-wise count rates Data is divided into 100 sec bins |
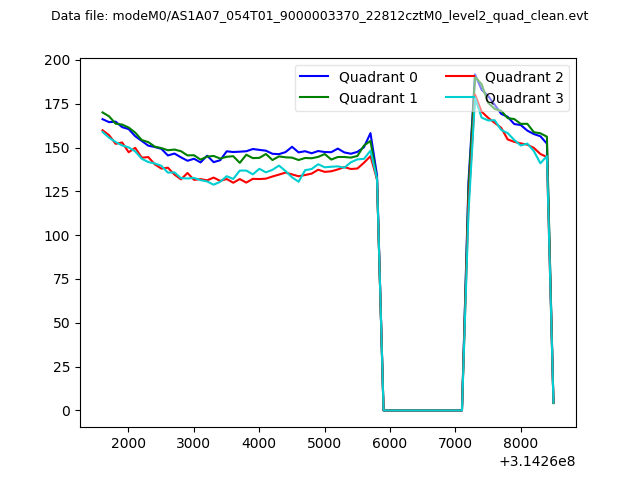 |
|
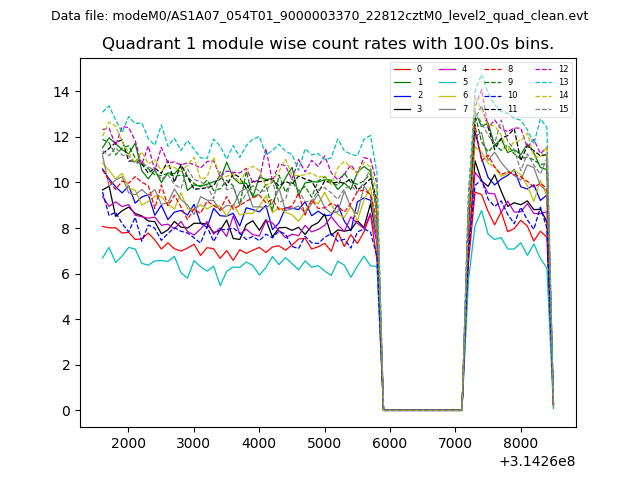
| Module-wise count rates for Quadrant A Data is divided into 100 sec bins |
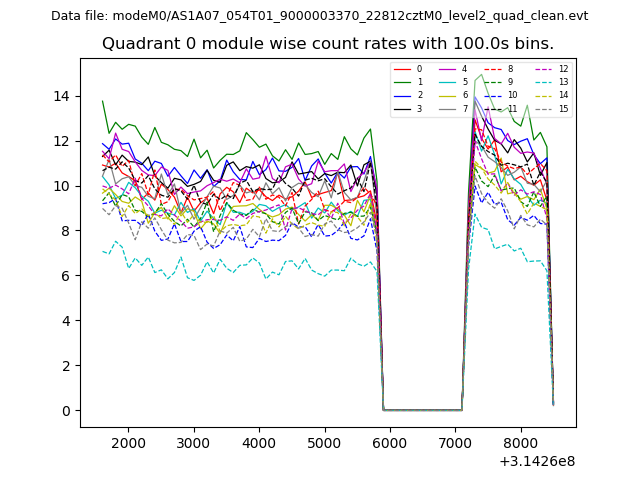 |
 |
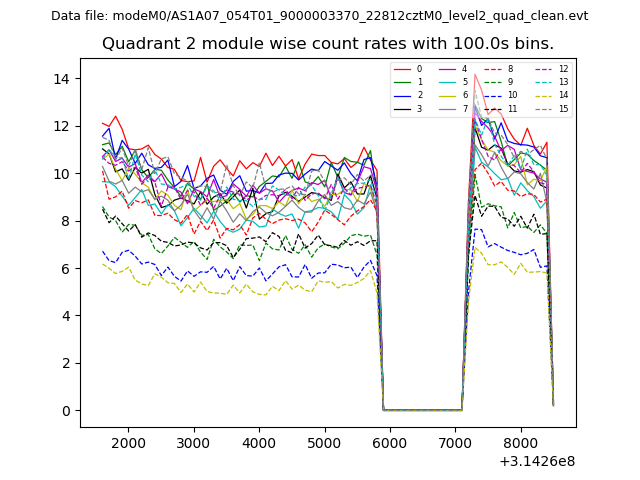
| Module-wise count rates for Quadrant B Data is divided into 100 sec bins |
 |
 |
| Module-wise count rates for Quadrant C Data is divided into 100 sec bins |
 |
 |
| Module-wise count rates for Quadrant D Data is divided into 100 sec bins |
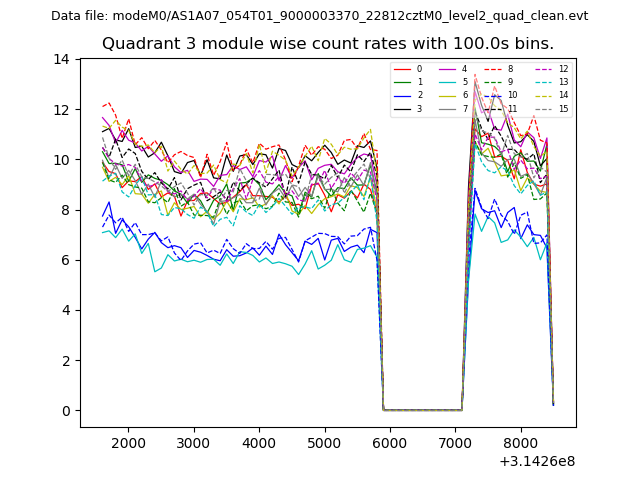 |
 |
| Parameter | Plot |
|---|---|
| CZT HV Monitor | 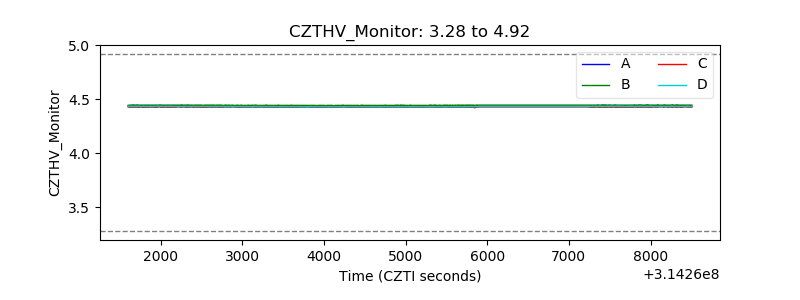 |
| D_VDD | 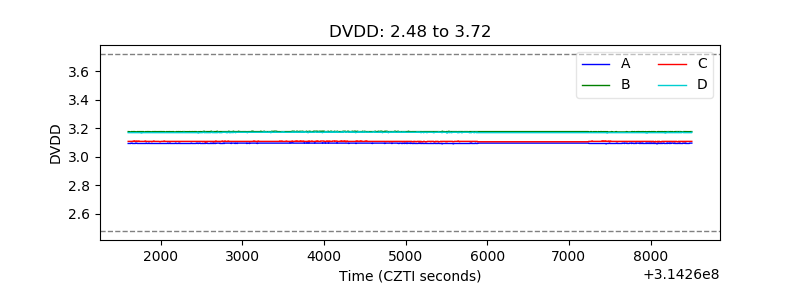 |
| Temperature 1 |  |
| Veto HV Monitor | 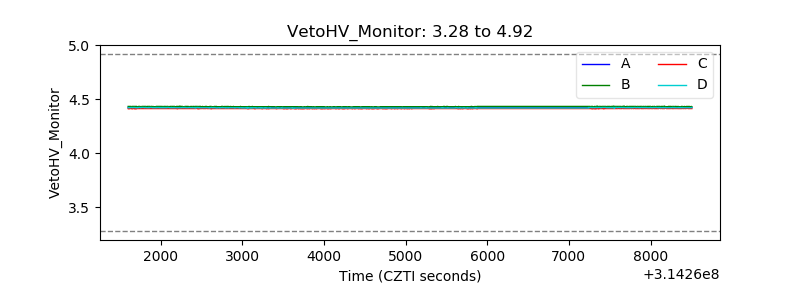 |
| Veto LLD | 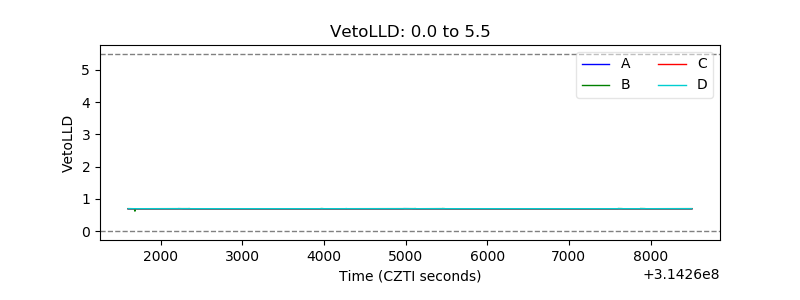 |
| Alpha Counter | 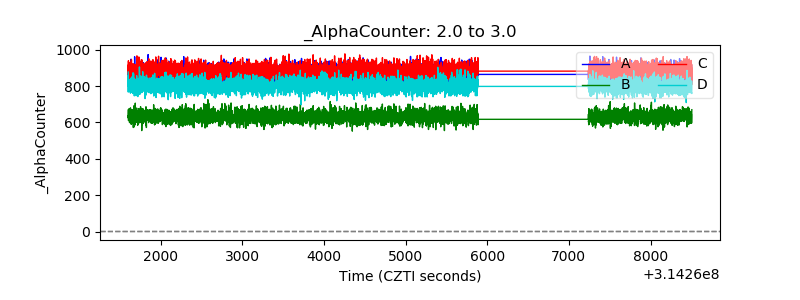 |
| _CPM_Rate | 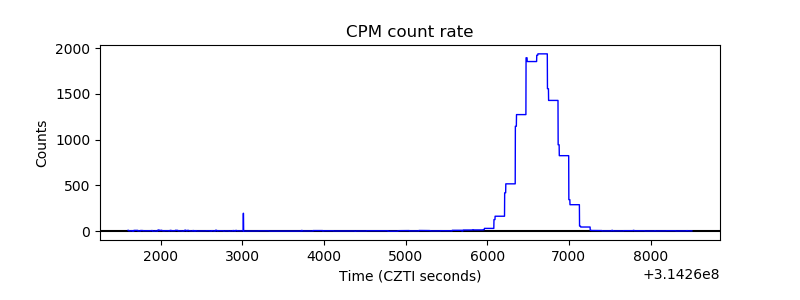 |
| CZT Counter | 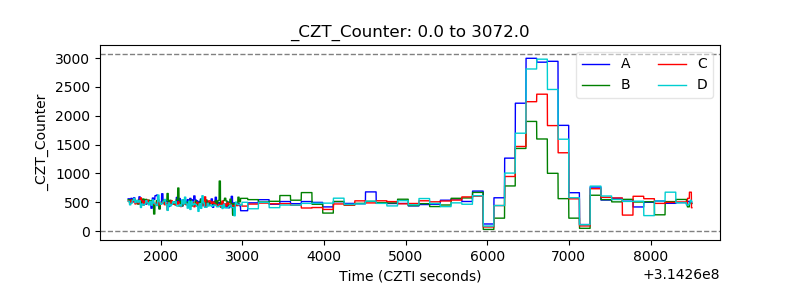 |
| +2.5 Volts monitor |  |
| +5 Volts monitor |  |
| _ROLL_ROT | 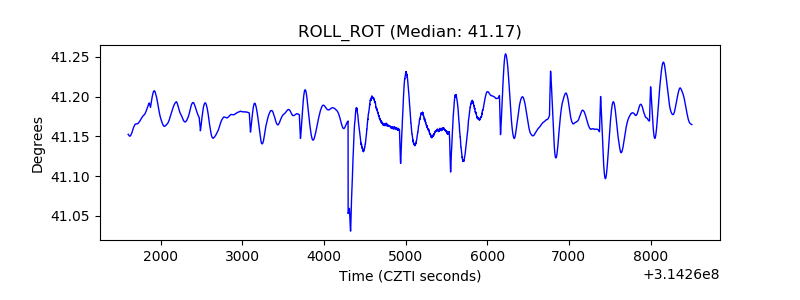 |
| _Roll_DEC | 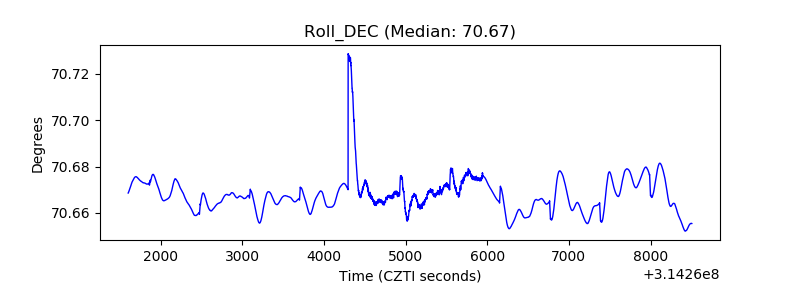 |
| _Roll_RA | 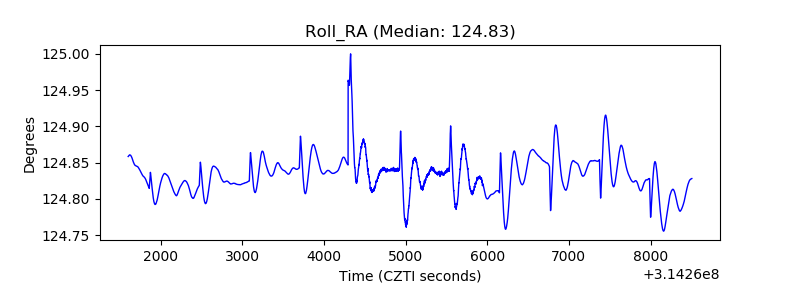 |
| Veto Counter | 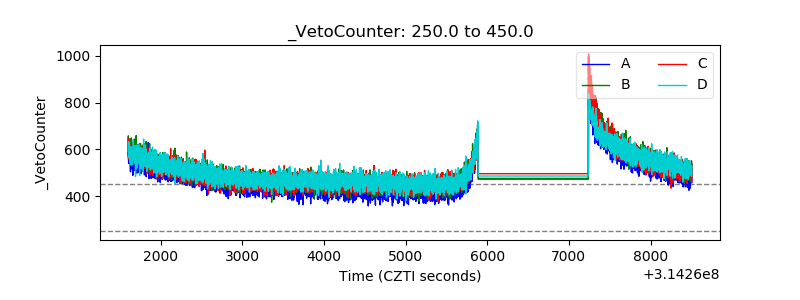 |