| Param | Original file | Final file |
|---|---|---|
| Filename | modeM0/AS1A07_054T01_9000003370_22813cztM0_level2.evt | modeM0/AS1A07_054T01_9000003370_22813cztM0_level2_quad_clean.evt |
| Size (bytes) | 2,278,563,840 | 647,648,640 |
| Size | 2.1 GB | 617.6 MB |
| Events in quadrant A | 15,307,390 | 4,530,966 |
| Events in quadrant B | 15,648,437 | 4,510,926 |
| Events in quadrant C | 15,097,091 | 4,236,399 |
| Events in quadrant D | 20,826,862 | 4,175,344 |
| Mode M0 | |||
|---|---|---|---|
| Quadrant | BADHDUFLAG | Total packets | Discarded packets |
| A | 0 | 65011 | 6 |
| B | 0 | 66088 | 6 |
| C | 0 | 64675 | 6 |
| D | 0 | 82633 | 6 |
| Mode SS | |||
|---|---|---|---|
| Quadrant | BADHDUFLAG | Total packets | Discarded packets |
| A | 0 | 646 | 0 |
| B | 0 | 646 | 0 |
| C | 0 | 646 | 0 |
| D | 0 | 646 | 0 |
| Mode M9 | |||
|---|---|---|---|
| Quadrant | BADHDUFLAG | Total packets | Discarded packets |
| A | 0 | 71 | 0 |
| B | 0 | 71 | 0 |
| C | 0 | 71 | 0 |
| D | 0 | 71 | 0 |
| Quadrant | Total seconds | Saturated seconds | Saturation percentage |
|---|---|---|---|
| A | 31499 | 230 | 0.730182% |
| B | 31499 | 314 | 0.996857% |
| C | 31500 | 388 | 1.231746% |
| D | 31500 | 1134 | 3.600000% |
Noise dominated data is calculated using 1-second bins in cleaned event files. If a bin has >2000 counts, and if more than 50% of those come from <1% of pixels, then it is considered to be noise-dominated and hence unusable.
| Quadrant | # 1 sec bins | Bins with >0 counts | Bins with >2000 counts | High rate bins dominated by noise | Noise dominated (total time) | Noise dominated (detector-on time) | Marked lightcurve |
|---|---|---|---|---|---|---|---|
| A | 38809 | 31505 | 0 | 0 | 0.00% | 0.00% | 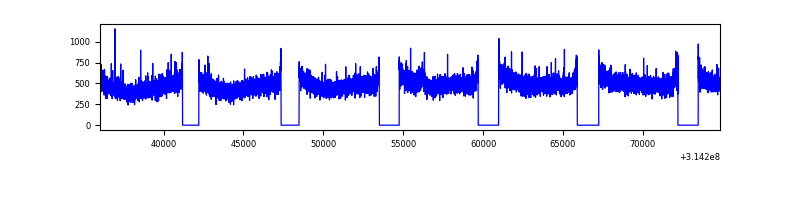 |
| B | 38809 | 31505 | 8 | 8 | 0.02% | 0.03% | 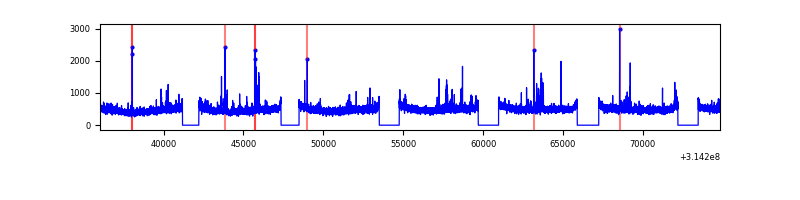 |
| C | 38810 | 31506 | 3 | 3 | 0.01% | 0.01% | 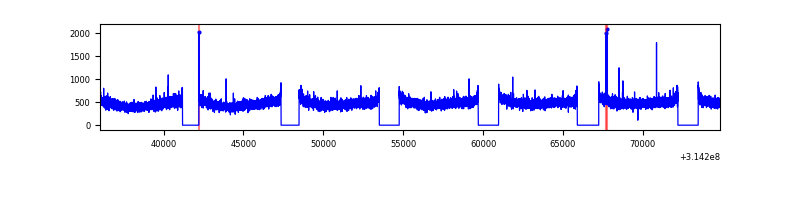 |
| D | 38810 | 31506 | 768 | 768 | 1.98% | 2.44% | 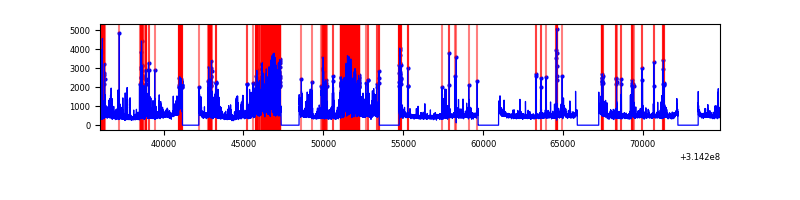 |
Top three noisy pixels from each quadrant. If the there are fewer than three noisy pixels in the level2.evt file, extra rows are filled as -1
| Pixel properties | Quadrant properties | ||||||
|---|---|---|---|---|---|---|---|
| Quadrant | DetID | PixID | Counts | Sigma | Mean | Median | Sigma |
| A | 13 | 252 | 81546 | 100.42 | 3950 | 3877 | 773.4 |
| A | 13 | 254 | 57705 | 69.6 | 3950 | 3877 | 773.4 |
| A | 0 | 226 | 34328 | 39.37 | 3950 | 3877 | 773.4 |
| B | 0 | 190 | 172769 | 235.55 | 3889 | 3801 | 717.3 |
| B | 0 | 229 | 95941 | 128.45 | 3889 | 3801 | 717.3 |
| B | 12 | 111 | 84678 | 112.74 | 3889 | 3801 | 717.3 |
| C | 14 | 238 | 602062 | 705.14 | 3712 | 3742 | 848.5 |
| C | 13 | 61 | 26076 | 26.32 | 3712 | 3742 | 848.5 |
| C | 10 | 22 | 23573 | 23.37 | 3712 | 3742 | 848.5 |
| D | 1 | 52 | 5432910 | 6040.25 | 3772 | 3662 | 898.8 |
| D | 2 | 152 | 268586 | 294.74 | 3772 | 3662 | 898.8 |
| D | 6 | 112 | 220553 | 241.3 | 3772 | 3662 | 898.8 |
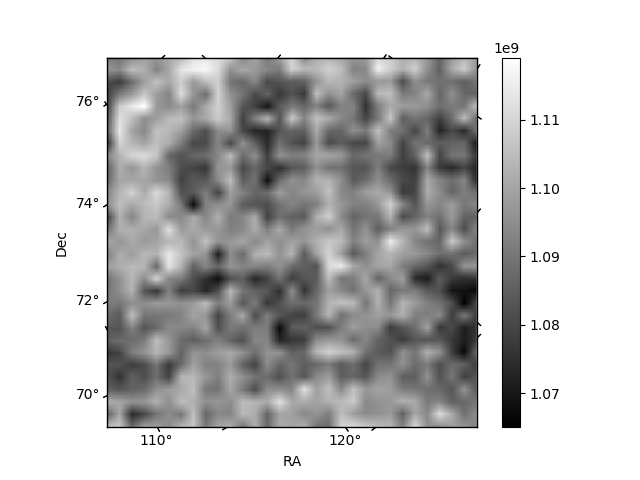
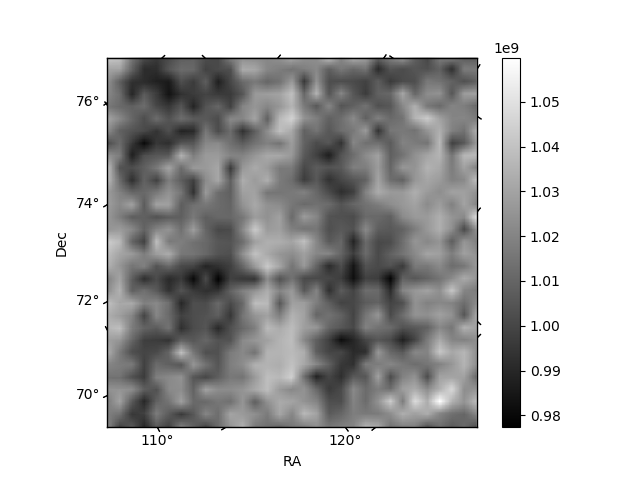
Histogram calculated using DETX and DETY for each event in the final _common_clean file
| Quadrant A |  |
 |
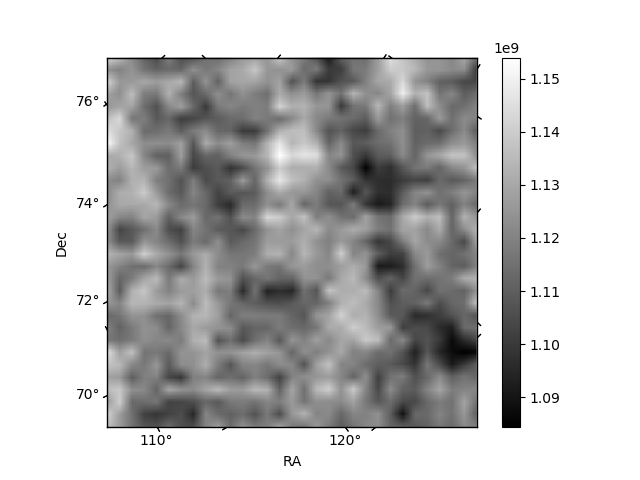
Quadrant B |
|---|---|---|---|
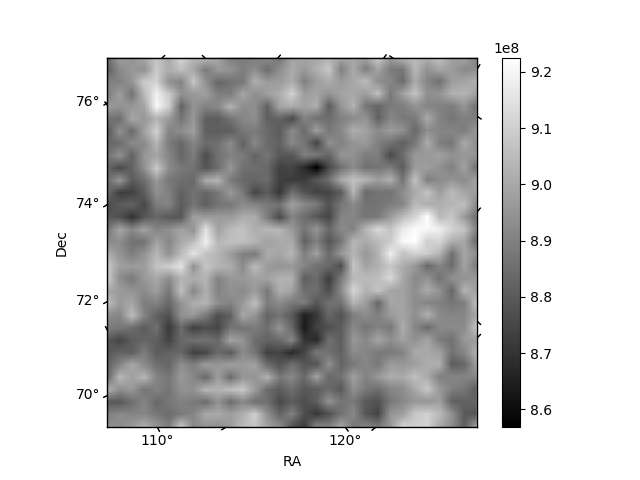
| Quadrant D | 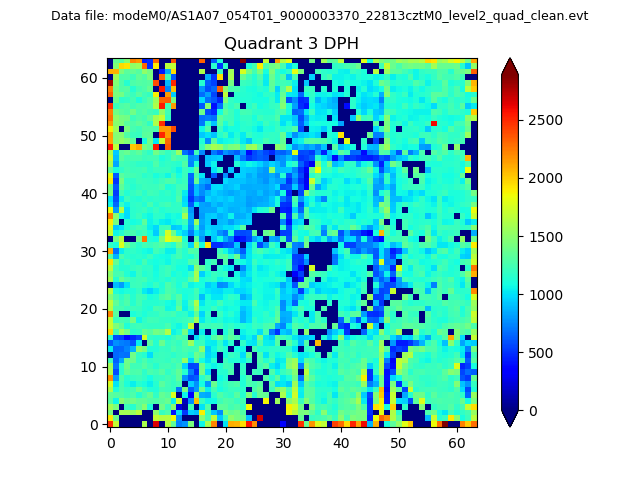 |
 |
Quadrant C |
| Plot type | Count rate plots | Images |
|---|---|---|
| Comparison with Poisson distribution Blue bars denote a histogram of data divided into 1 sec bins. Red curve is a Poisson curve with rate = median count rate of data. |
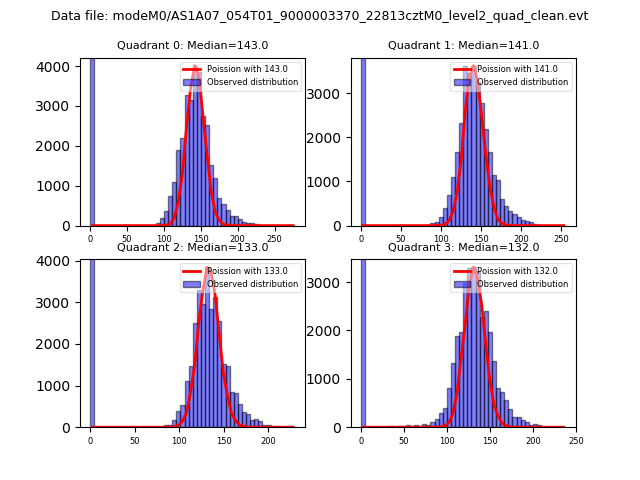 |
 |
| Quadrant-wise count rates Data is divided into 100 sec bins |
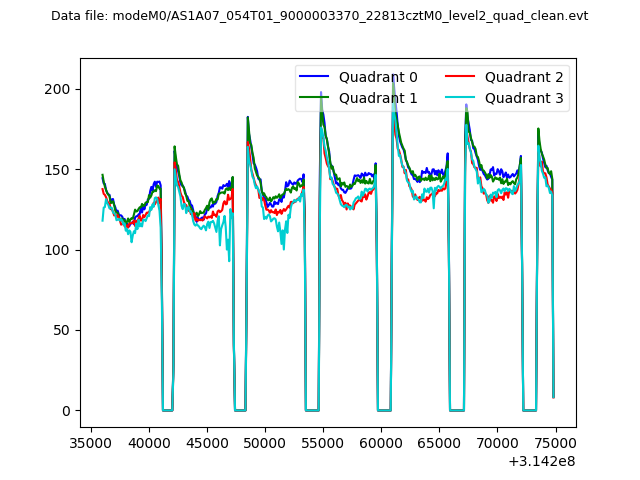 |
|
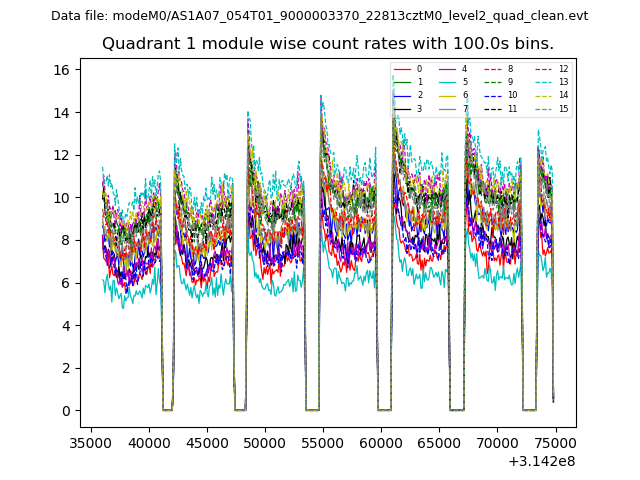
| Module-wise count rates for Quadrant A Data is divided into 100 sec bins |
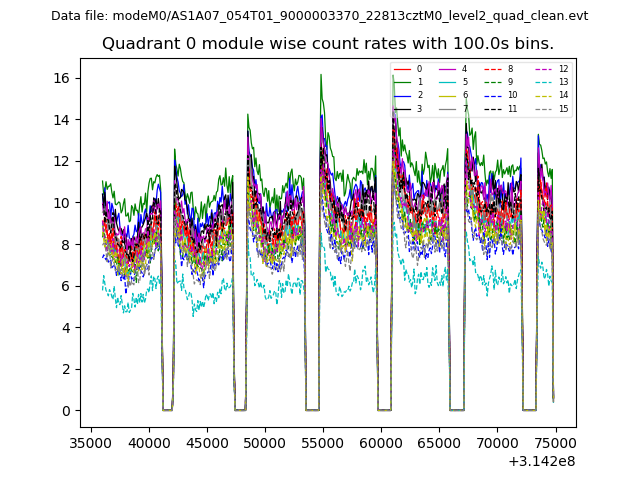 |
 |
| Module-wise count rates for Quadrant B Data is divided into 100 sec bins |
 |
 |
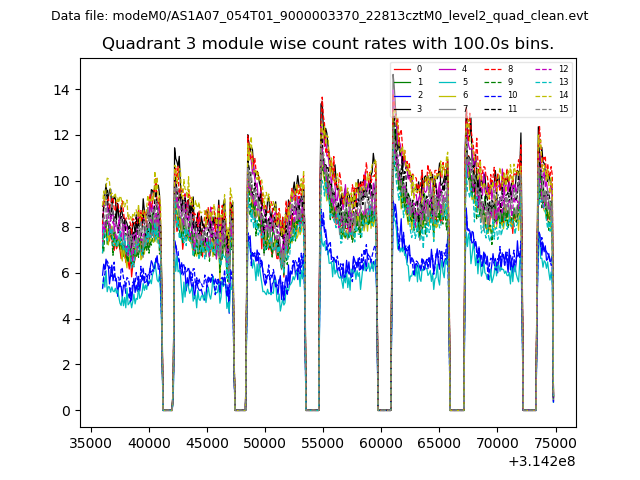
| Module-wise count rates for Quadrant C Data is divided into 100 sec bins |
 |
 |
| Module-wise count rates for Quadrant D Data is divided into 100 sec bins |
 |
 |
| Parameter | Plot |
|---|---|
| CZT HV Monitor | 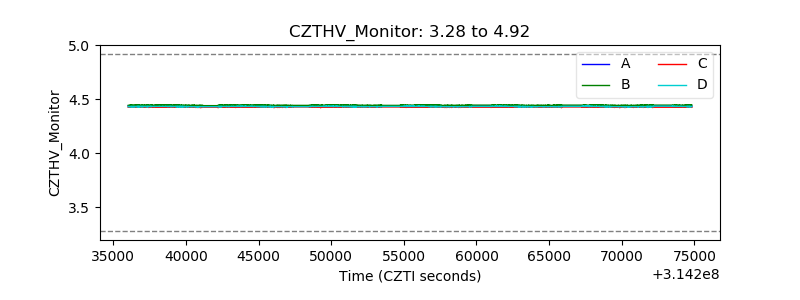 |
| D_VDD | 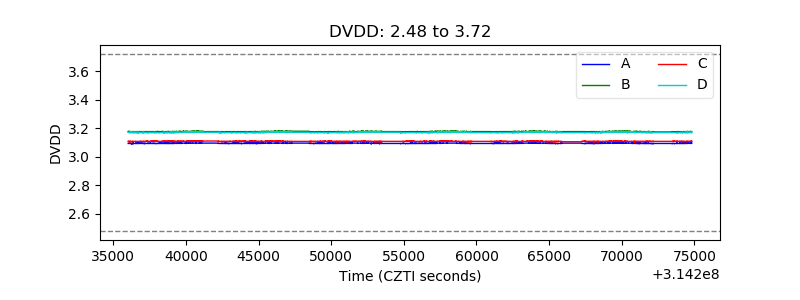 |
| Temperature 1 | 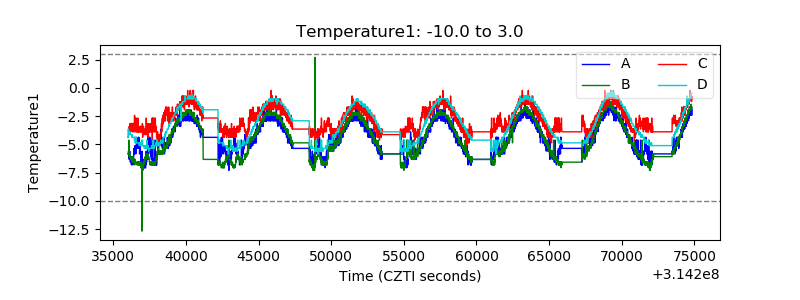 |
| Veto HV Monitor | 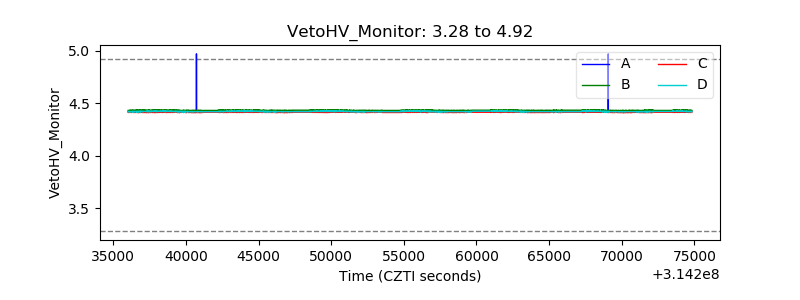 |
| Veto LLD |  |
| Alpha Counter | 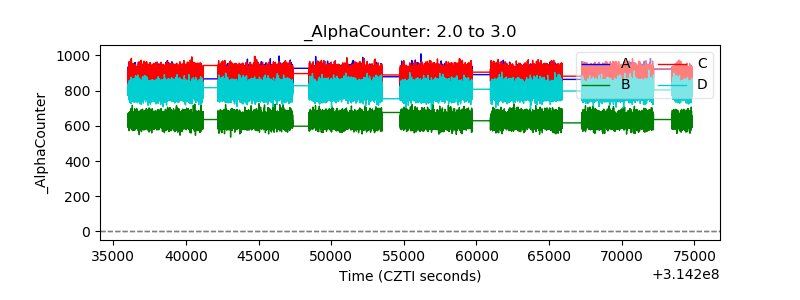 |
| _CPM_Rate | 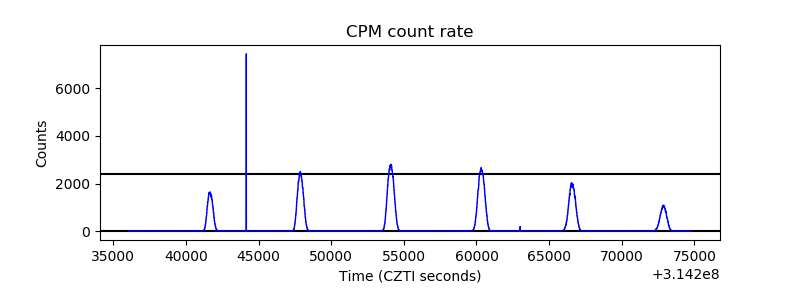 |
| CZT Counter | 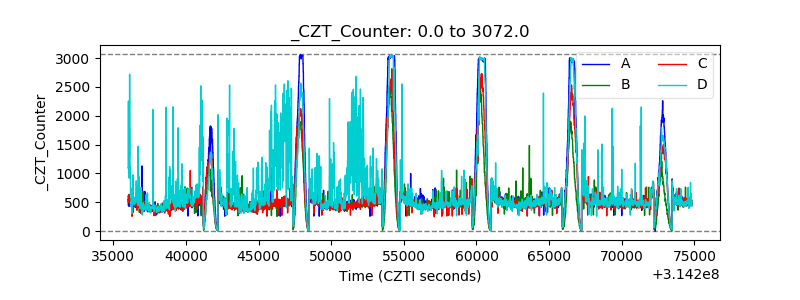 |
| +2.5 Volts monitor |  |
| +5 Volts monitor | 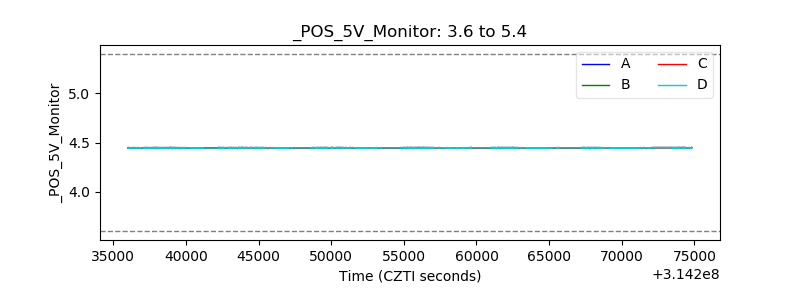 |
| _ROLL_ROT | 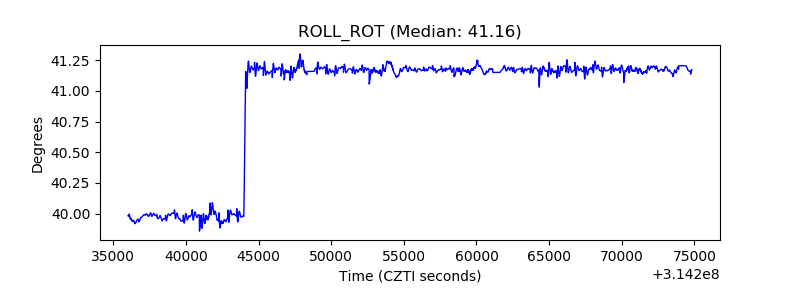 |
| _Roll_DEC | 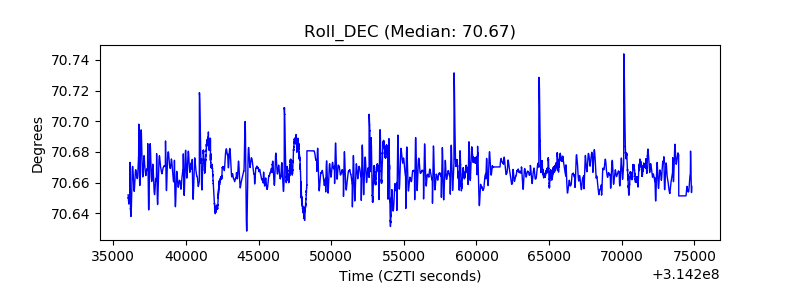 |
| _Roll_RA |  |
| Veto Counter | 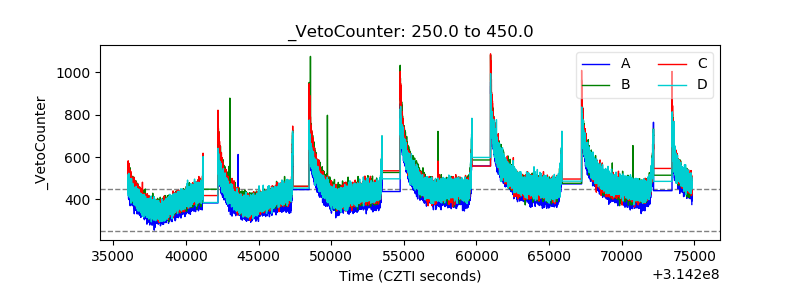 |