| Param | Original file | Final file |
|---|---|---|
| Filename | modeM0/AS1A07_054T01_9000003370_22814cztM0_level2.evt | modeM0/AS1A07_054T01_9000003370_22814cztM0_level2_quad_clean.evt |
| Size (bytes) | 435,683,520 | 128,626,560 |
| Size | 415.5 MB | 122.7 MB |
| Events in quadrant A | 3,081,367 | 896,680 |
| Events in quadrant B | 3,073,465 | 890,159 |
| Events in quadrant C | 3,020,646 | 837,116 |
| Events in quadrant D | 3,591,082 | 832,509 |
| Mode M0 | |||
|---|---|---|---|
| Quadrant | BADHDUFLAG | Total packets | Discarded packets |
| A | 0 | 12965 | 1 |
| B | 0 | 12989 | 1 |
| C | 0 | 12849 | 1 |
| D | 0 | 14611 | 1 |
| Mode SS | |||
|---|---|---|---|
| Quadrant | BADHDUFLAG | Total packets | Discarded packets |
| A | 0 | 128 | 0 |
| B | 0 | 128 | 0 |
| C | 0 | 128 | 0 |
| D | 0 | 128 | 0 |
| Mode M9 | |||
|---|---|---|---|
| Quadrant | BADHDUFLAG | Total packets | Discarded packets |
| A | 0 | 11 | 0 |
| B | 0 | 11 | 0 |
| C | 0 | 11 | 0 |
| D | 0 | 11 | 0 |
| Quadrant | Total seconds | Saturated seconds | Saturation percentage |
|---|---|---|---|
| A | 6298 | 88 | 1.397269% |
| B | 6297 | 103 | 1.635700% |
| C | 6297 | 104 | 1.651580% |
| D | 6297 | 182 | 2.890265% |
Noise dominated data is calculated using 1-second bins in cleaned event files. If a bin has >2000 counts, and if more than 50% of those come from <1% of pixels, then it is considered to be noise-dominated and hence unusable.
| Quadrant | # 1 sec bins | Bins with >0 counts | Bins with >2000 counts | High rate bins dominated by noise | Noise dominated (total time) | Noise dominated (detector-on time) | Marked lightcurve |
|---|---|---|---|---|---|---|---|
| A | 7373 | 6299 | 0 | 0 | 0.00% | 0.00% | 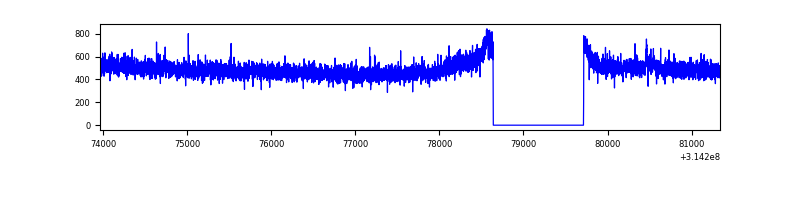 |
| B | 7372 | 6298 | 1 | 1 | 0.01% | 0.02% | 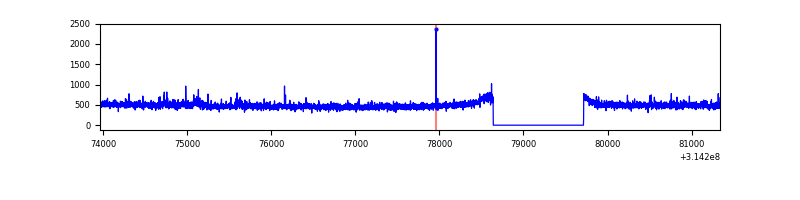 |
| C | 7372 | 6298 | 0 | 0 | 0.00% | 0.00% | 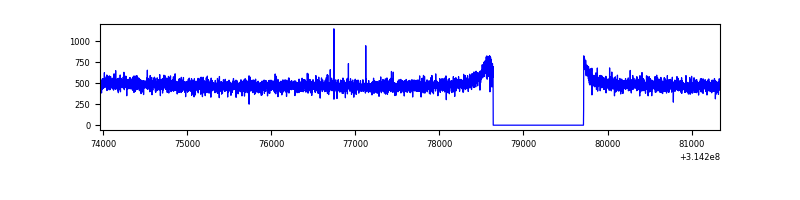 |
| D | 7372 | 6298 | 108 | 108 | 1.47% | 1.71% | 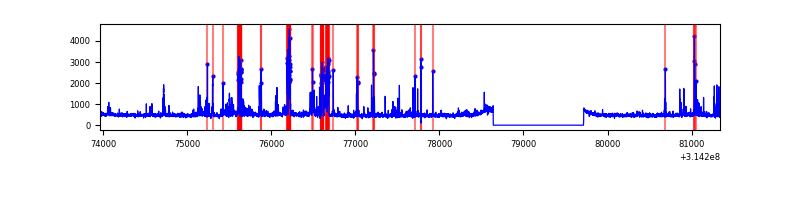 |
Top three noisy pixels from each quadrant. If the there are fewer than three noisy pixels in the level2.evt file, extra rows are filled as -1
| Pixel properties | Quadrant properties | ||||||
|---|---|---|---|---|---|---|---|
| Quadrant | DetID | PixID | Counts | Sigma | Mean | Median | Sigma |
| A | 13 | 252 | 29020 | 179.79 | 791 | 776 | 157.1 |
| A | 13 | 254 | 11967 | 71.24 | 791 | 776 | 157.1 |
| A | 0 | 226 | 6986 | 39.53 | 791 | 776 | 157.1 |
| B | 12 | 111 | 16770 | 110.16 | 776 | 756 | 145.4 |
| B | 0 | 230 | 16185 | 106.14 | 776 | 756 | 145.4 |
| B | 11 | 111 | 14947 | 97.62 | 776 | 756 | 145.4 |
| C | 14 | 238 | 120425 | 702.39 | 743 | 747 | 170.4 |
| C | 13 | 61 | 5321 | 26.84 | 743 | 747 | 170.4 |
| C | 3 | 202 | 1903 | 6.78 | 743 | 747 | 170.4 |
| D | 1 | 52 | 496831 | 2690.49 | 761 | 739 | 184.4 |
| D | 9 | 85 | 70870 | 380.35 | 761 | 739 | 184.4 |
| D | 8 | 195 | 41508 | 221.11 | 761 | 739 | 184.4 |
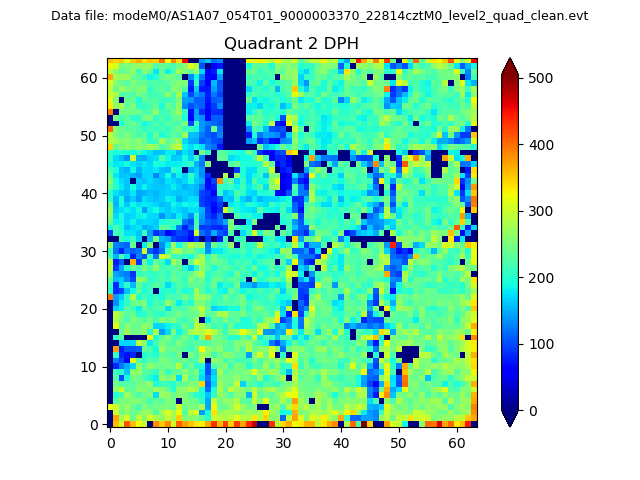
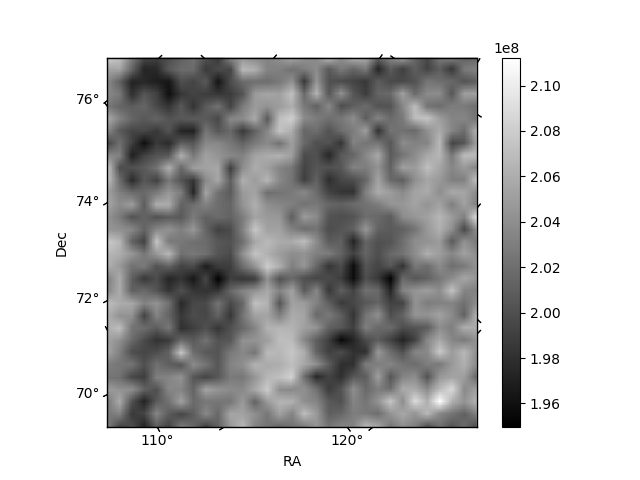
Histogram calculated using DETX and DETY for each event in the final _common_clean file
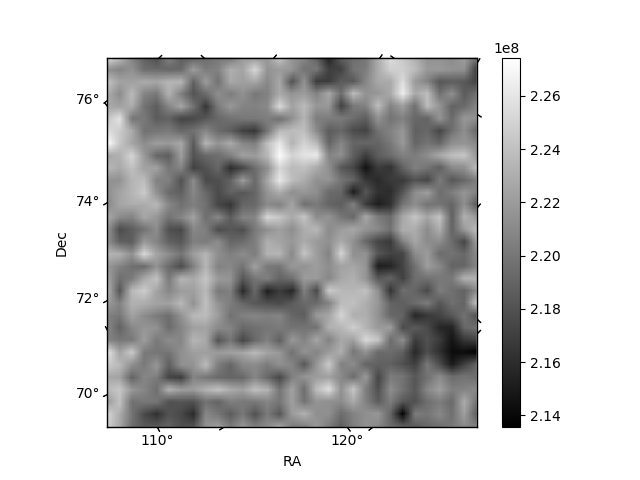
| Quadrant A | 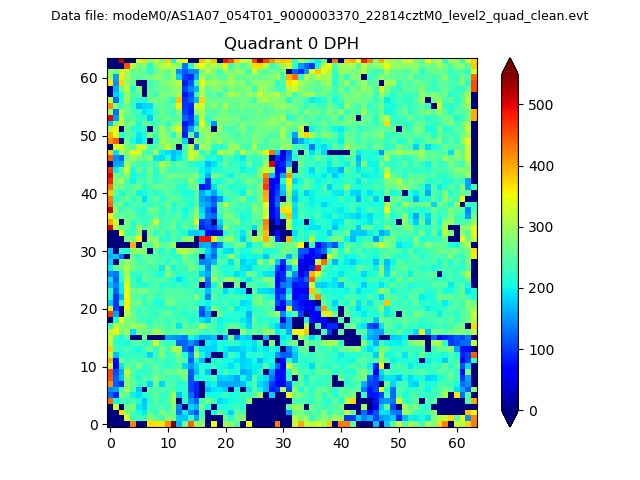 |
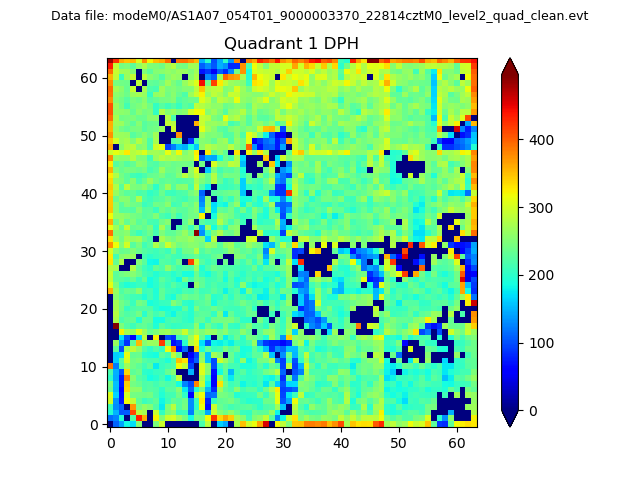 |
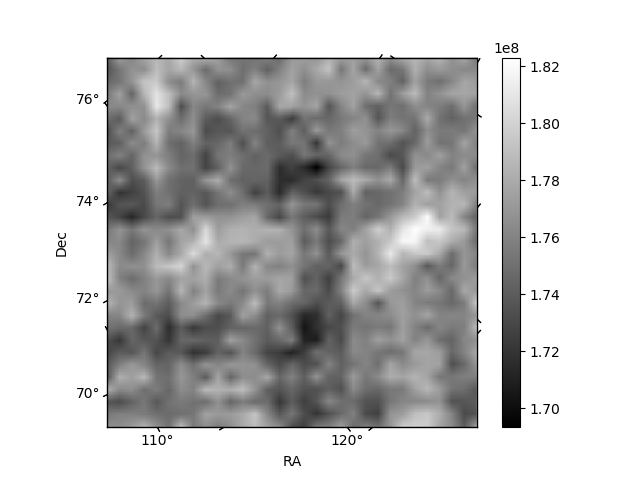
Quadrant B |
|---|---|---|---|
| Quadrant D | 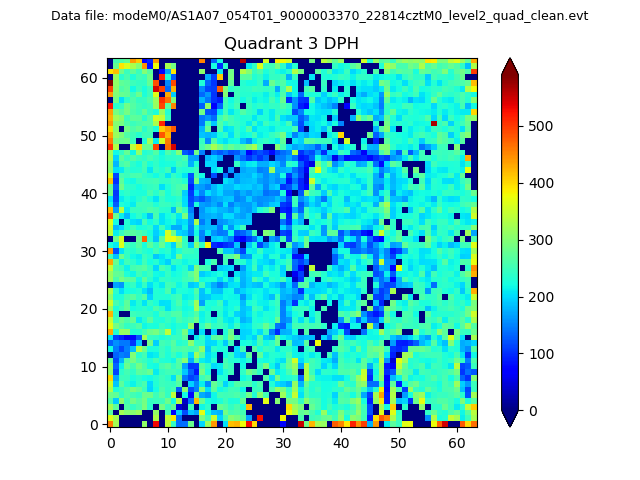 |
 |
Quadrant C |
| Plot type | Count rate plots | Images |
|---|---|---|
| Comparison with Poisson distribution Blue bars denote a histogram of data divided into 1 sec bins. Red curve is a Poisson curve with rate = median count rate of data. |
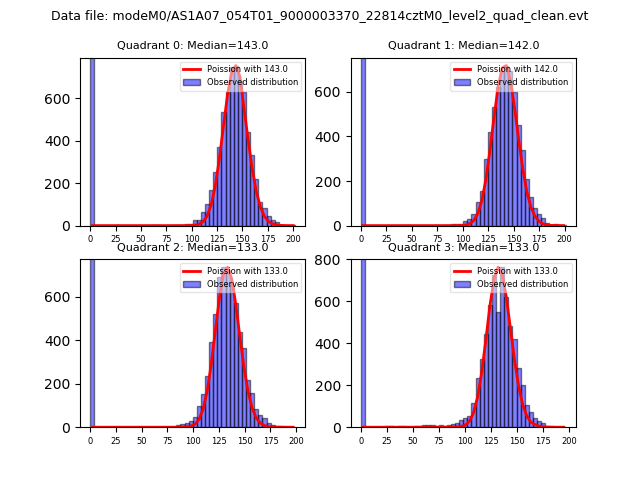 |
 |
| Quadrant-wise count rates Data is divided into 100 sec bins |
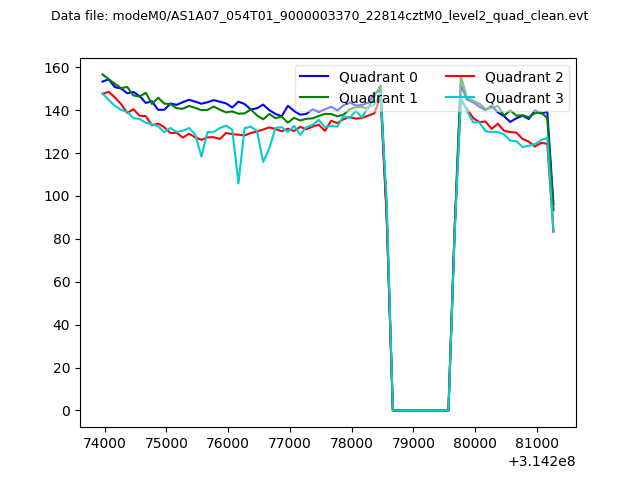 |
|
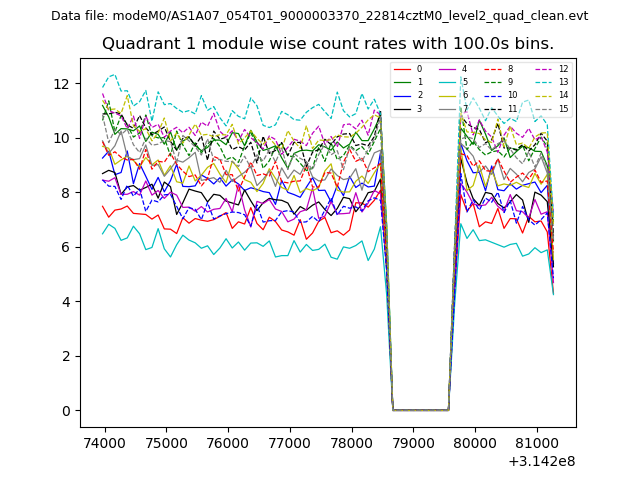
| Module-wise count rates for Quadrant A Data is divided into 100 sec bins |
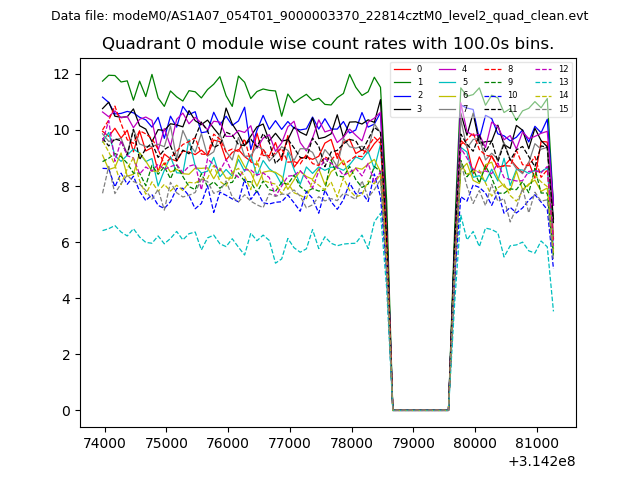 |
 |
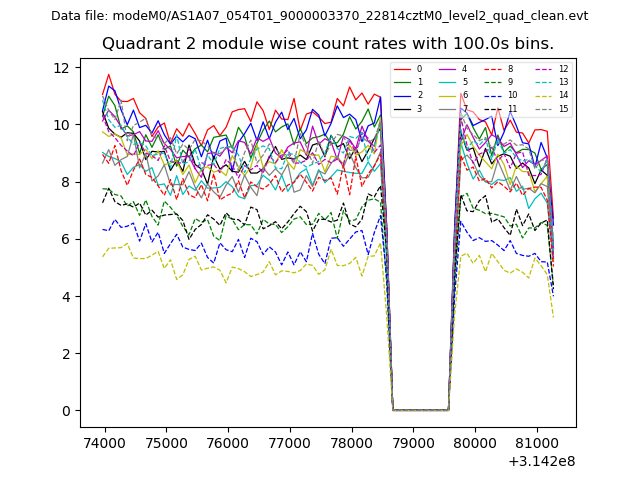
| Module-wise count rates for Quadrant B Data is divided into 100 sec bins |
 |
 |
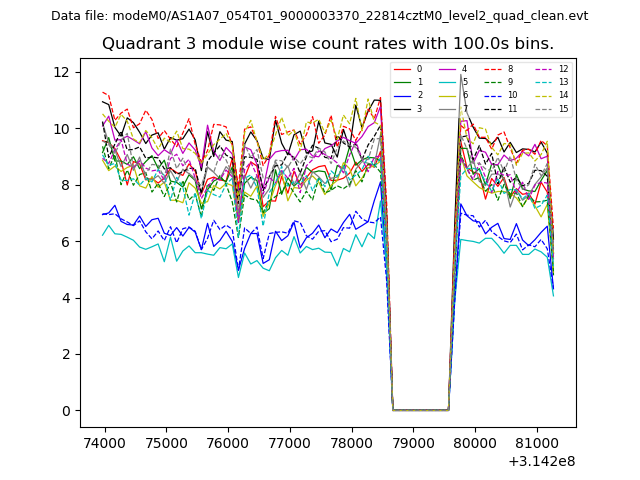
| Module-wise count rates for Quadrant C Data is divided into 100 sec bins |
 |
 |
| Module-wise count rates for Quadrant D Data is divided into 100 sec bins |
 |
 |
| Parameter | Plot |
|---|---|
| CZT HV Monitor | 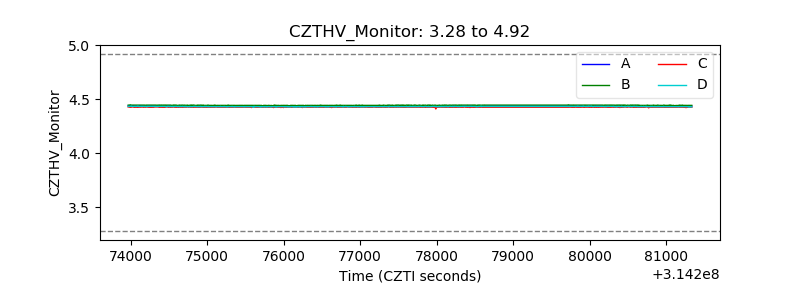 |
| D_VDD | 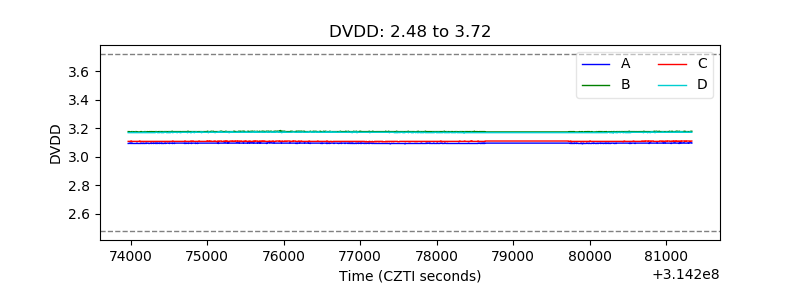 |
| Temperature 1 | 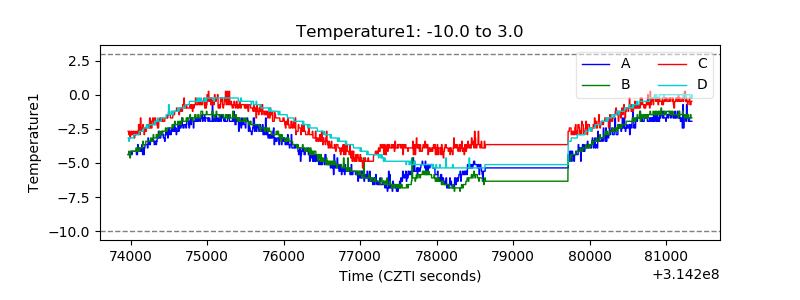 |
| Veto HV Monitor | 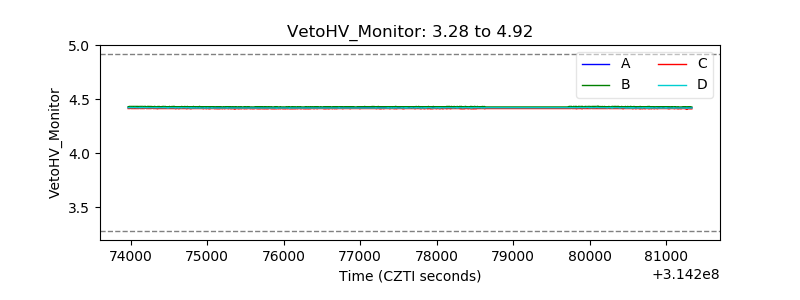 |
| Veto LLD | 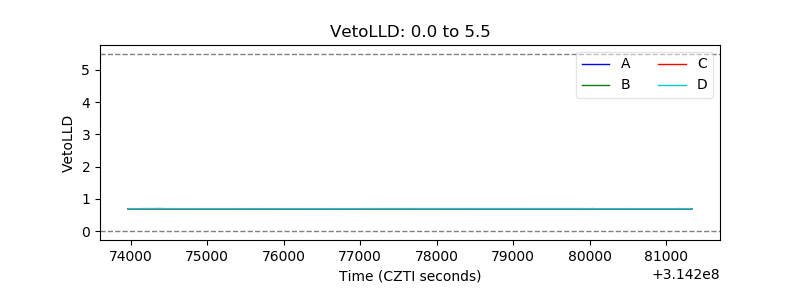 |
| Alpha Counter |  |
| _CPM_Rate | 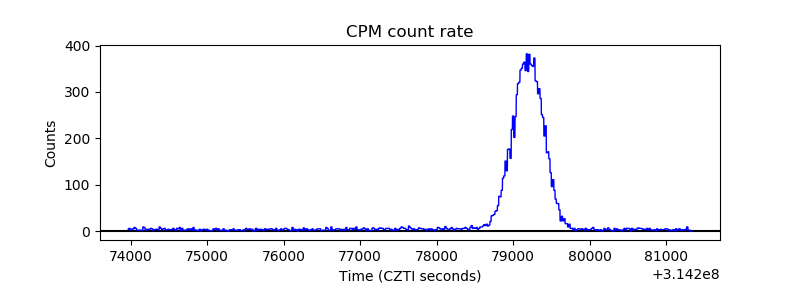 |
| CZT Counter |  |
| +2.5 Volts monitor |  |
| +5 Volts monitor |  |
| _ROLL_ROT | 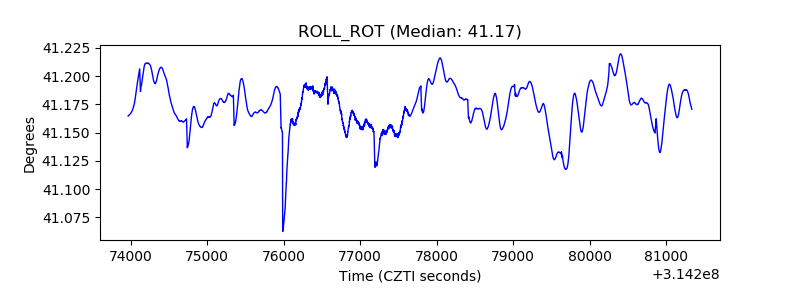 |
| _Roll_DEC | 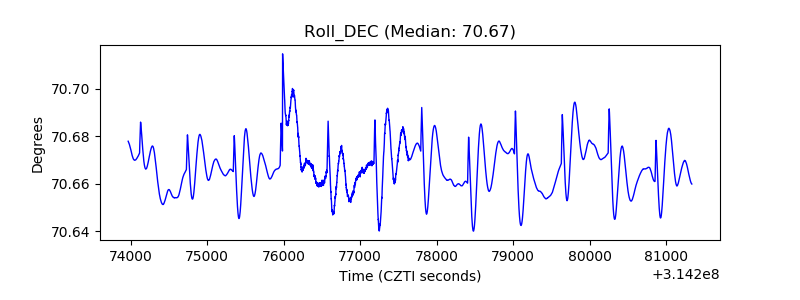 |
| _Roll_RA |  |
| Veto Counter | 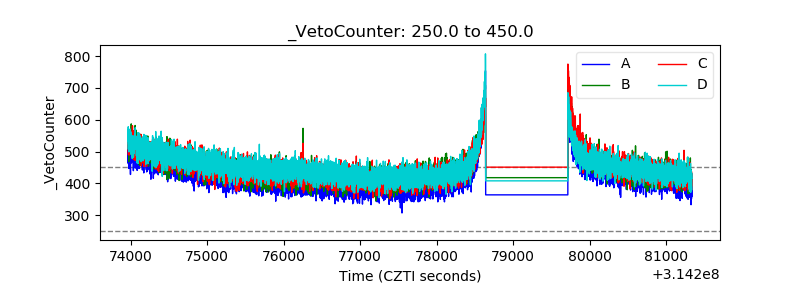 |