| Param | Original file | Final file |
|---|---|---|
| Filename | modeM0/AS1A07_054T01_9000003370_22815cztM0_level2.evt | modeM0/AS1A07_054T01_9000003370_22815cztM0_level2_quad_clean.evt |
| Size (bytes) | 218,456,640 | 66,908,160 |
| Size | 208.3 MB | 63.8 MB |
| Events in quadrant A | 1,553,242 | 464,935 |
| Events in quadrant B | 1,559,179 | 456,849 |
| Events in quadrant C | 1,549,124 | 428,337 |
| Events in quadrant D | 1,719,182 | 432,762 |
| Mode M0 | |||
|---|---|---|---|
| Quadrant | BADHDUFLAG | Total packets | Discarded packets |
| A | 0 | 6894 | 0 |
| B | 0 | 6895 | 0 |
| C | 0 | 6861 | 0 |
| D | 0 | 7314 | 0 |
| Mode SS | |||
|---|---|---|---|
| Quadrant | BADHDUFLAG | Total packets | Discarded packets |
| A | 0 | 70 | 0 |
| B | 0 | 70 | 0 |
| C | 0 | 70 | 0 |
| D | 0 | 70 | 0 |
| Quadrant | Total seconds | Saturated seconds | Saturation percentage |
|---|---|---|---|
| A | 3426 | 0 | 0.000000% |
| B | 3427 | 4 | 0.116720% |
| C | 3427 | 12 | 0.350160% |
| D | 3427 | 11 | 0.320980% |
Noise dominated data is calculated using 1-second bins in cleaned event files. If a bin has >2000 counts, and if more than 50% of those come from <1% of pixels, then it is considered to be noise-dominated and hence unusable.
| Quadrant | # 1 sec bins | Bins with >0 counts | Bins with >2000 counts | High rate bins dominated by noise | Noise dominated (total time) | Noise dominated (detector-on time) | Marked lightcurve |
|---|---|---|---|---|---|---|---|
| A | 3426 | 3426 | 0 | 0 | 0.00% | 0.00% | 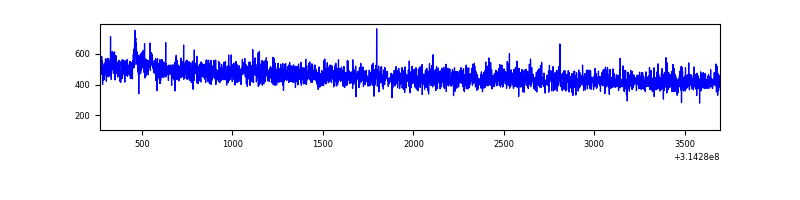 |
| B | 3427 | 3427 | 0 | 0 | 0.00% | 0.00% | 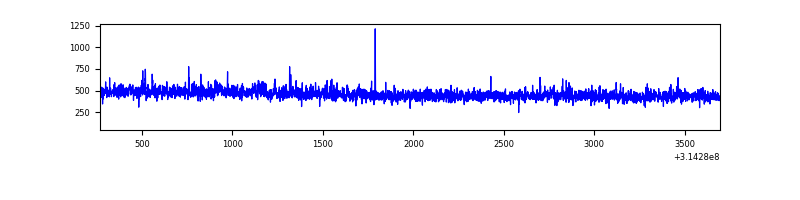 |
| C | 3427 | 3427 | 0 | 0 | 0.00% | 0.00% | 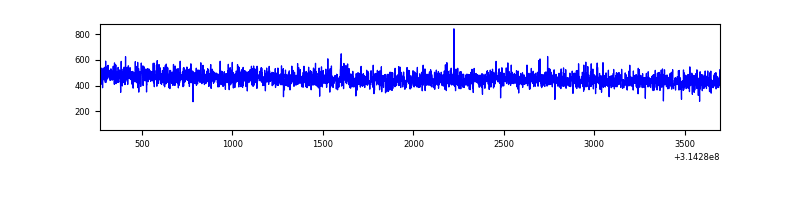 |
| D | 3427 | 3427 | 10 | 10 | 0.29% | 0.29% | 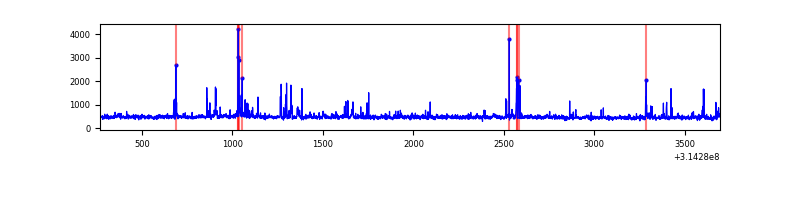 |
Top three noisy pixels from each quadrant. If the there are fewer than three noisy pixels in the level2.evt file, extra rows are filled as -1
| Pixel properties | Quadrant properties | ||||||
|---|---|---|---|---|---|---|---|
| Quadrant | DetID | PixID | Counts | Sigma | Mean | Median | Sigma |
| A | 13 | 252 | 11620 | 139.03 | 399 | 392 | 80.8 |
| A | 13 | 254 | 6587 | 76.71 | 399 | 392 | 80.8 |
| A | 0 | 226 | 3494 | 38.41 | 399 | 392 | 80.8 |
| B | 0 | 228 | 9808 | 126.56 | 393 | 384 | 74.5 |
| B | 12 | 111 | 8360 | 107.11 | 393 | 384 | 74.5 |
| B | 0 | 230 | 8307 | 106.4 | 393 | 384 | 74.5 |
| C | 14 | 238 | 62254 | 691.36 | 381 | 383 | 89.5 |
| C | 13 | 61 | 2666 | 25.51 | 381 | 383 | 89.5 |
| C | 0 | 207 | 1177 | 8.87 | 381 | 383 | 89.5 |
| D | 1 | 52 | 71089 | 747.63 | 390 | 379 | 94.6 |
| D | 8 | 195 | 65444 | 687.95 | 390 | 379 | 94.6 |
| D | 9 | 85 | 36909 | 386.24 | 390 | 379 | 94.6 |
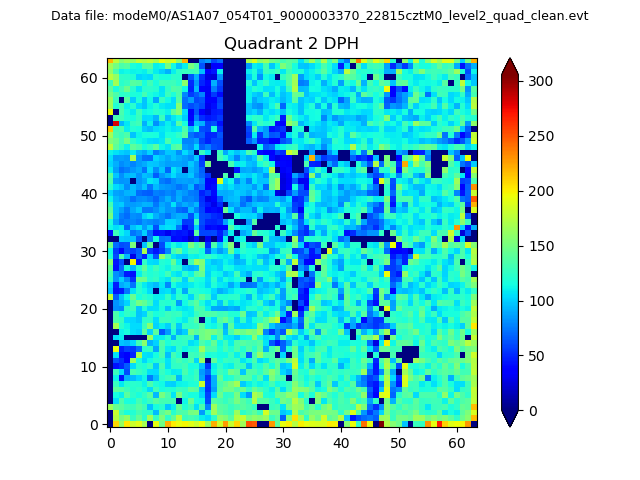
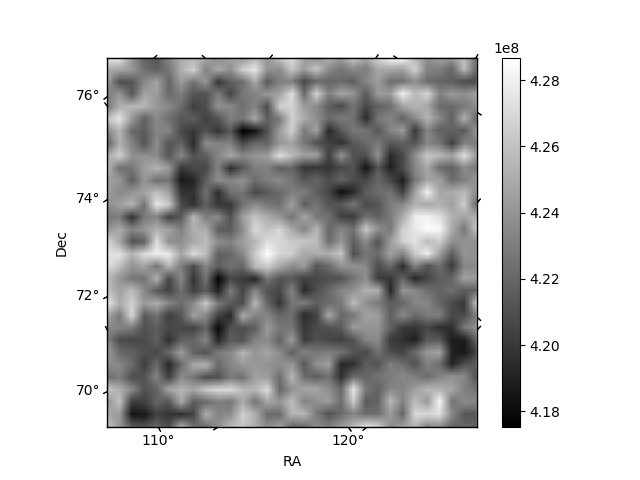
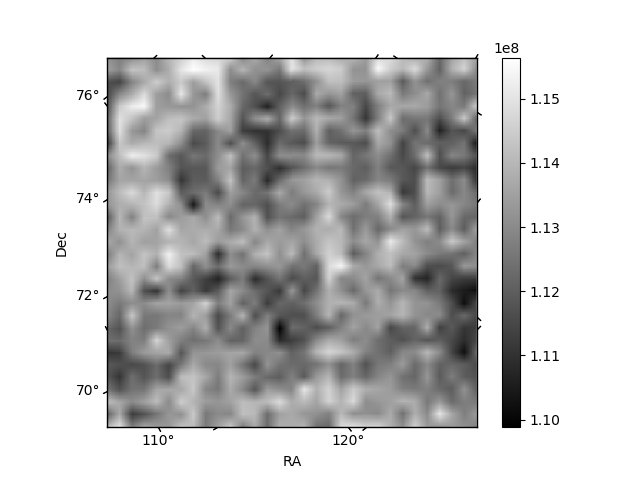
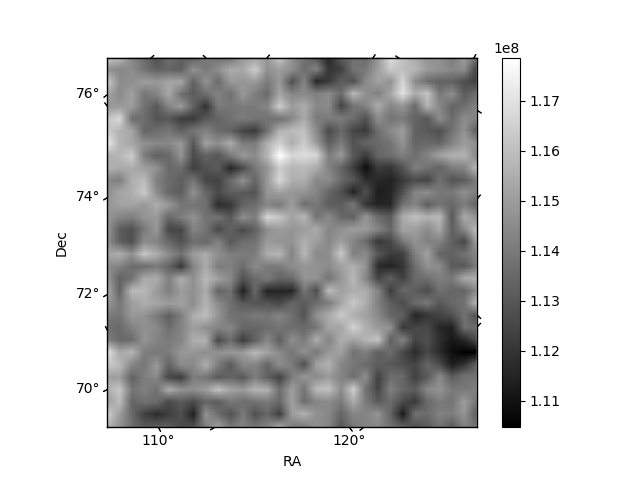
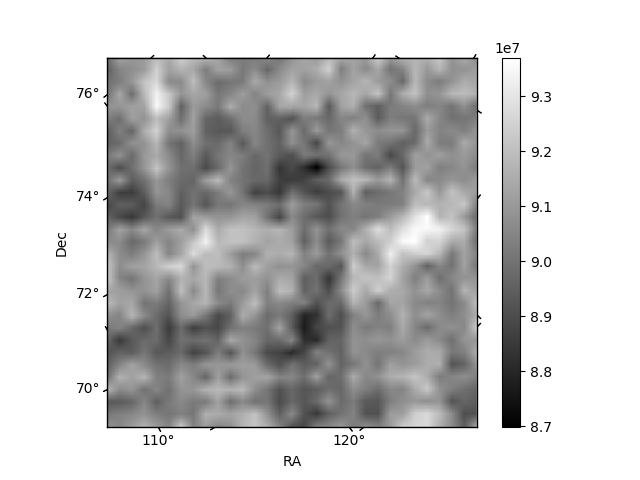
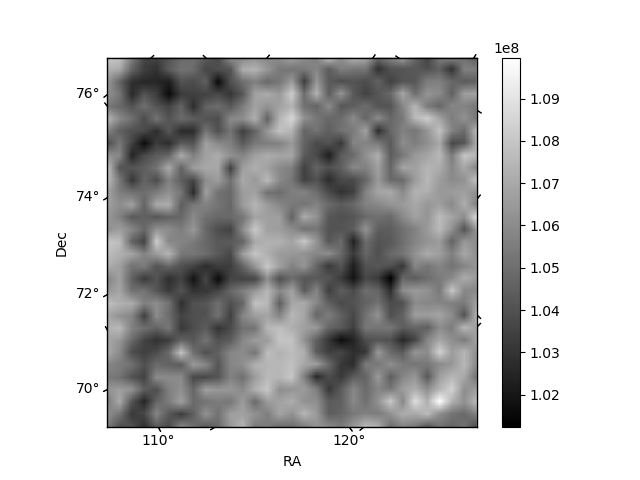
Histogram calculated using DETX and DETY for each event in the final _common_clean file
| Quadrant A | 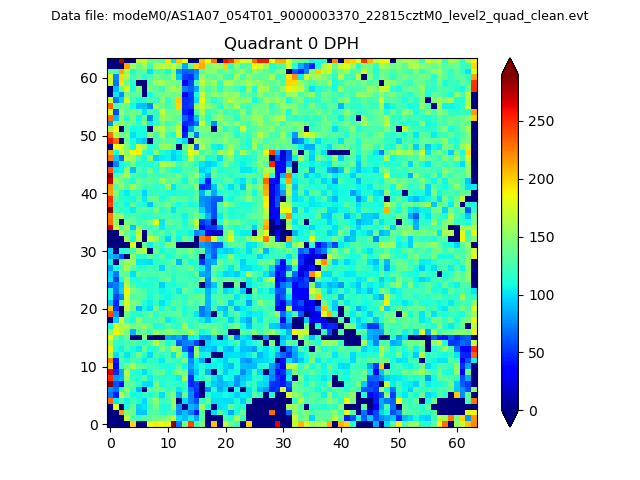 |
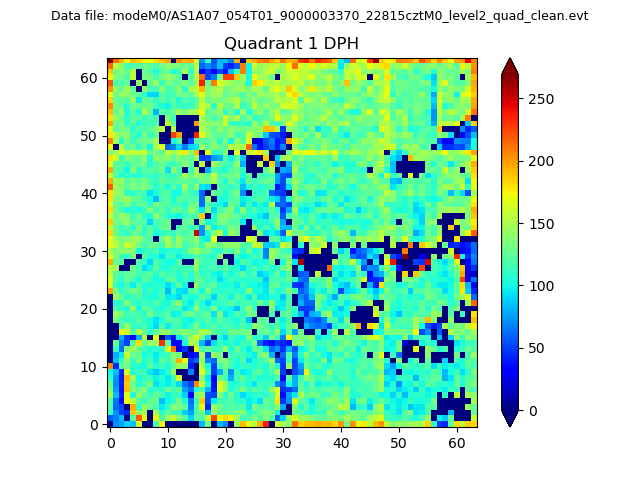 |
Quadrant B |
|---|---|---|---|
| Quadrant D | 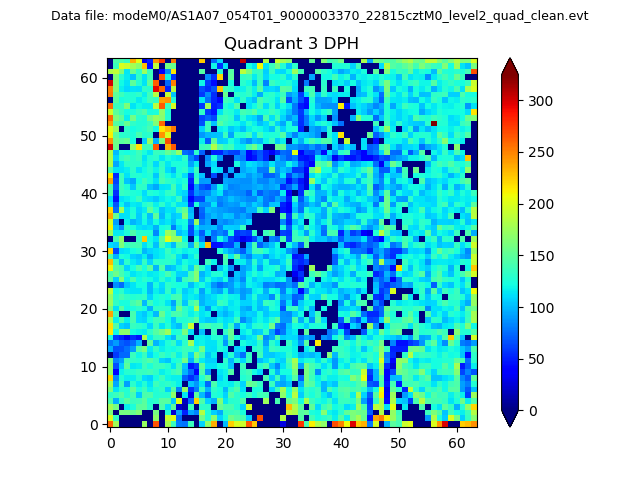 |
 |
Quadrant C |
| Plot type | Count rate plots | Images |
|---|---|---|
| Comparison with Poisson distribution Blue bars denote a histogram of data divided into 1 sec bins. Red curve is a Poisson curve with rate = median count rate of data. |
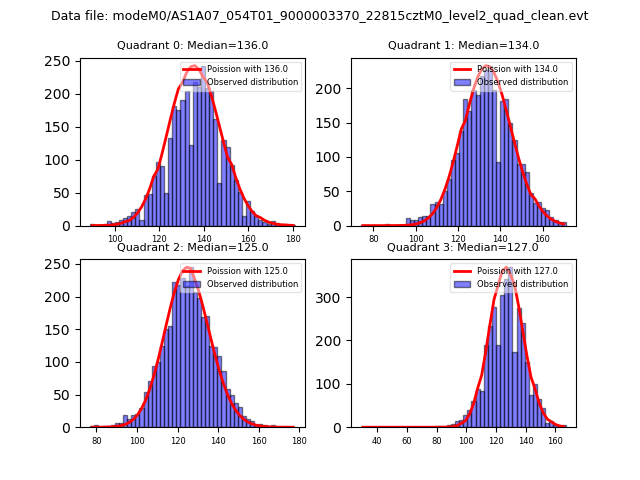 |
 |
| Quadrant-wise count rates Data is divided into 100 sec bins |
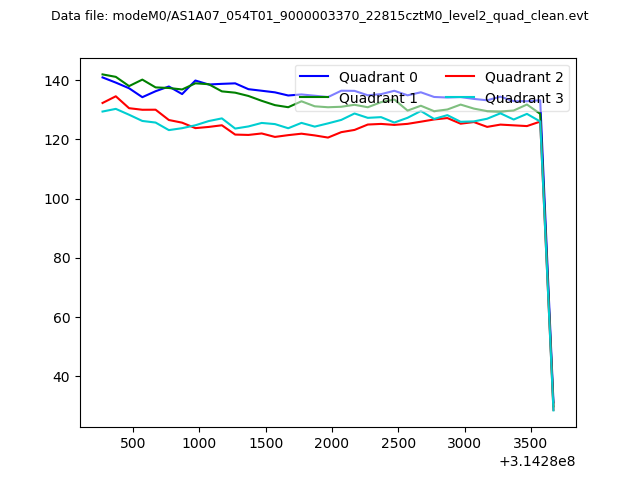 |
|
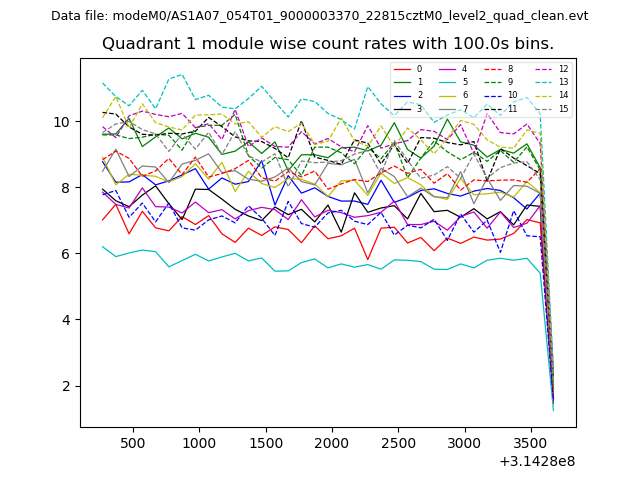
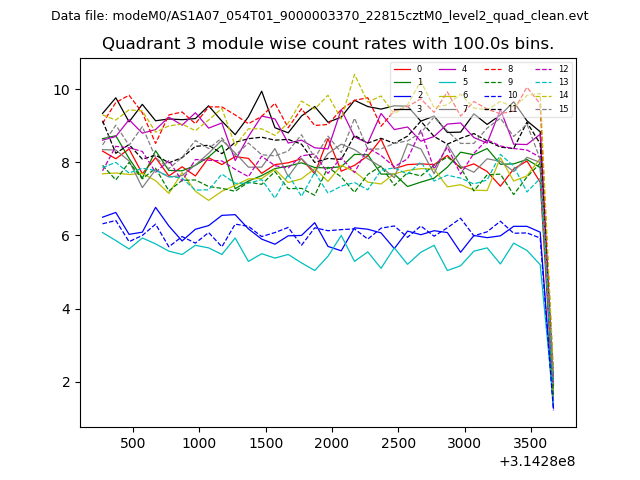
| Module-wise count rates for Quadrant A Data is divided into 100 sec bins |
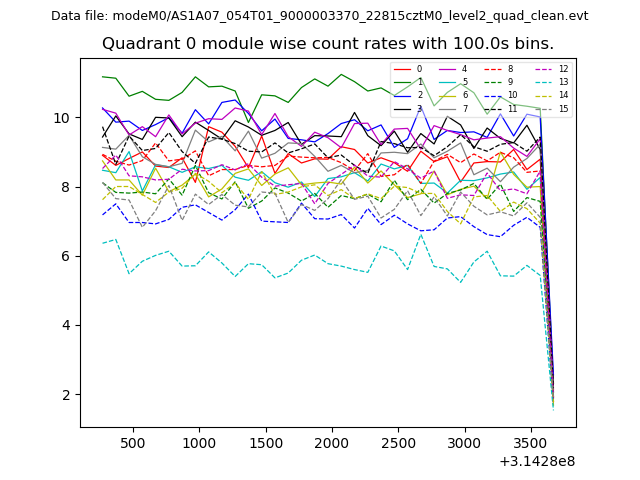 |
 |
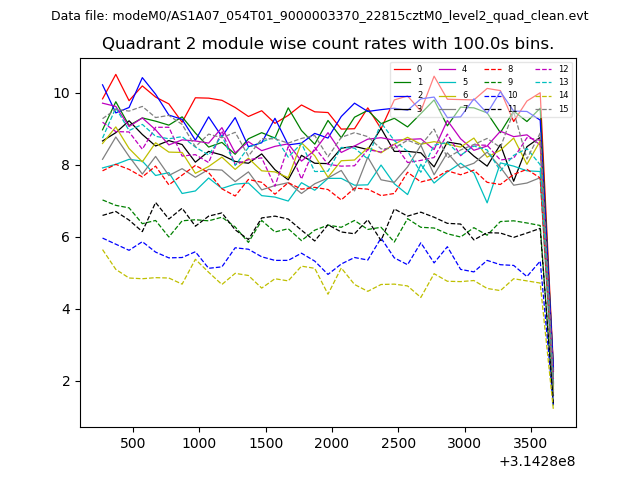
| Module-wise count rates for Quadrant B Data is divided into 100 sec bins |
 |
 |
| Module-wise count rates for Quadrant C Data is divided into 100 sec bins |
 |
 |
| Module-wise count rates for Quadrant D Data is divided into 100 sec bins |
 |
 |
| Parameter | Plot |
|---|---|
| CZT HV Monitor | 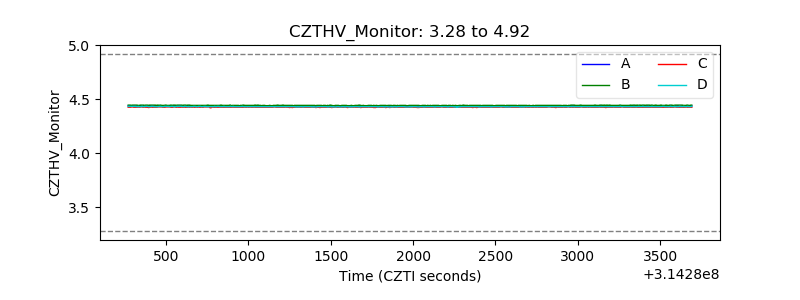 |
| D_VDD | 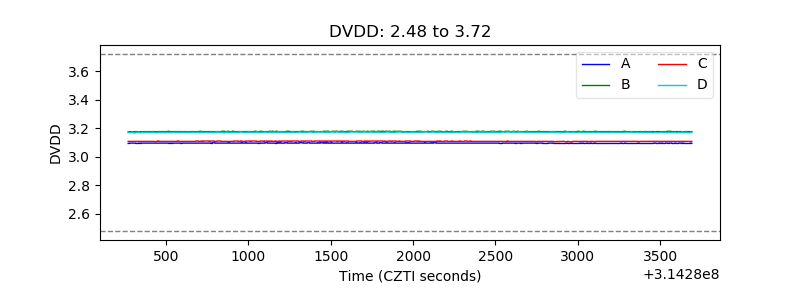 |
| Temperature 1 | 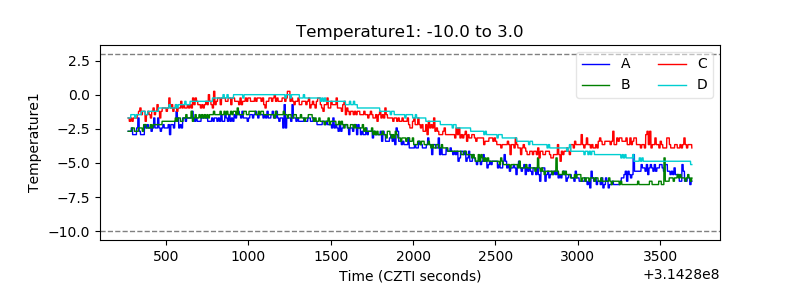 |
| Veto HV Monitor | 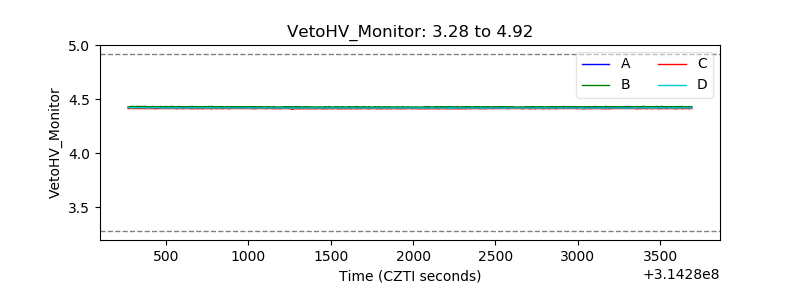 |
| Veto LLD | 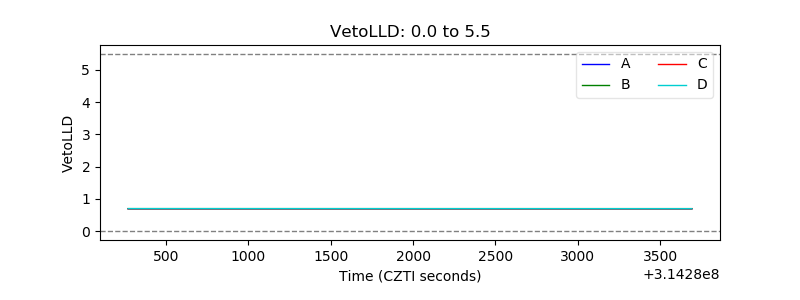 |
| Alpha Counter | 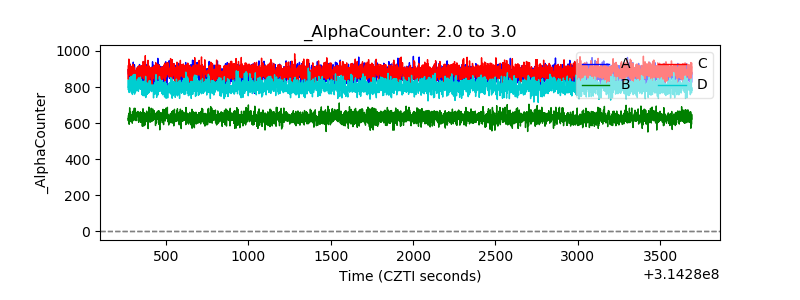 |
| _CPM_Rate | 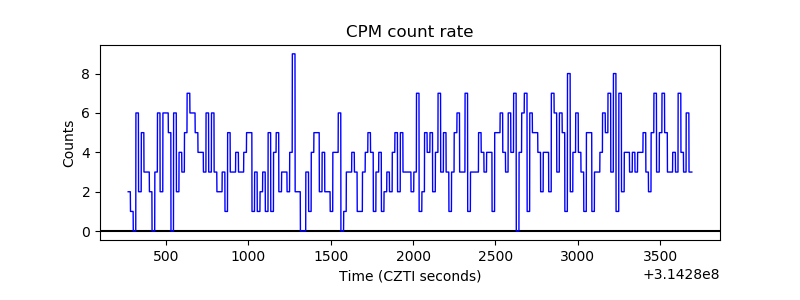 |
| CZT Counter | 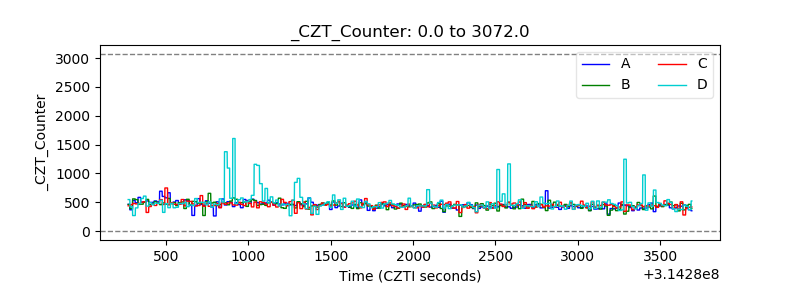 |
| +2.5 Volts monitor |  |
| +5 Volts monitor |  |
| _ROLL_ROT | 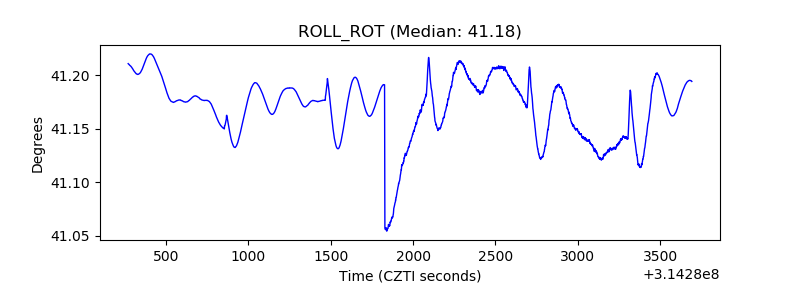 |
| _Roll_DEC | 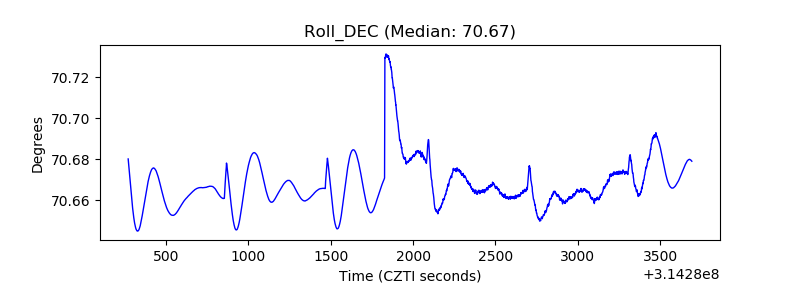 |
| _Roll_RA | 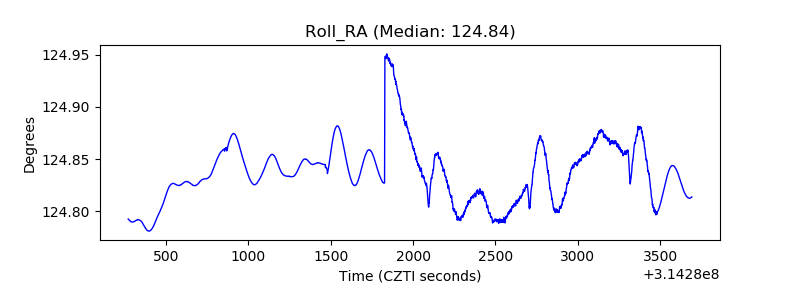 |
| Veto Counter | 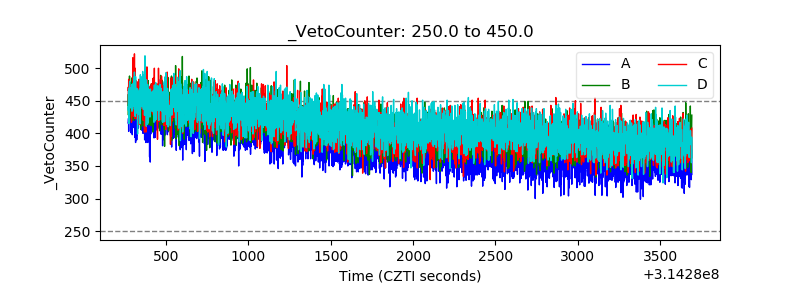 |