| Param | Original file | Final file |
|---|---|---|
| Filename | modeM0/AS1C05_012T02_9000003372cztM0_level2.fits | modeM0/AS1C05_012T02_9000003372cztM0_level2_quad_clean.evt |
| Size (bytes) | 953,271,360 | 1,096,966,080 |
| Size | 909.1 MB | 1.0 GB |
| Events in quadrant A | 5,903,894 | 6,996,456 |
| Events in quadrant B | 5,617,702 | 6,971,044 |
| Events in quadrant C | 5,656,390 | 6,577,391 |
| Events in quadrant D | 4,881,224 | 5,869,748 |
| Mode M0 | |||
|---|---|---|---|
| Quadrant | BADHDUFLAG | Total packets | Discarded packets |
| A | 0 | 205519 | 0 |
| B | 0 | 205050 | 0 |
| C | 0 | 203555 | 0 |
| D | 0 | 288000 | 0 |
| Mode M9 | |||
|---|---|---|---|
| Quadrant | BADHDUFLAG | Total packets | Discarded packets |
| A | 0 | 142 | 0 |
| B | 0 | 142 | 0 |
| C | 0 | 142 | 0 |
| D | 0 | 142 | 0 |
| Mode SS | |||
|---|---|---|---|
| Quadrant | BADHDUFLAG | Total packets | Discarded packets |
| A | 0 | 2022 | 0 |
| B | 0 | 2020 | 0 |
| C | 0 | 2022 | 0 |
| D | 0 | 2022 | 0 |
| Quadrant | Total seconds | Saturated seconds | Saturation percentage |
|---|---|---|---|
| A | 99355 | 629 | 0.633083% |
| B | 99356 | 795 | 0.800153% |
| C | 99359 | 1175 | 1.182580% |
| D | 99355 | 5049 | 5.081777% |
Noise dominated data is calculated using 1-second bins in cleaned event files. If a bin has >2000 counts, and if more than 50% of those come from <1% of pixels, then it is considered to be noise-dominated and hence unusable.
| Quadrant | # 1 sec bins | Bins with >0 counts | Bins with >2000 counts | High rate bins dominated by noise | Noise dominated (total time) | Noise dominated (detector-on time) | Marked lightcurve |
|---|---|---|---|---|---|---|---|
| A | 113487 | 99393 | 0 | 0 | 0.00% | 0.00% | 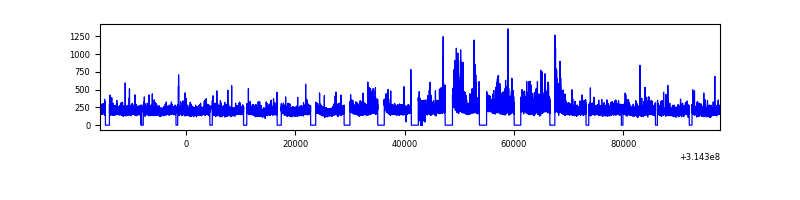 |
| B | 113487 | 99392 | 0 | 0 | 0.00% | 0.00% | 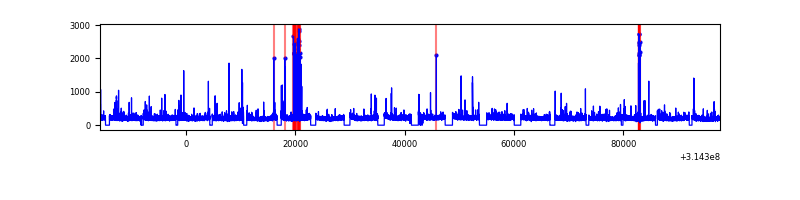 |
| C | 113487 | 99391 | 0 | 0 | 0.00% | 0.00% | 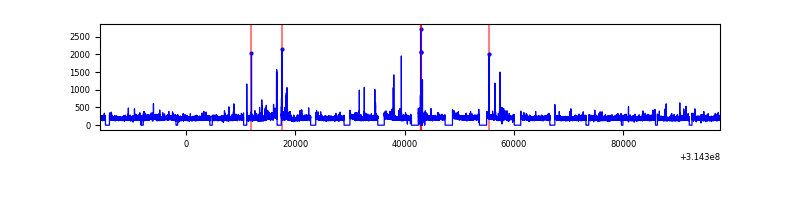 |
| D | 113487 | 99388 | 0 | 0 | 0.00% | 0.00% | 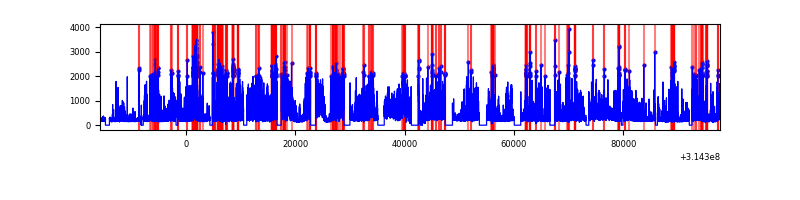 |
Top three noisy pixels from each quadrant. If the there are fewer than three noisy pixels in the level2.evt file, extra rows are filled as -1
| Pixel properties | Quadrant properties | ||||||
|---|---|---|---|---|---|---|---|
| Quadrant | DetID | PixID | Counts | Sigma | Mean | Median | Sigma |
| A | 0 | 29 | 5670 | 11.17 | 1536 | 1445 | 378.1 |
| A | 7 | 110 | 4732 | 8.69 | 1536 | 1445 | 378.1 |
| A | 0 | 30 | 4403 | 7.82 | 1536 | 1445 | 378.1 |
| B | 2 | 9 | 4533 | 10.74 | 1486 | 1425 | 289.4 |
| B | 2 | 8 | 3821 | 8.28 | 1486 | 1425 | 289.4 |
| B | 3 | 17 | 3770 | 8.1 | 1486 | 1425 | 289.4 |
| C | 12 | 241 | 3926 | 6.7 | 1495 | 1403 | 376.7 |
| C | 3 | 126 | 3875 | 6.56 | 1495 | 1403 | 376.7 |
| C | 12 | 250 | 3785 | 6.32 | 1495 | 1403 | 376.7 |
| D | 3 | 14 | 3620 | 6.35 | 1393 | 1270 | 370.3 |
| D | 6 | 231 | 3386 | 5.71 | 1393 | 1270 | 370.3 |
| D | 7 | 3 | 3373 | 5.68 | 1393 | 1270 | 370.3 |
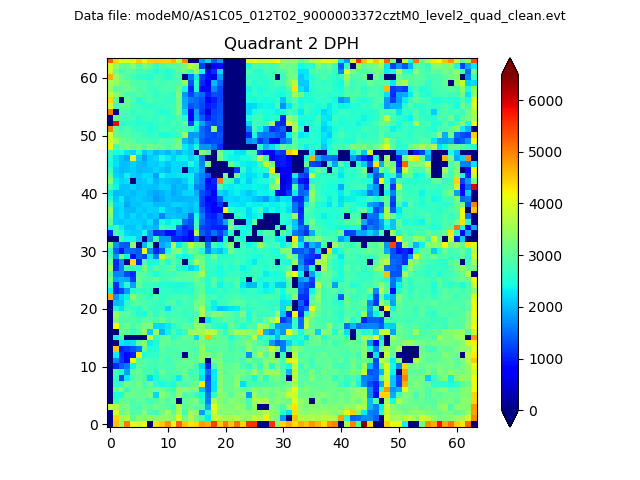
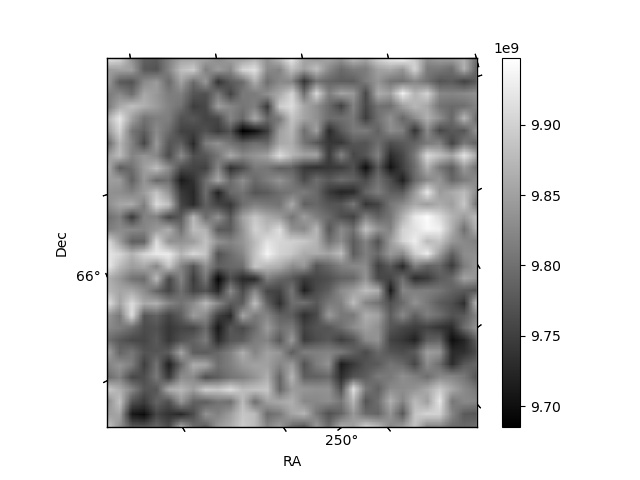
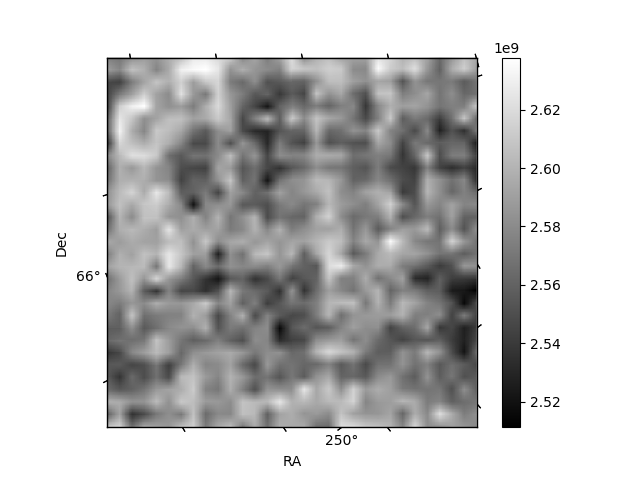
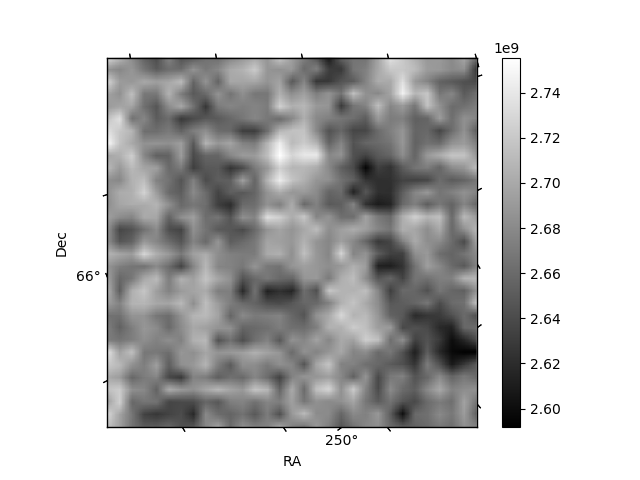
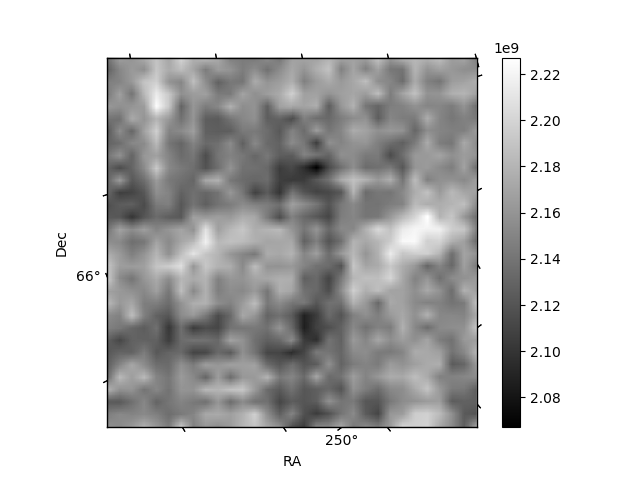
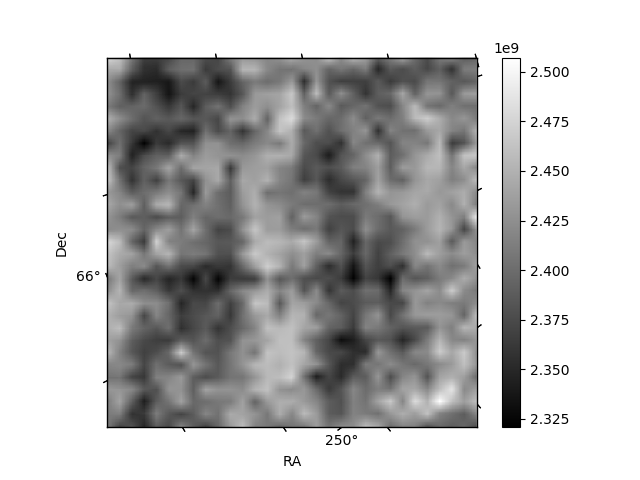
Histogram calculated using DETX and DETY for each event in the final _common_clean file
| Quadrant A | 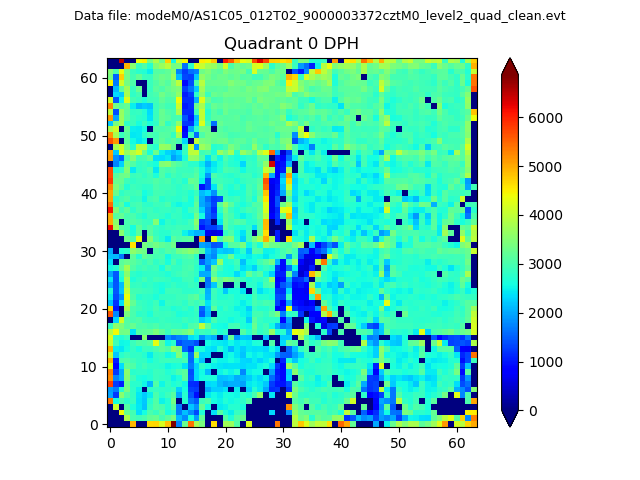 |
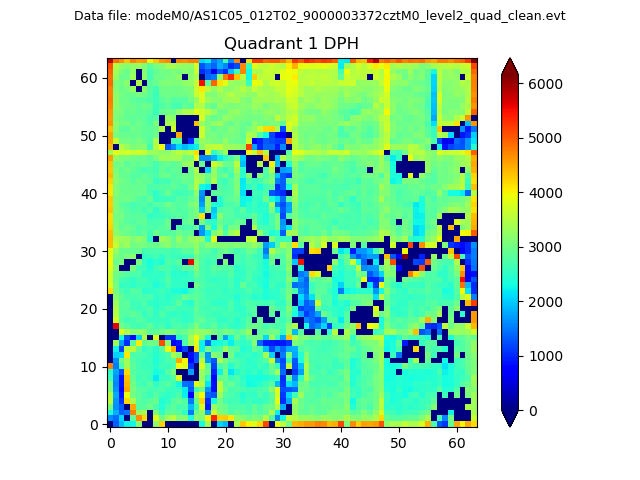 |
Quadrant B |
|---|---|---|---|
| Quadrant D | 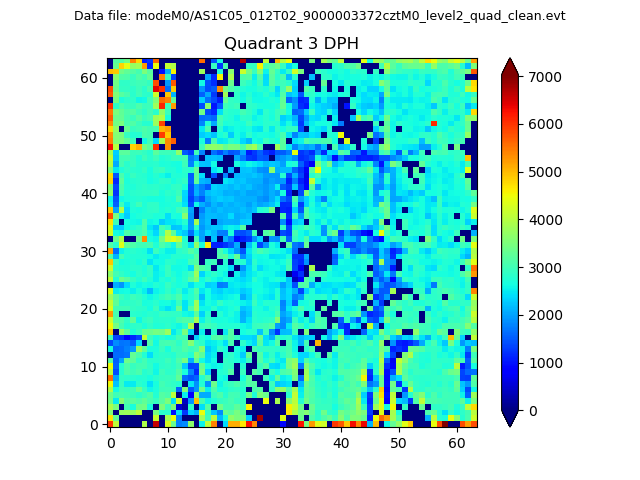 |
 |
Quadrant C |
| Plot type | Count rate plots | Images |
|---|---|---|
| Comparison with Poisson distribution Blue bars denote a histogram of data divided into 1 sec bins. Red curve is a Poisson curve with rate = median count rate of data. |
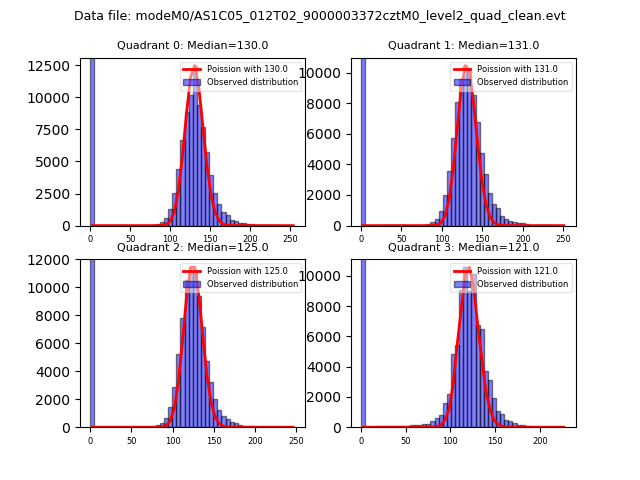 |
 |
| Quadrant-wise count rates Data is divided into 100 sec bins |
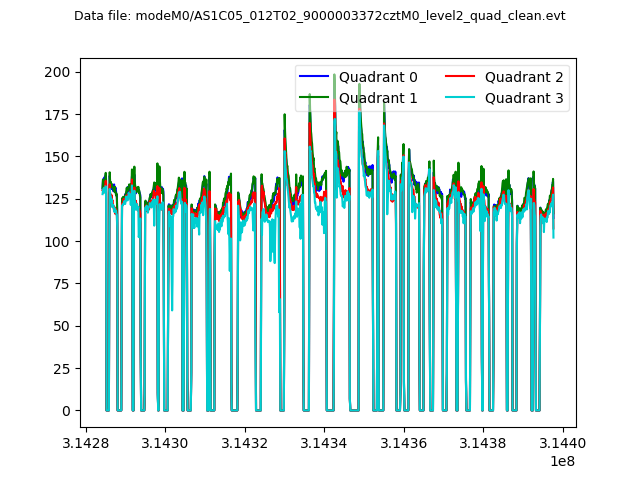 |
|
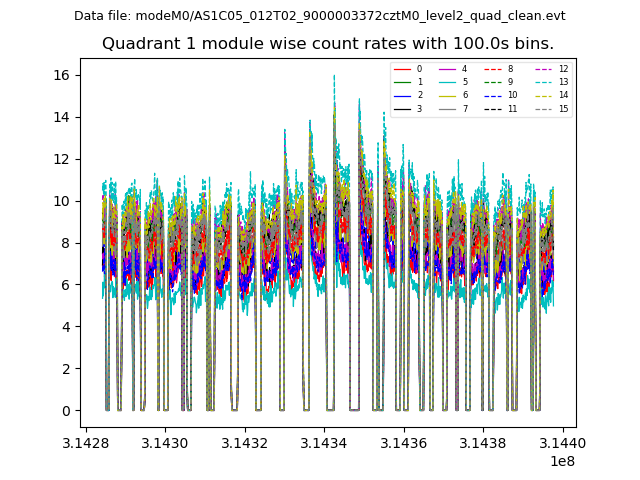
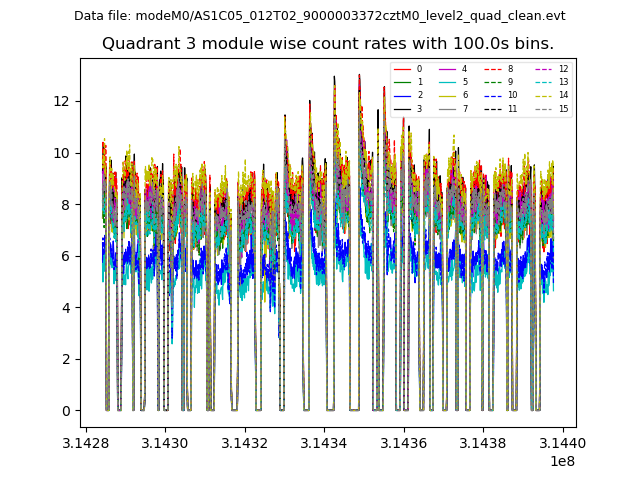
| Module-wise count rates for Quadrant A Data is divided into 100 sec bins |
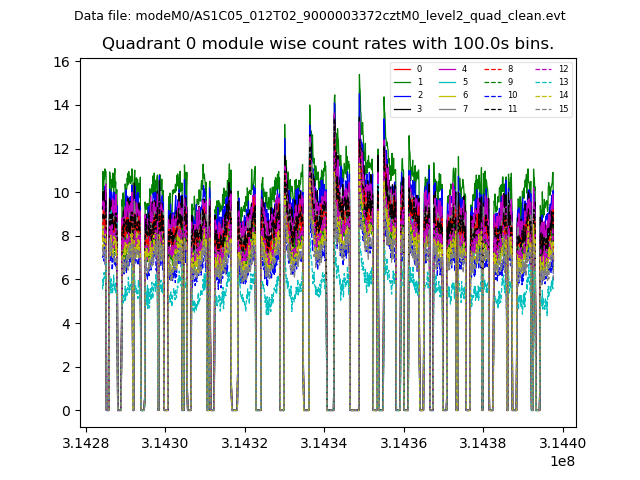 |
 |
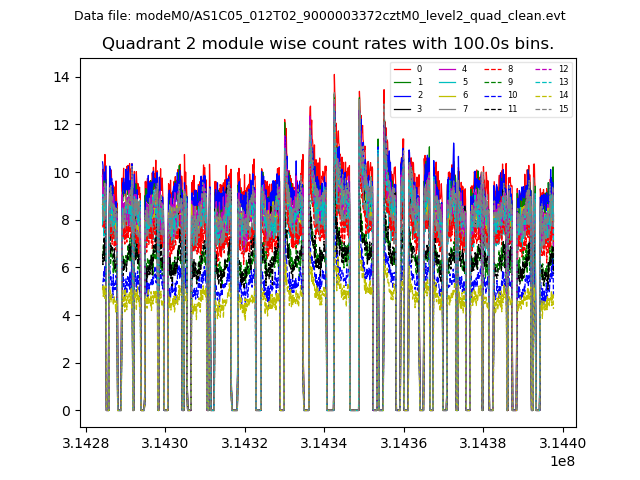
| Module-wise count rates for Quadrant B Data is divided into 100 sec bins |
 |
 |
| Module-wise count rates for Quadrant C Data is divided into 100 sec bins |
 |
 |
| Module-wise count rates for Quadrant D Data is divided into 100 sec bins |
 |
 |
| Parameter | Plot |
|---|---|
| CZT HV Monitor | 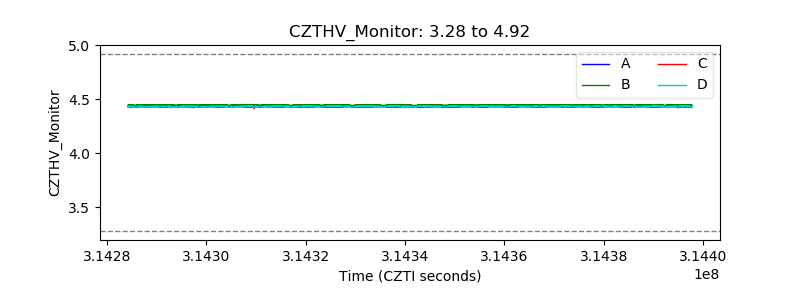 |
| D_VDD | 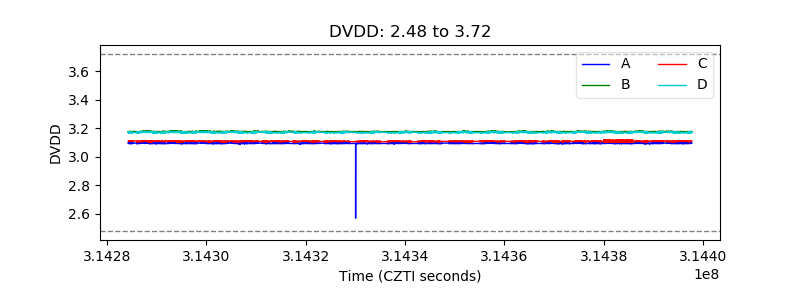 |
| Temperature 1 | 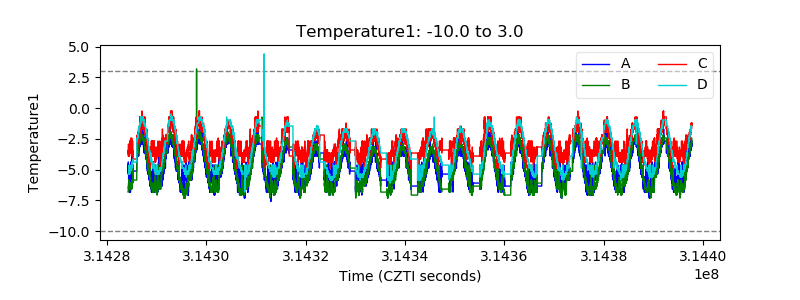 |
| Veto HV Monitor | 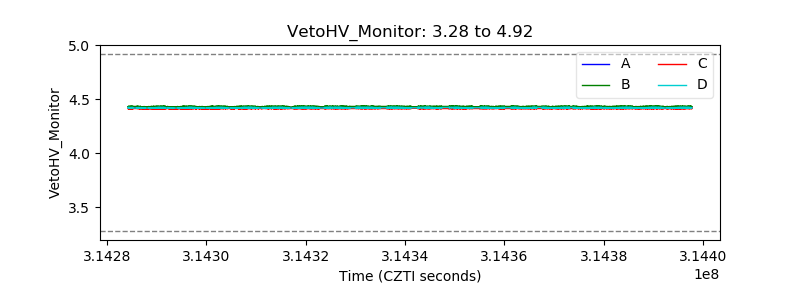 |
| Veto LLD | 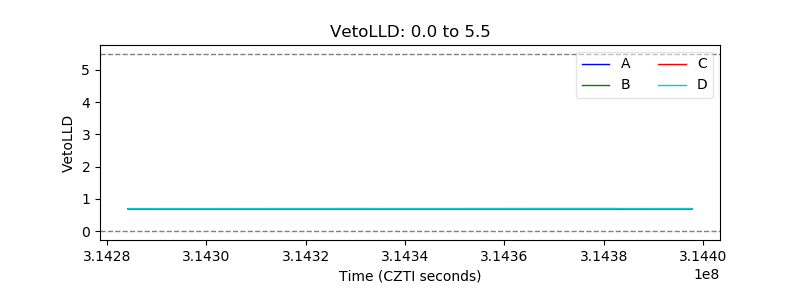 |
| Alpha Counter | 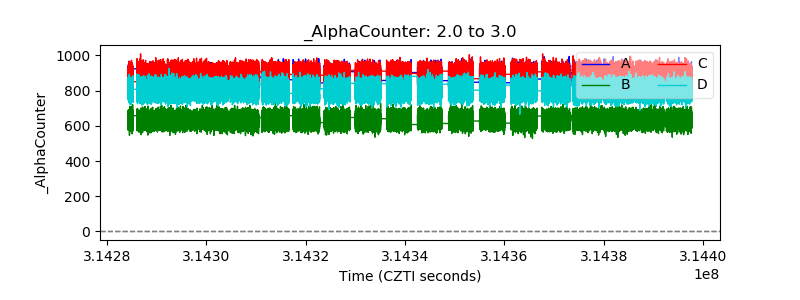 |
| _CPM_Rate | 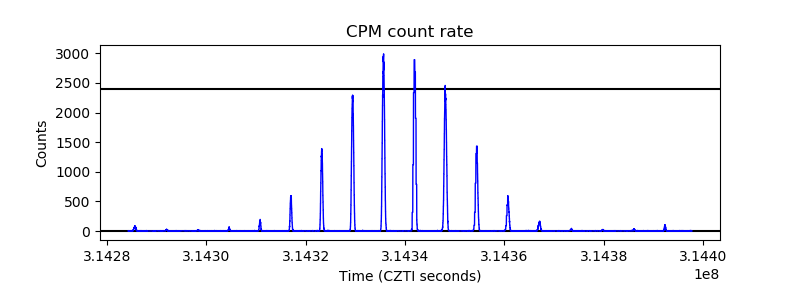 |
| CZT Counter | 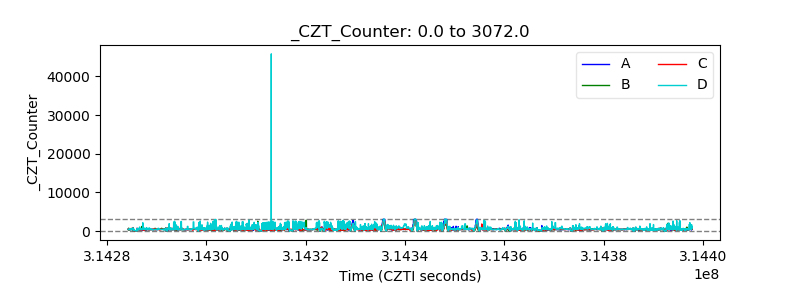 |
| +2.5 Volts monitor | 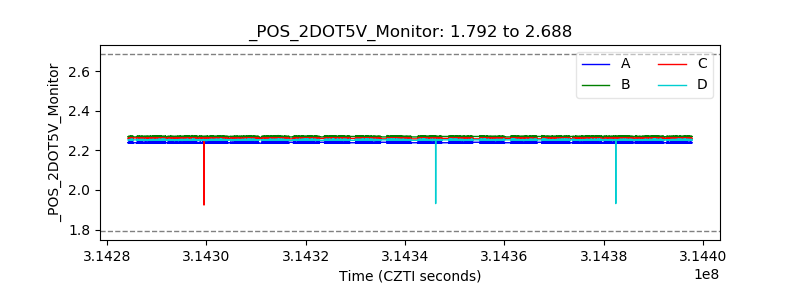 |
| +5 Volts monitor | 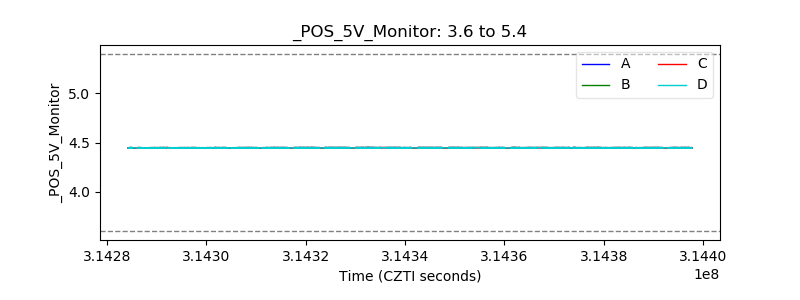 |
| _ROLL_ROT | 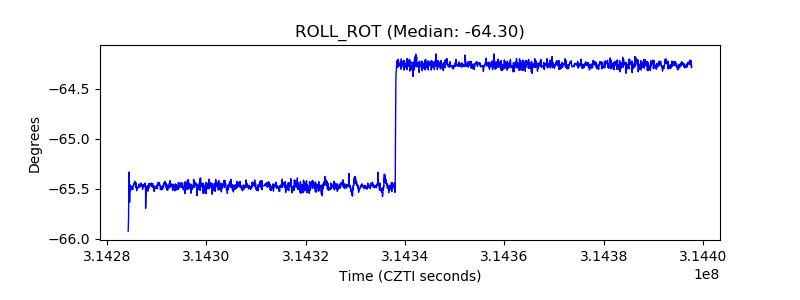 |
| _Roll_DEC | 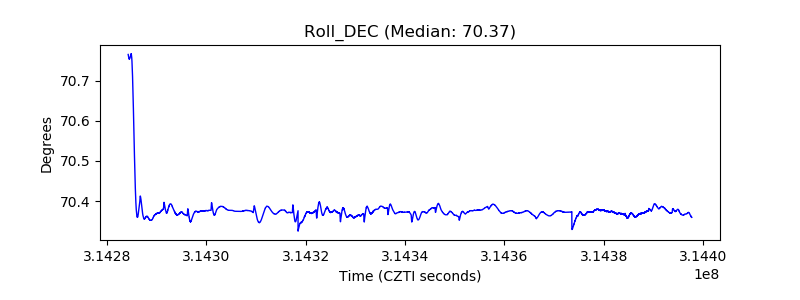 |
| _Roll_RA | 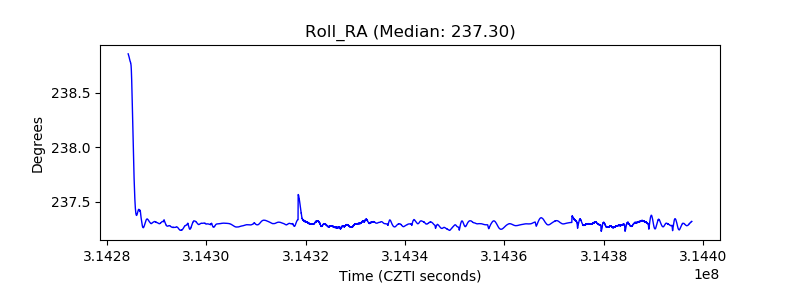 |
| Veto Counter | 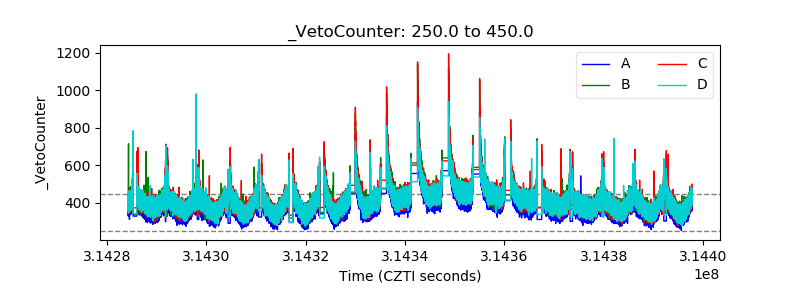 |