| Param | Original file | Final file |
|---|---|---|
| Filename | modeM0/AS1C05_012T02_9000003372_22816cztM0_level2.evt | modeM0/AS1C05_012T02_9000003372_22816cztM0_level2_quad_clean.evt |
| Size (bytes) | 446,866,560 | 110,600,640 |
| Size | 426.2 MB | 105.5 MB |
| Events in quadrant A | 3,109,056 | 739,306 |
| Events in quadrant B | 3,211,214 | 743,885 |
| Events in quadrant C | 3,127,657 | 701,182 |
| Events in quadrant D | 3,627,445 | 695,851 |
| Mode M0 | |||
|---|---|---|---|
| Quadrant | BADHDUFLAG | Total packets | Discarded packets |
| A | 0 | 13727 | 2 |
| B | 0 | 13970 | 2 |
| C | 0 | 13725 | 2 |
| D | 0 | 15218 | 2 |
| Mode M9 | |||
|---|---|---|---|
| Quadrant | BADHDUFLAG | Total packets | Discarded packets |
| A | 0 | 3 | 0 |
| B | 0 | 3 | 0 |
| C | 0 | 3 | 0 |
| D | 0 | 3 | 0 |
| Mode SS | |||
|---|---|---|---|
| Quadrant | BADHDUFLAG | Total packets | Discarded packets |
| A | 0 | 136 | 0 |
| B | 0 | 136 | 0 |
| C | 0 | 136 | 0 |
| D | 0 | 136 | 0 |
| Quadrant | Total seconds | Saturated seconds | Saturation percentage |
|---|---|---|---|
| A | 6736 | 69 | 1.024347% |
| B | 6737 | 83 | 1.232002% |
| C | 6737 | 124 | 1.840582% |
| D | 6737 | 161 | 2.389788% |
Noise dominated data is calculated using 1-second bins in cleaned event files. If a bin has >2000 counts, and if more than 50% of those come from <1% of pixels, then it is considered to be noise-dominated and hence unusable.
| Quadrant | # 1 sec bins | Bins with >0 counts | Bins with >2000 counts | High rate bins dominated by noise | Noise dominated (total time) | Noise dominated (detector-on time) | Marked lightcurve |
|---|---|---|---|---|---|---|---|
| A | 7066 | 6738 | 0 | 0 | 0.00% | 0.00% | 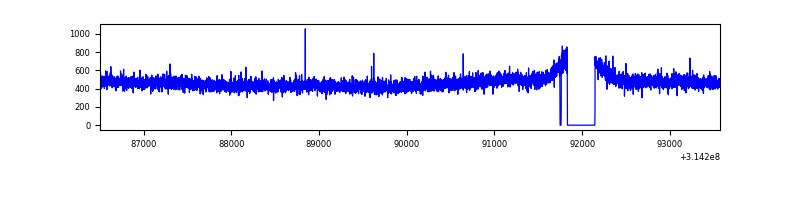 |
| B | 7067 | 6739 | 0 | 0 | 0.00% | 0.00% | 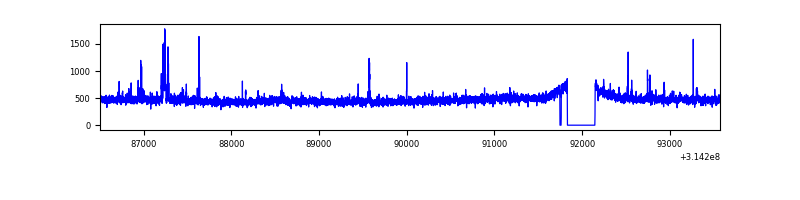 |
| C | 7067 | 6739 | 0 | 0 | 0.00% | 0.00% | 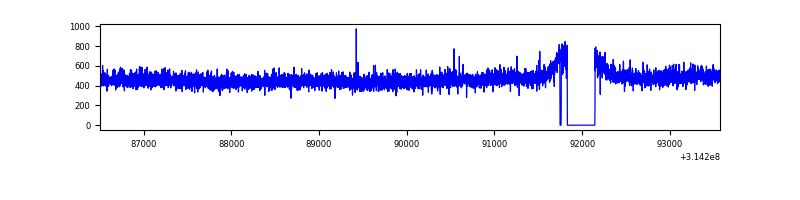 |
| D | 7067 | 6739 | 72 | 72 | 1.02% | 1.07% | 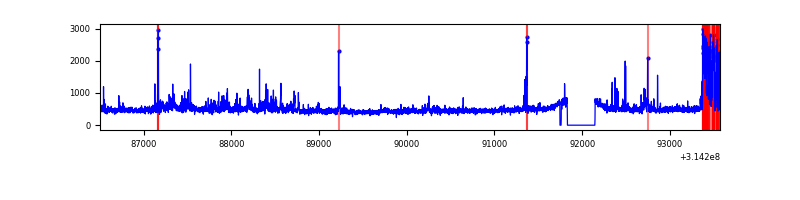 |
Top three noisy pixels from each quadrant. If the there are fewer than three noisy pixels in the level2.evt file, extra rows are filled as -1
| Pixel properties | Quadrant properties | ||||||
|---|---|---|---|---|---|---|---|
| Quadrant | DetID | PixID | Counts | Sigma | Mean | Median | Sigma |
| A | 13 | 254 | 11646 | 67.16 | 805 | 788 | 161.7 |
| A | 0 | 226 | 7008 | 38.47 | 805 | 788 | 161.7 |
| A | 3 | 137 | 6752 | 36.89 | 805 | 788 | 161.7 |
| B | 0 | 190 | 46698 | 303.44 | 795 | 774 | 151.3 |
| B | 0 | 230 | 26769 | 171.76 | 795 | 774 | 151.3 |
| B | 0 | 229 | 19627 | 124.57 | 795 | 774 | 151.3 |
| C | 14 | 238 | 121450 | 681.62 | 764 | 768 | 177.1 |
| C | 0 | 239 | 23164 | 126.49 | 764 | 768 | 177.1 |
| C | 13 | 61 | 5442 | 26.4 | 764 | 768 | 177.1 |
| D | 7 | 238 | 454144 | 2397.51 | 781 | 757 | 189.1 |
| D | 1 | 52 | 64051 | 334.7 | 781 | 757 | 189.1 |
| D | 8 | 195 | 48689 | 253.46 | 781 | 757 | 189.1 |
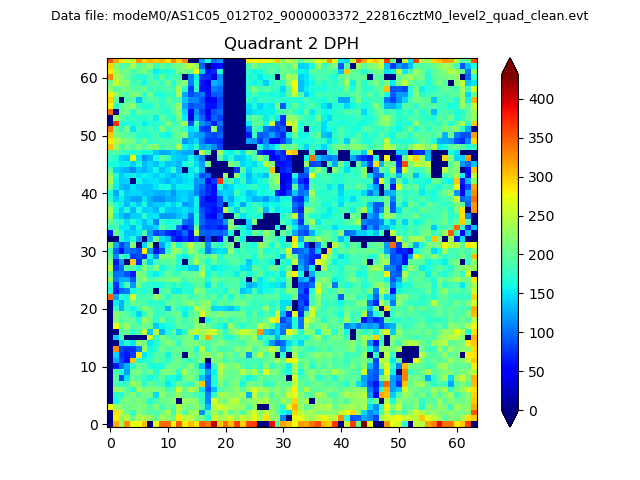
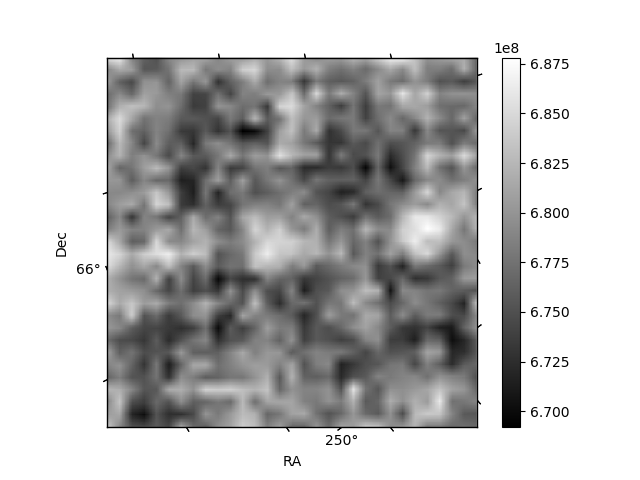
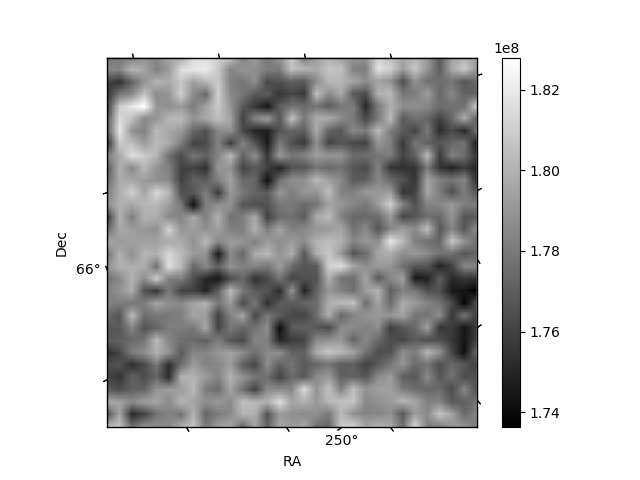
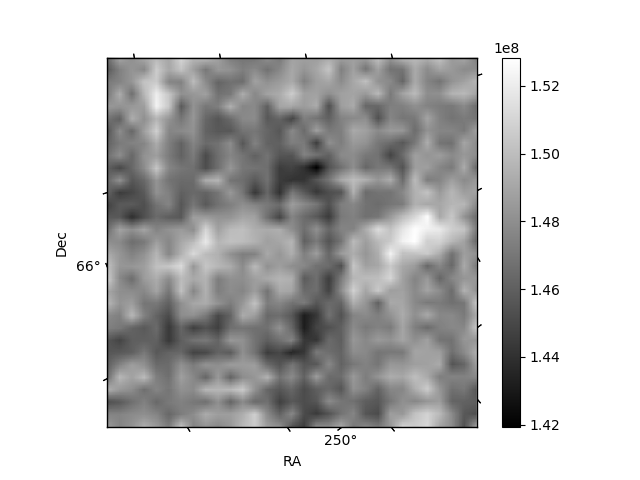
Histogram calculated using DETX and DETY for each event in the final _common_clean file
| Quadrant A | 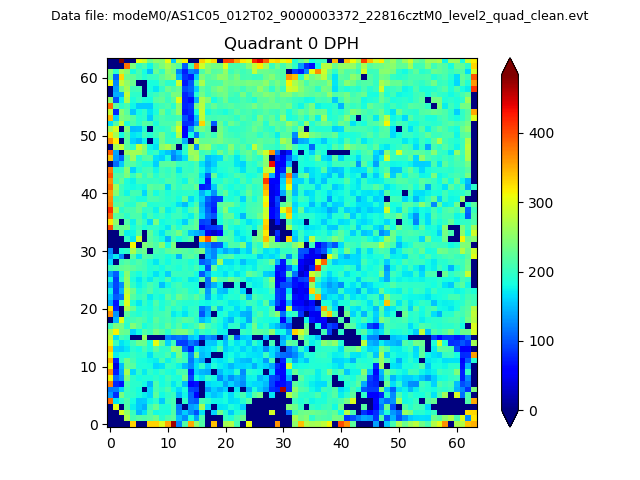 |
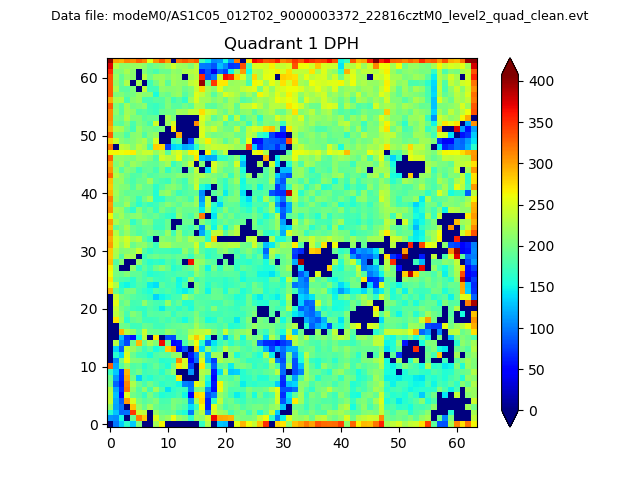 |
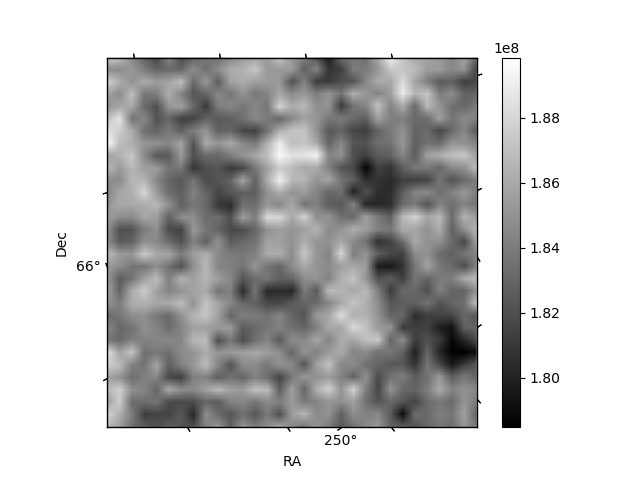
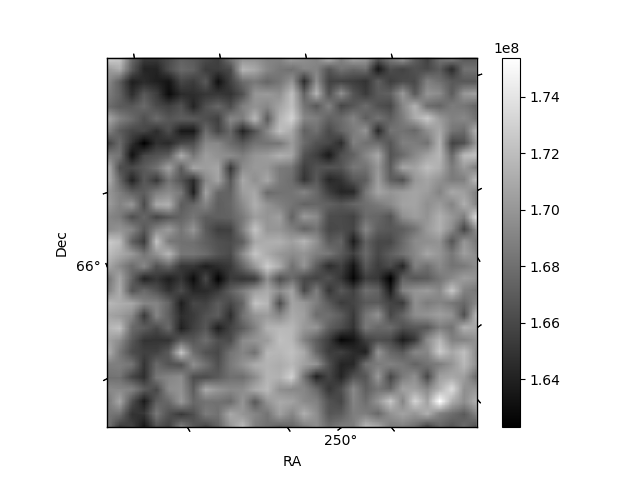
Quadrant B |
|---|---|---|---|
| Quadrant D | 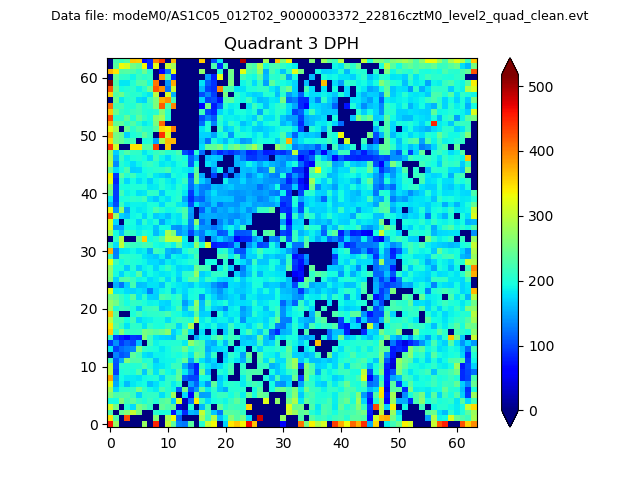 |
 |
Quadrant C |
| Plot type | Count rate plots | Images |
|---|---|---|
| Comparison with Poisson distribution Blue bars denote a histogram of data divided into 1 sec bins. Red curve is a Poisson curve with rate = median count rate of data. |
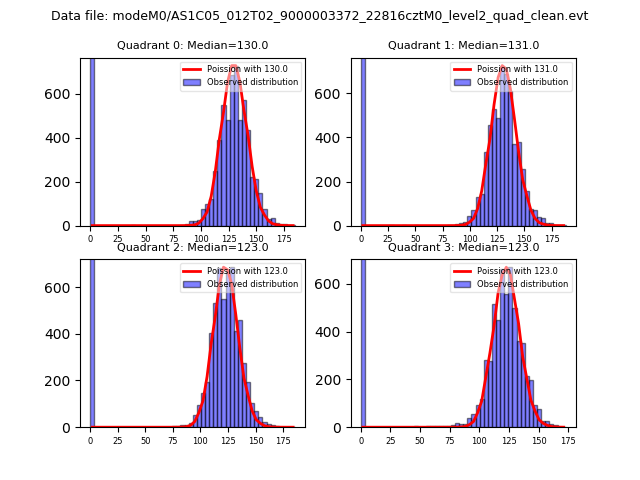 |
 |
| Quadrant-wise count rates Data is divided into 100 sec bins |
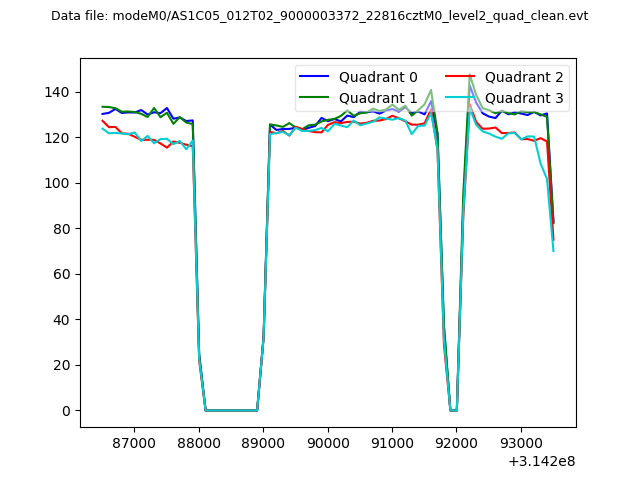 |
|
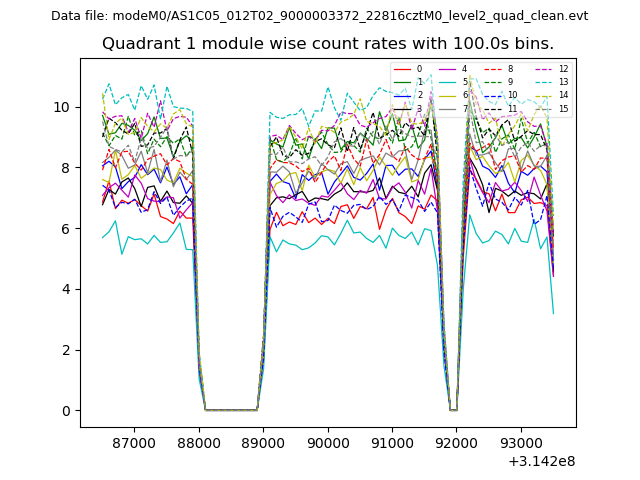
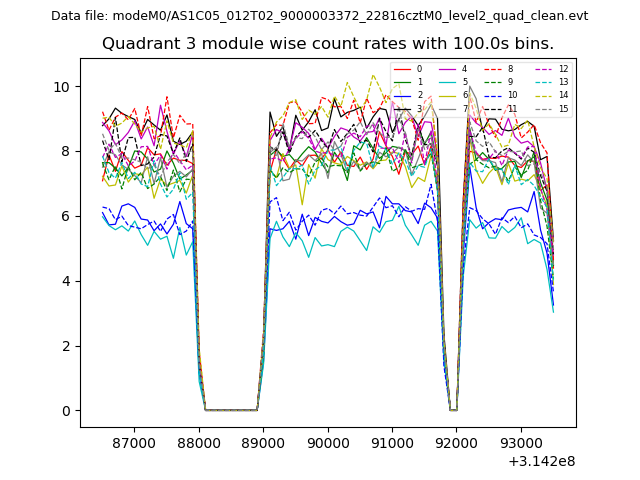
| Module-wise count rates for Quadrant A Data is divided into 100 sec bins |
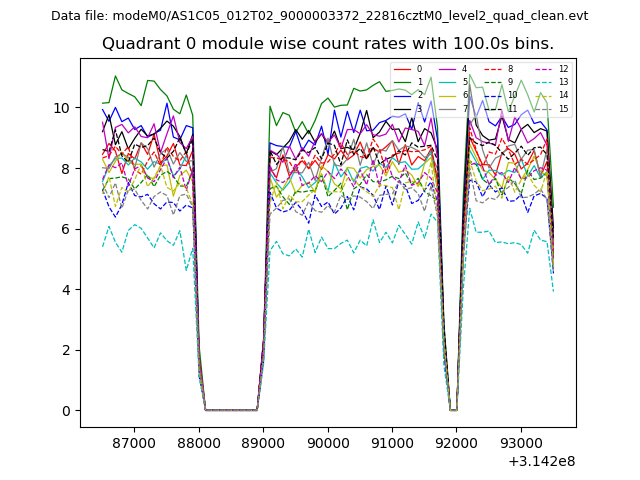 |
 |
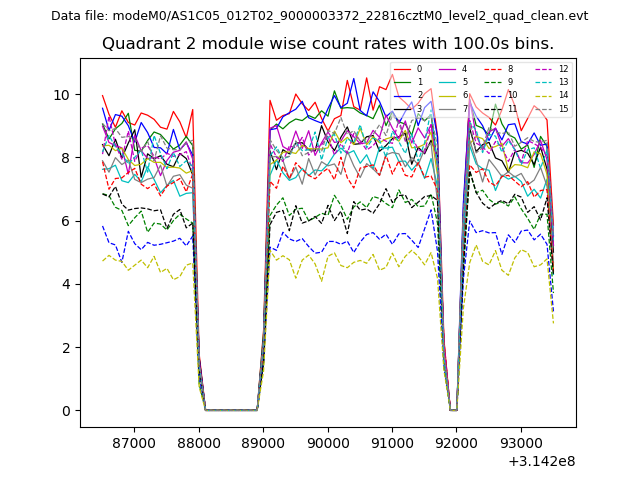
| Module-wise count rates for Quadrant B Data is divided into 100 sec bins |
 |
 |
| Module-wise count rates for Quadrant C Data is divided into 100 sec bins |
 |
 |
| Module-wise count rates for Quadrant D Data is divided into 100 sec bins |
 |
 |
| Parameter | Plot |
|---|---|
| CZT HV Monitor | 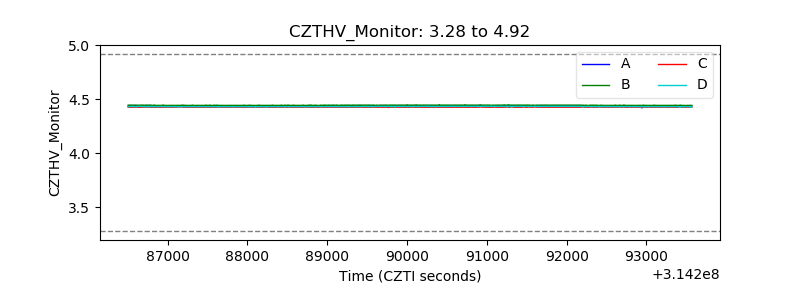 |
| D_VDD | 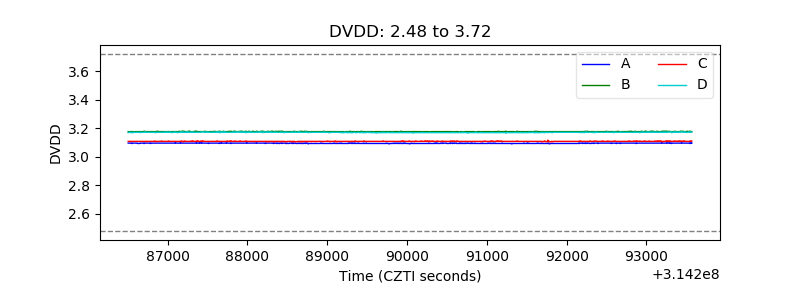 |
| Temperature 1 | 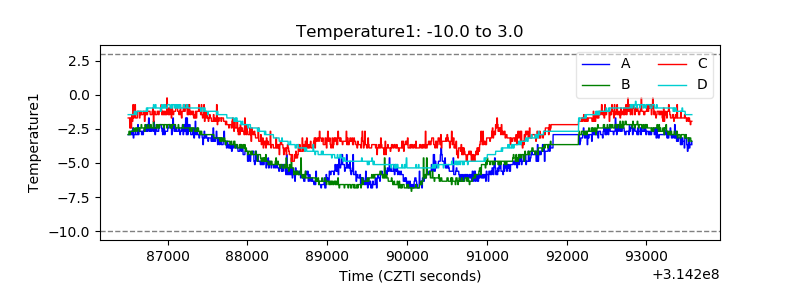 |
| Veto HV Monitor | 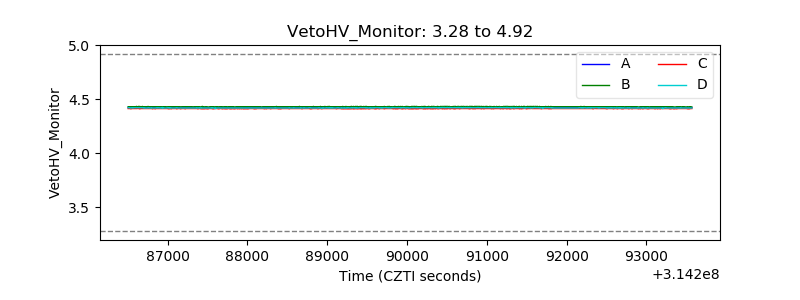 |
| Veto LLD | 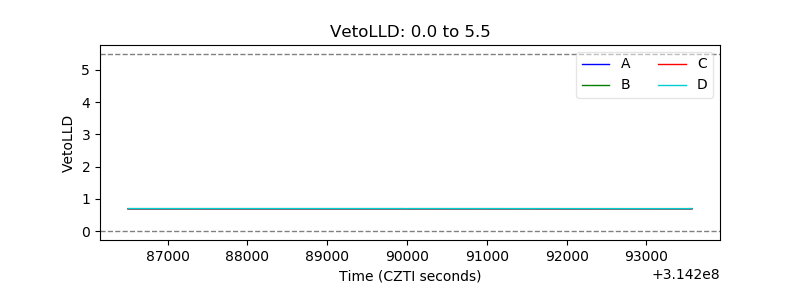 |
| Alpha Counter | 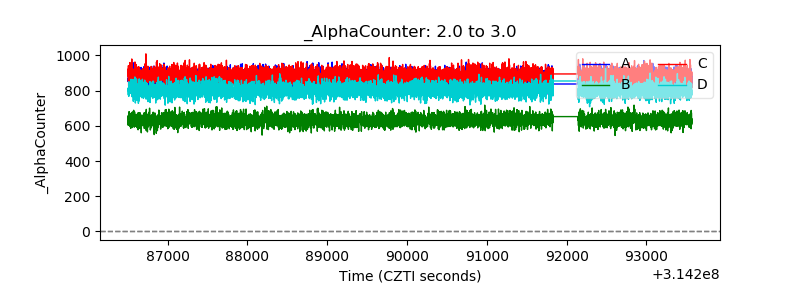 |
| _CPM_Rate | 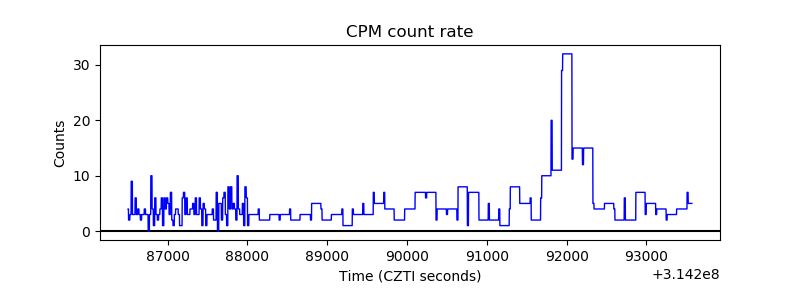 |
| CZT Counter |  |
| +2.5 Volts monitor |  |
| +5 Volts monitor | 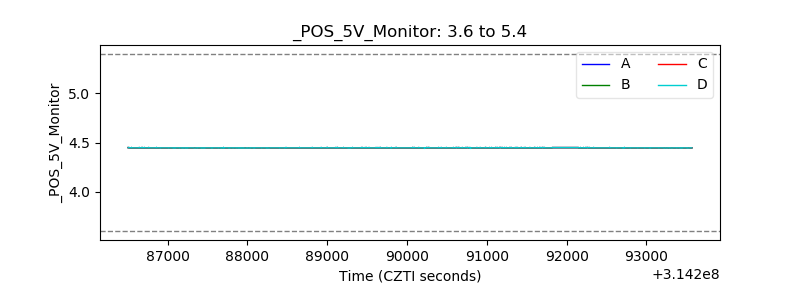 |
| _ROLL_ROT | 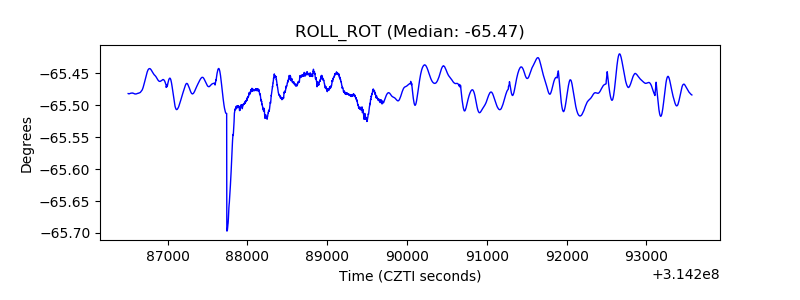 |
| _Roll_DEC | 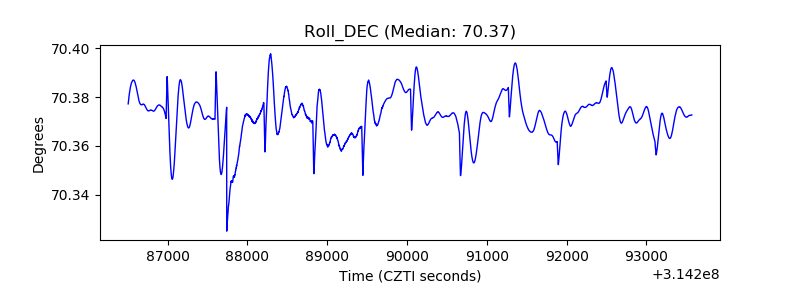 |
| _Roll_RA | 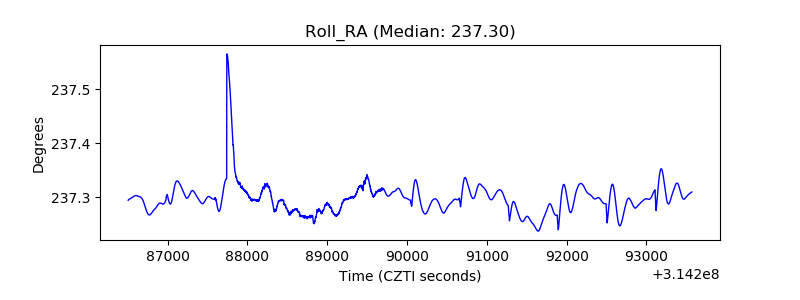 |
| Veto Counter | 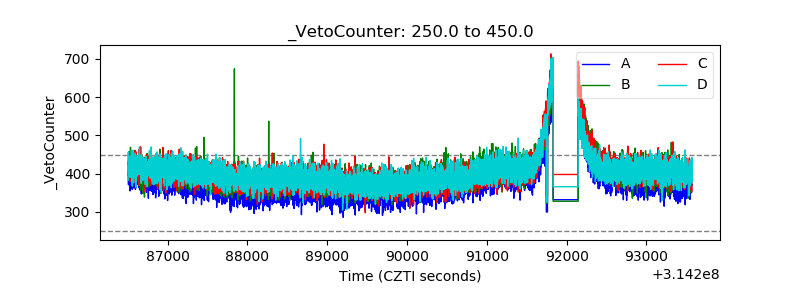 |