| Param | Original file | Final file |
|---|---|---|
| Filename | modeM0/AS1C05_012T02_9000003372_22817cztM0_level2.evt | modeM0/AS1C05_012T02_9000003372_22817cztM0_level2_quad_clean.evt |
| Size (bytes) | 533,306,880 | 115,937,280 |
| Size | 508.6 MB | 110.6 MB |
| Events in quadrant A | 3,439,159 | 769,565 |
| Events in quadrant B | 3,521,609 | 774,036 |
| Events in quadrant C | 3,564,708 | 731,242 |
| Events in quadrant D | 5,117,672 | 715,462 |
| Mode M0 | |||
|---|---|---|---|
| Quadrant | BADHDUFLAG | Total packets | Discarded packets |
| A | 0 | 15174 | 1 |
| B | 0 | 15339 | 1 |
| C | 0 | 15213 | 1 |
| D | 0 | 20223 | 1 |
| Mode M9 | |||
|---|---|---|---|
| Quadrant | BADHDUFLAG | Total packets | Discarded packets |
| A | 0 | 3 | 0 |
| B | 0 | 3 | 0 |
| C | 0 | 3 | 0 |
| D | 0 | 3 | 0 |
| Mode SS | |||
|---|---|---|---|
| Quadrant | BADHDUFLAG | Total packets | Discarded packets |
| A | 0 | 152 | 0 |
| B | 0 | 152 | 0 |
| C | 0 | 152 | 0 |
| D | 0 | 152 | 0 |
| Quadrant | Total seconds | Saturated seconds | Saturation percentage |
|---|---|---|---|
| A | 7484 | 33 | 0.440941% |
| B | 7485 | 47 | 0.627923% |
| C | 7485 | 94 | 1.255845% |
| D | 7485 | 374 | 4.996660% |
Noise dominated data is calculated using 1-second bins in cleaned event files. If a bin has >2000 counts, and if more than 50% of those come from <1% of pixels, then it is considered to be noise-dominated and hence unusable.
| Quadrant | # 1 sec bins | Bins with >0 counts | Bins with >2000 counts | High rate bins dominated by noise | Noise dominated (total time) | Noise dominated (detector-on time) | Marked lightcurve |
|---|---|---|---|---|---|---|---|
| A | 7794 | 7485 | 0 | 0 | 0.00% | 0.00% | 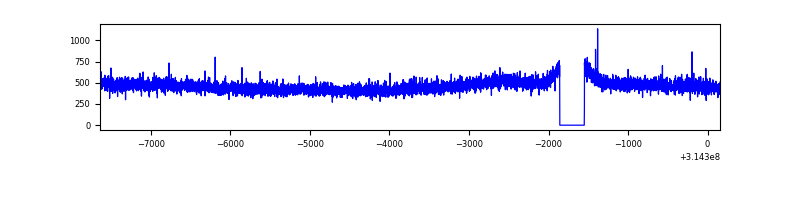 |
| B | 7795 | 7486 | 2 | 2 | 0.03% | 0.03% | 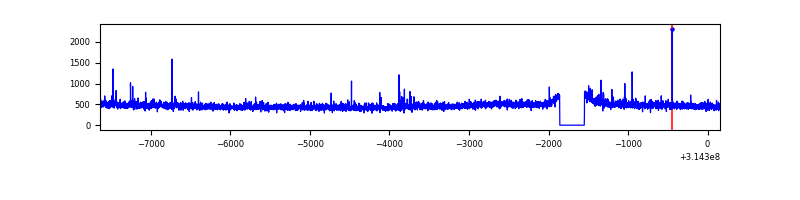 |
| C | 7795 | 7486 | 0 | 0 | 0.00% | 0.00% | 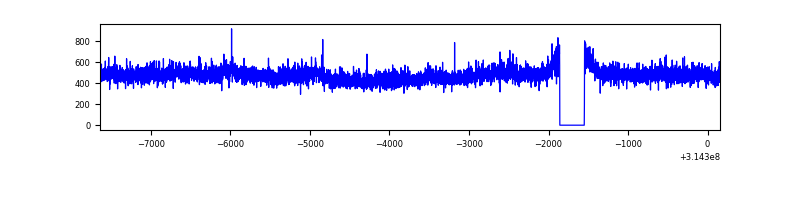 |
| D | 7795 | 7486 | 218 | 218 | 2.80% | 2.91% | 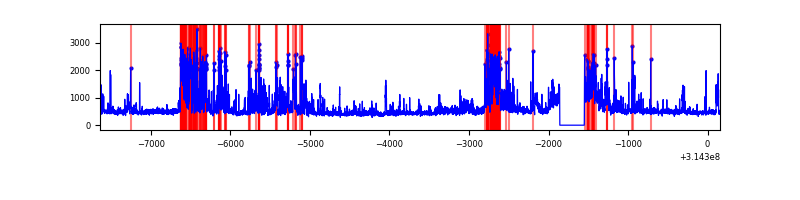 |
Top three noisy pixels from each quadrant. If the there are fewer than three noisy pixels in the level2.evt file, extra rows are filled as -1
| Pixel properties | Quadrant properties | ||||||
|---|---|---|---|---|---|---|---|
| Quadrant | DetID | PixID | Counts | Sigma | Mean | Median | Sigma |
| A | 13 | 254 | 12826 | 66.81 | 891 | 875 | 178.9 |
| A | 0 | 226 | 7762 | 38.5 | 891 | 875 | 178.9 |
| A | 3 | 137 | 7580 | 37.48 | 891 | 875 | 178.9 |
| B | 0 | 190 | 25584 | 146.51 | 882 | 860 | 168.8 |
| B | 12 | 111 | 20261 | 114.96 | 882 | 860 | 168.8 |
| B | 0 | 229 | 19357 | 109.61 | 882 | 860 | 168.8 |
| C | 14 | 238 | 135731 | 691.18 | 848 | 852 | 195.1 |
| C | 0 | 239 | 121005 | 615.72 | 848 | 852 | 195.1 |
| C | 13 | 61 | 5990 | 26.33 | 848 | 852 | 195.1 |
| D | 7 | 238 | 1187328 | 5730.1 | 857 | 829 | 207.1 |
| D | 1 | 52 | 298695 | 1438.52 | 857 | 829 | 207.1 |
| D | 2 | 136 | 185355 | 891.15 | 857 | 829 | 207.1 |
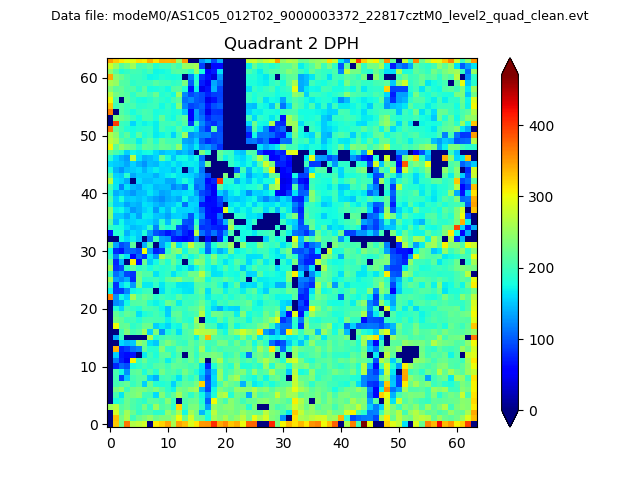
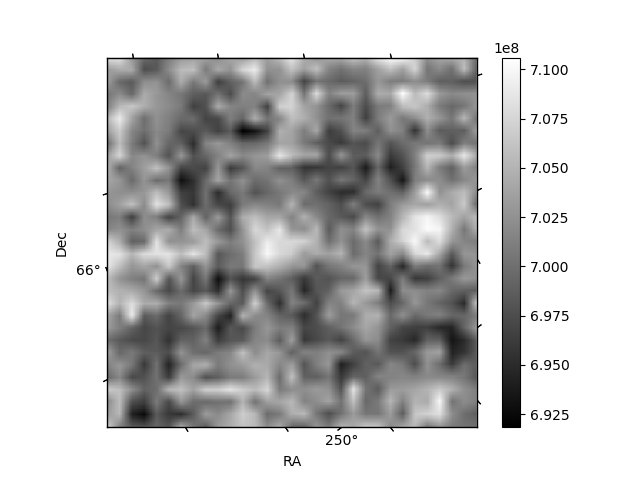
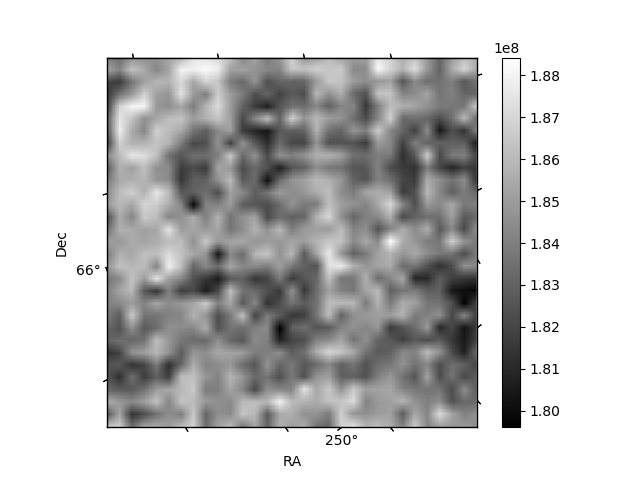
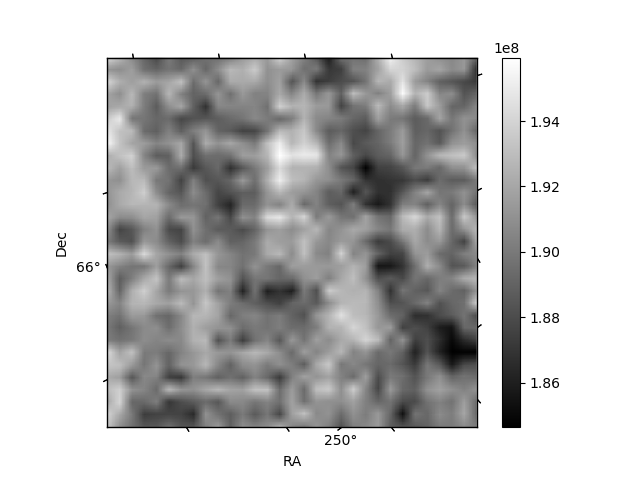
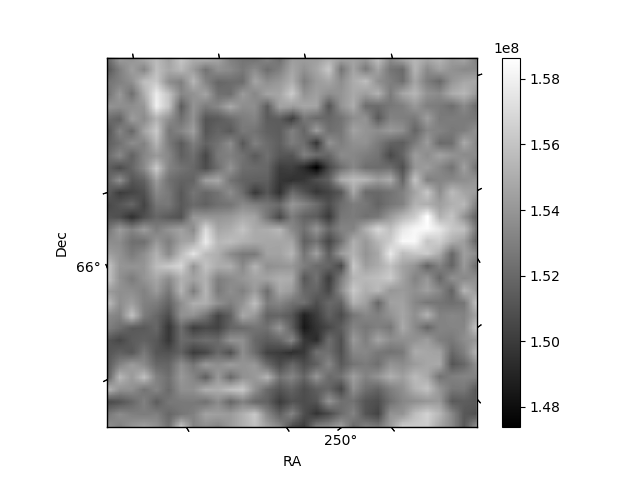
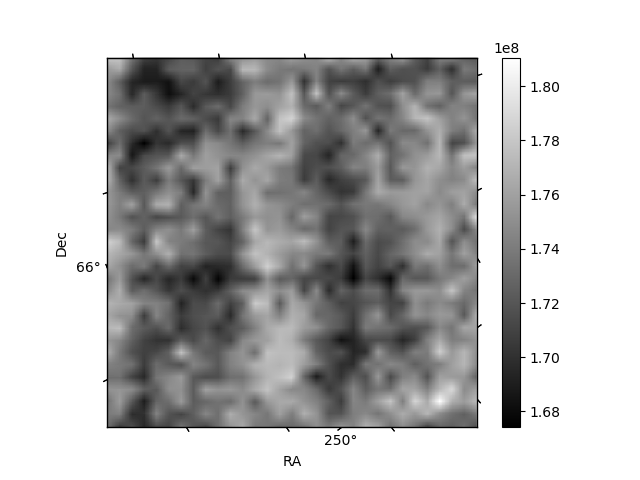
Histogram calculated using DETX and DETY for each event in the final _common_clean file
| Quadrant A | 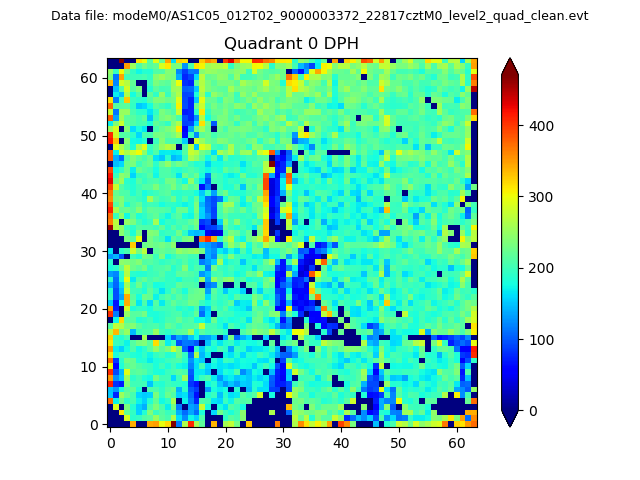 |
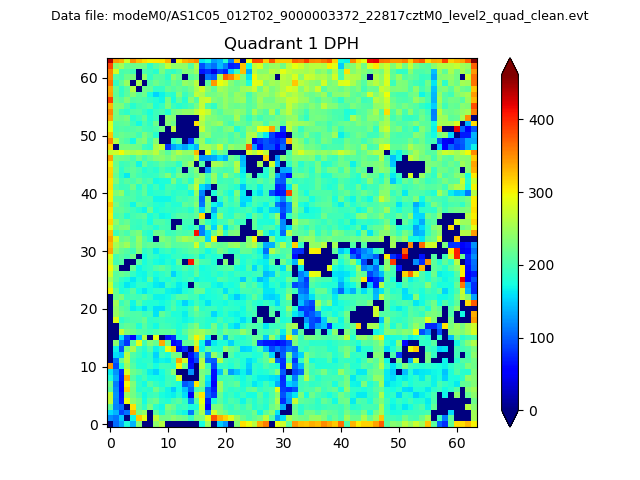 |
Quadrant B |
|---|---|---|---|
| Quadrant D | 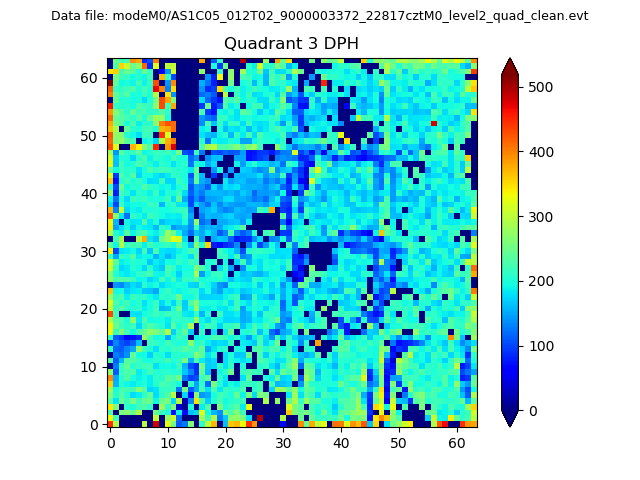 |
 |
Quadrant C |
| Plot type | Count rate plots | Images |
|---|---|---|
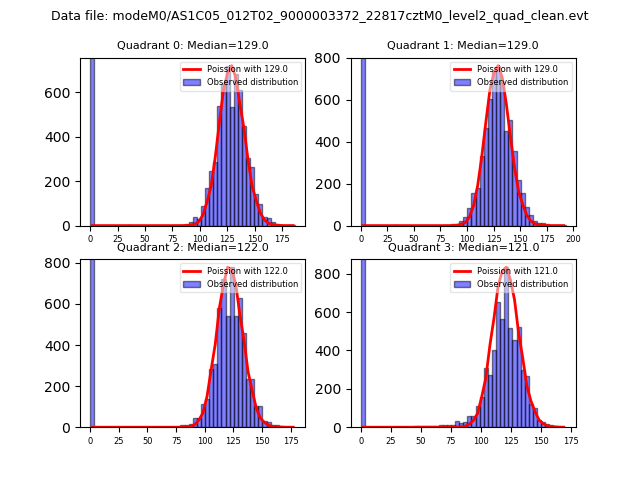
| Comparison with Poisson distribution Blue bars denote a histogram of data divided into 1 sec bins. Red curve is a Poisson curve with rate = median count rate of data. |
 |
 |
| Quadrant-wise count rates Data is divided into 100 sec bins |
 |
|
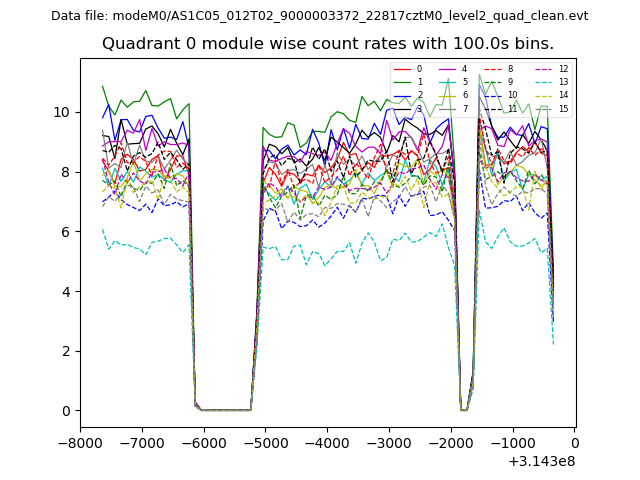
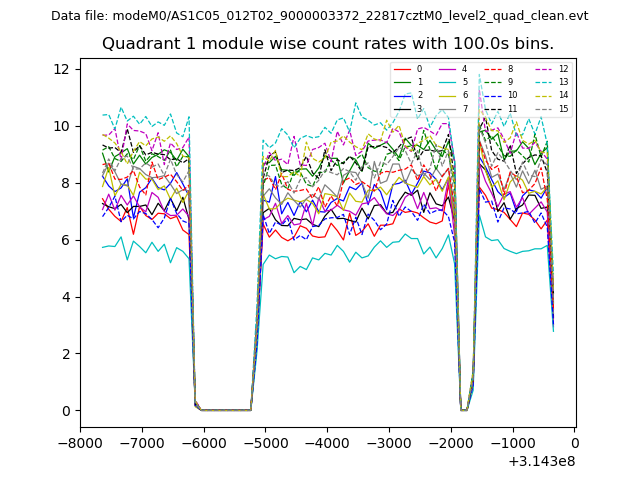
| Module-wise count rates for Quadrant A Data is divided into 100 sec bins |
 |
 |
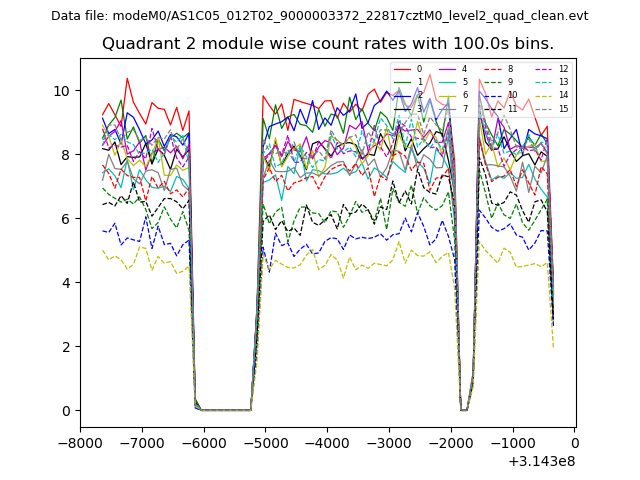
| Module-wise count rates for Quadrant B Data is divided into 100 sec bins |
 |
 |
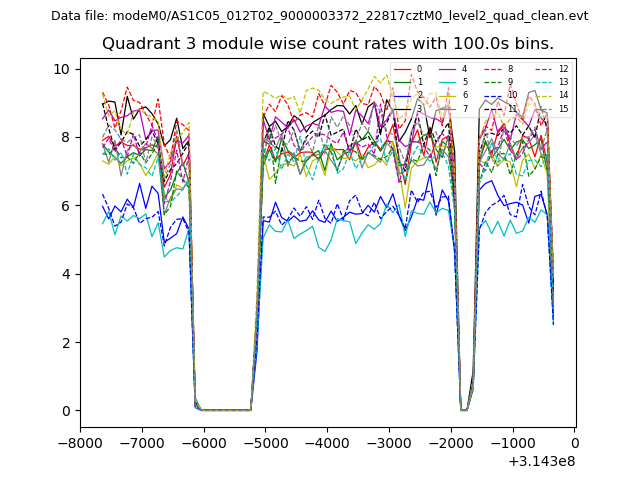
| Module-wise count rates for Quadrant C Data is divided into 100 sec bins |
 |
 |
| Module-wise count rates for Quadrant D Data is divided into 100 sec bins |
 |
 |
| Parameter | Plot |
|---|---|
| CZT HV Monitor | 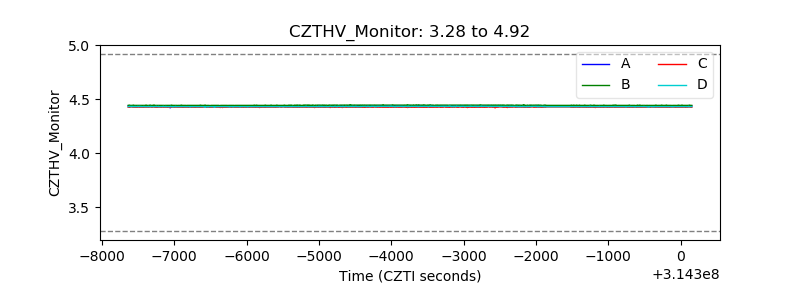 |
| D_VDD | 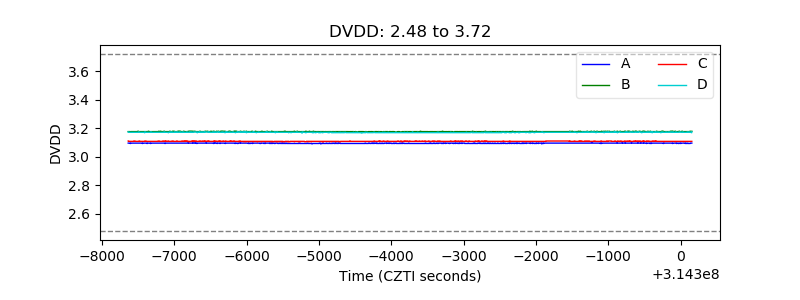 |
| Temperature 1 | 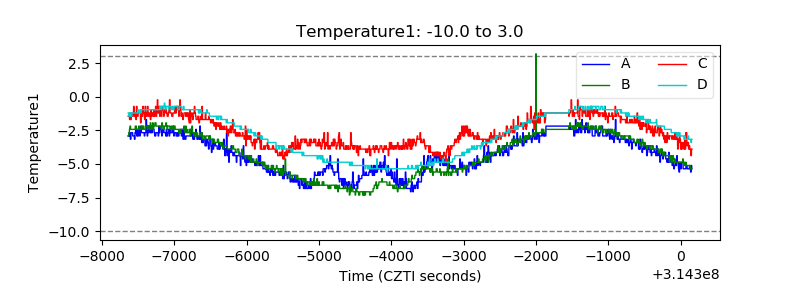 |
| Veto HV Monitor | 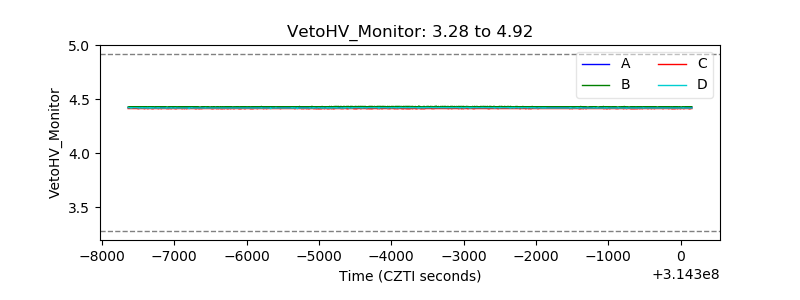 |
| Veto LLD | 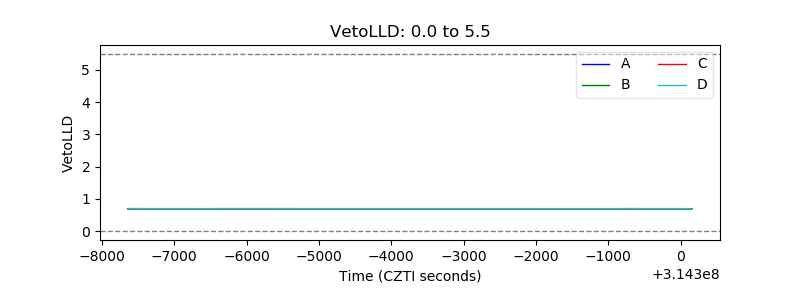 |
| Alpha Counter |  |
| _CPM_Rate | 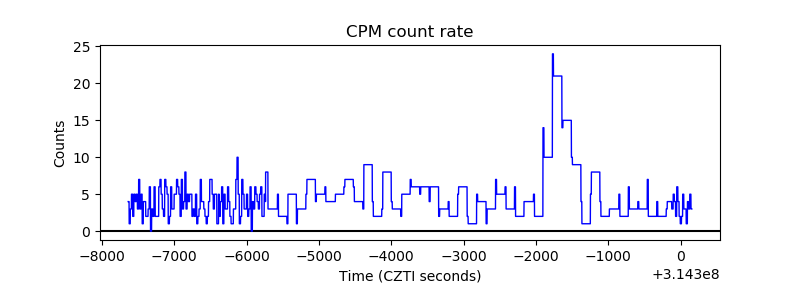 |
| CZT Counter | 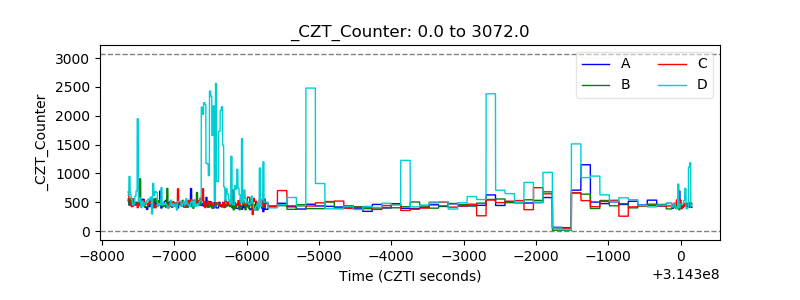 |
| +2.5 Volts monitor |  |
| +5 Volts monitor |  |
| _ROLL_ROT | 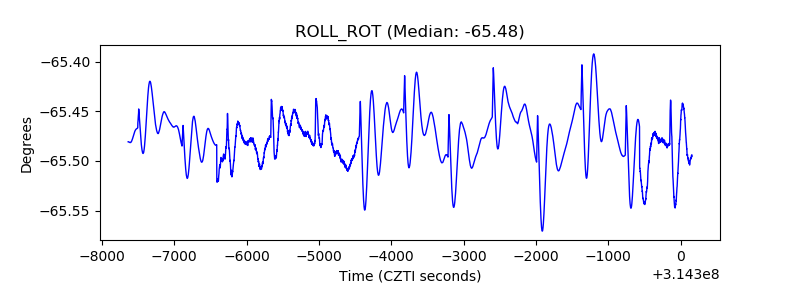 |
| _Roll_DEC | 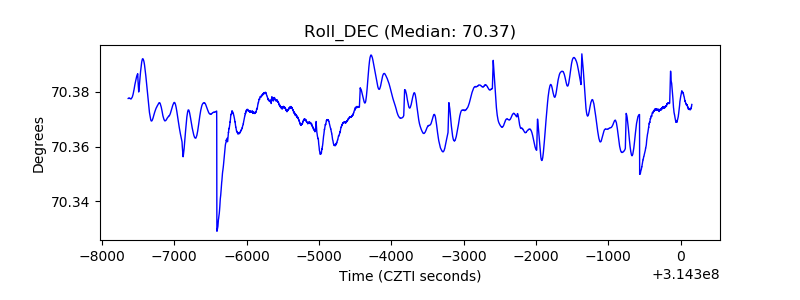 |
| _Roll_RA | 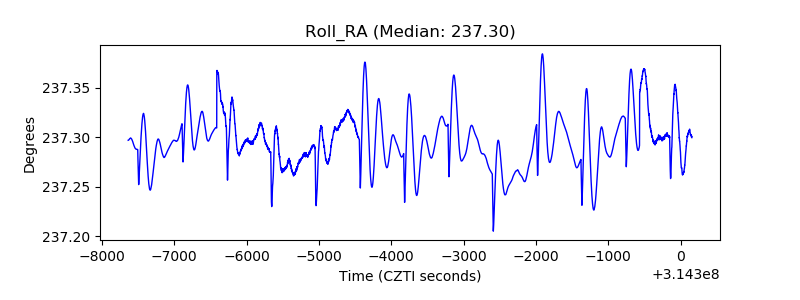 |
| Veto Counter | 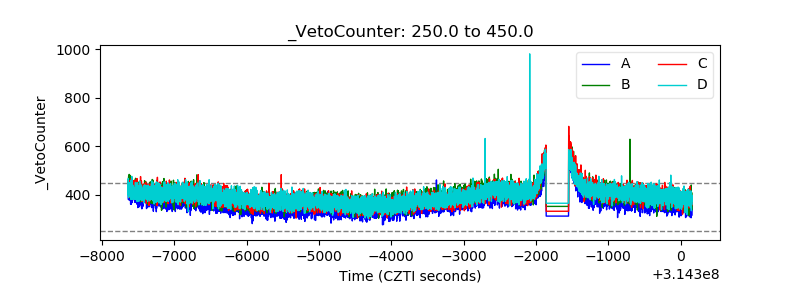 |