| Param | Original file | Final file |
|---|---|---|
| Filename | modeM0/AS1C05_012T02_9000003372_22820cztM0_level2.evt | modeM0/AS1C05_012T02_9000003372_22820cztM0_level2_quad_clean.evt |
| Size (bytes) | 1,429,554,240 | 267,266,880 |
| Size | 1.3 GB | 254.9 MB |
| Events in quadrant A | 8,252,130 | 1,758,855 |
| Events in quadrant B | 8,492,824 | 1,773,899 |
| Events in quadrant C | 8,589,330 | 1,700,687 |
| Events in quadrant D | 16,733,600 | 1,609,416 |
| Mode M0 | |||
|---|---|---|---|
| Quadrant | BADHDUFLAG | Total packets | Discarded packets |
| A | 0 | 36771 | 3 |
| B | 0 | 37303 | 3 |
| C | 0 | 37602 | 3 |
| D | 0 | 62014 | 3 |
| Mode M9 | |||
|---|---|---|---|
| Quadrant | BADHDUFLAG | Total packets | Discarded packets |
| A | 0 | 18 | 0 |
| B | 0 | 18 | 0 |
| C | 0 | 18 | 0 |
| D | 0 | 18 | 0 |
| Mode SS | |||
|---|---|---|---|
| Quadrant | BADHDUFLAG | Total packets | Discarded packets |
| A | 0 | 370 | 0 |
| B | 0 | 370 | 0 |
| C | 0 | 370 | 0 |
| D | 0 | 370 | 0 |
| Quadrant | Total seconds | Saturated seconds | Saturation percentage |
|---|---|---|---|
| A | 18163 | 51 | 0.280791% |
| B | 18163 | 109 | 0.600121% |
| C | 18163 | 220 | 1.211254% |
| D | 18164 | 1779 | 9.794098% |
Noise dominated data is calculated using 1-second bins in cleaned event files. If a bin has >2000 counts, and if more than 50% of those come from <1% of pixels, then it is considered to be noise-dominated and hence unusable.
| Quadrant | # 1 sec bins | Bins with >0 counts | Bins with >2000 counts | High rate bins dominated by noise | Noise dominated (total time) | Noise dominated (detector-on time) | Marked lightcurve |
|---|---|---|---|---|---|---|---|
| A | 19958 | 18166 | 0 | 0 | 0.00% | 0.00% | 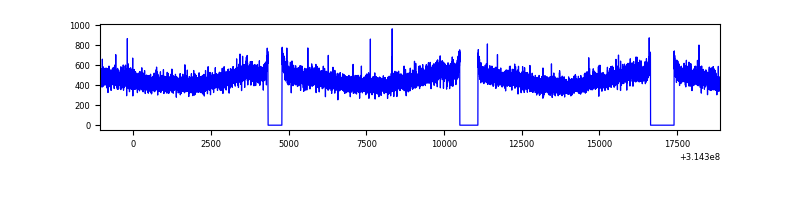 |
| B | 19958 | 18166 | 14 | 14 | 0.07% | 0.08% | 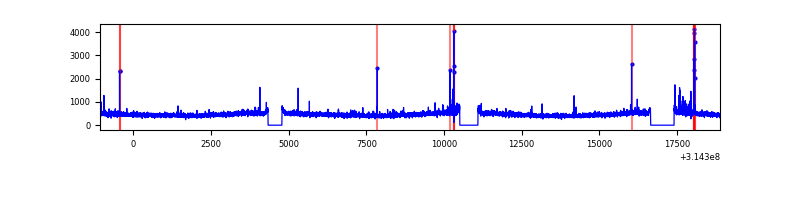 |
| C | 19958 | 18166 | 3 | 3 | 0.02% | 0.02% | 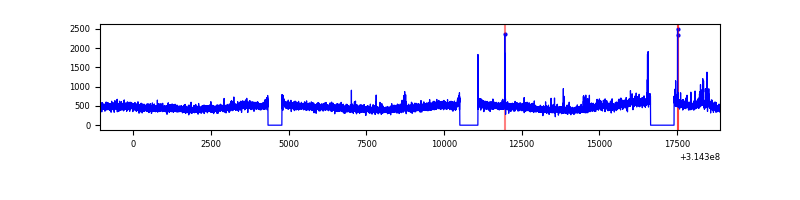 |
| D | 19959 | 18167 | 1418 | 1418 | 7.10% | 7.81% | 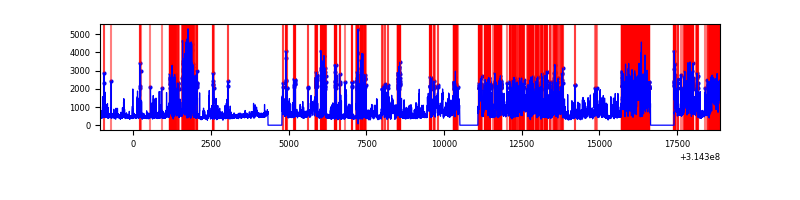 |
Top three noisy pixels from each quadrant. If the there are fewer than three noisy pixels in the level2.evt file, extra rows are filled as -1
| Pixel properties | Quadrant properties | ||||||
|---|---|---|---|---|---|---|---|
| Quadrant | DetID | PixID | Counts | Sigma | Mean | Median | Sigma |
| A | 13 | 254 | 32324 | 70.71 | 2137 | 2091 | 427.5 |
| A | 3 | 137 | 18741 | 38.94 | 2137 | 2091 | 427.5 |
| A | 0 | 226 | 18309 | 37.93 | 2137 | 2091 | 427.5 |
| B | 0 | 229 | 66326 | 161.39 | 2119 | 2066 | 398.2 |
| B | 12 | 111 | 49673 | 119.56 | 2119 | 2066 | 398.2 |
| B | 11 | 111 | 44214 | 105.85 | 2119 | 2066 | 398.2 |
| C | 14 | 238 | 324636 | 679.52 | 2049 | 2059 | 474.7 |
| C | 0 | 239 | 154797 | 321.75 | 2049 | 2059 | 474.7 |
| C | 2 | 16 | 119743 | 247.9 | 2049 | 2059 | 474.7 |
| D | 7 | 238 | 7085068 | 14478.45 | 2024 | 1965 | 489.2 |
| D | 1 | 52 | 1565572 | 3196.14 | 2024 | 1965 | 489.2 |
| D | 10 | 230 | 132482 | 266.79 | 2024 | 1965 | 489.2 |
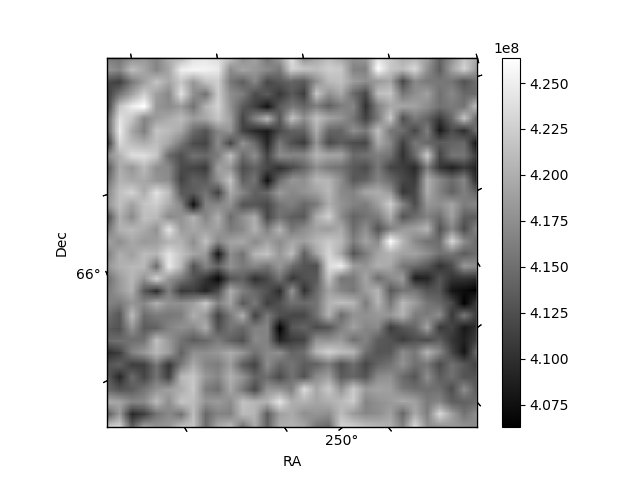
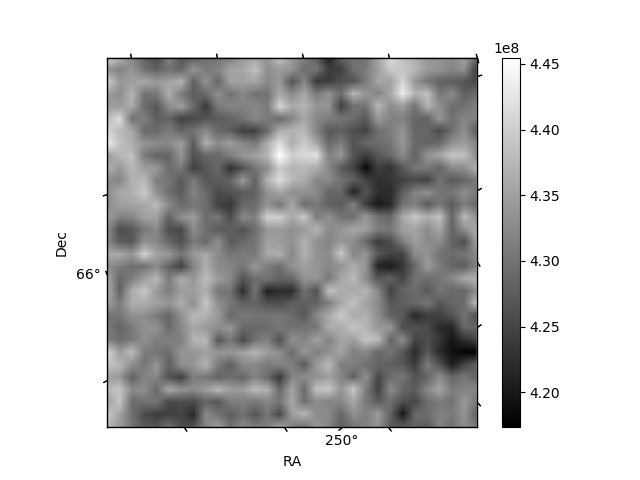
Histogram calculated using DETX and DETY for each event in the final _common_clean file
| Quadrant A | 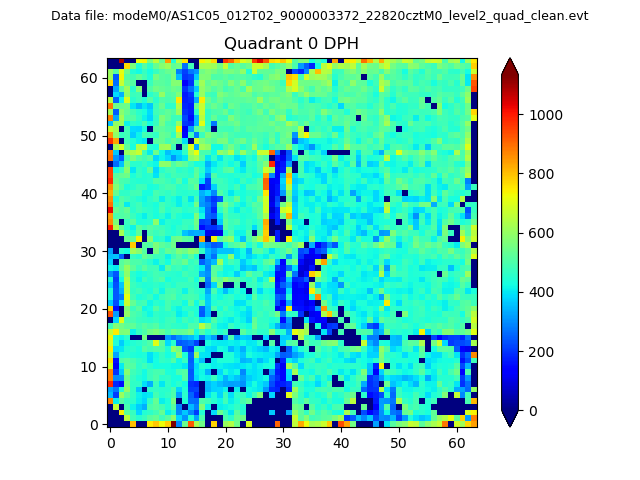 |
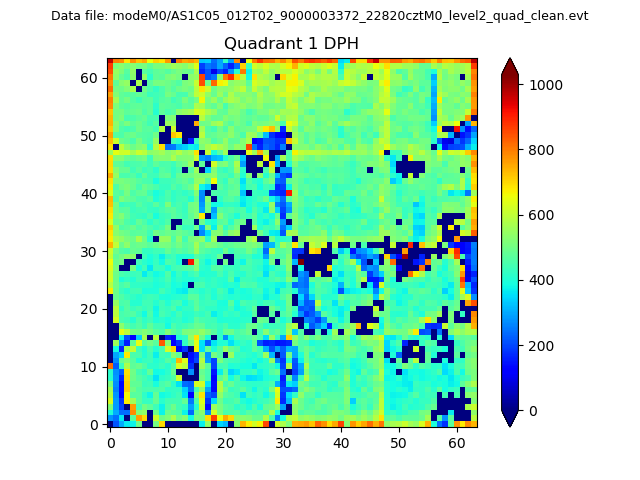 |
Quadrant B |
|---|---|---|---|
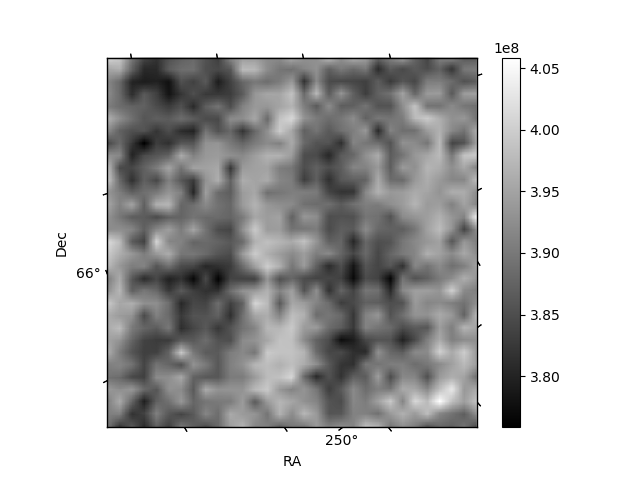
| Quadrant D | 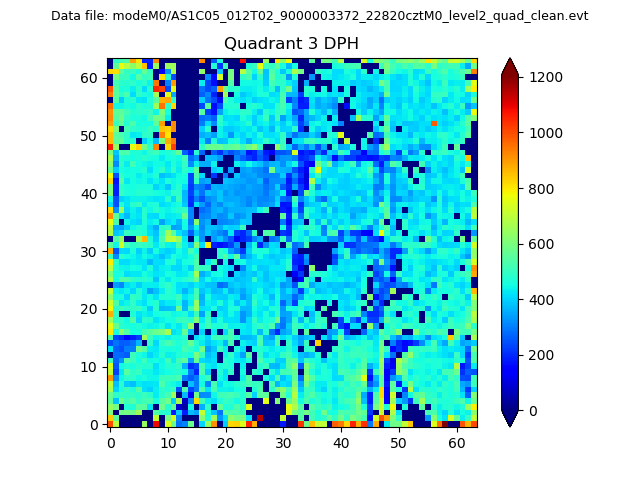 |
 |
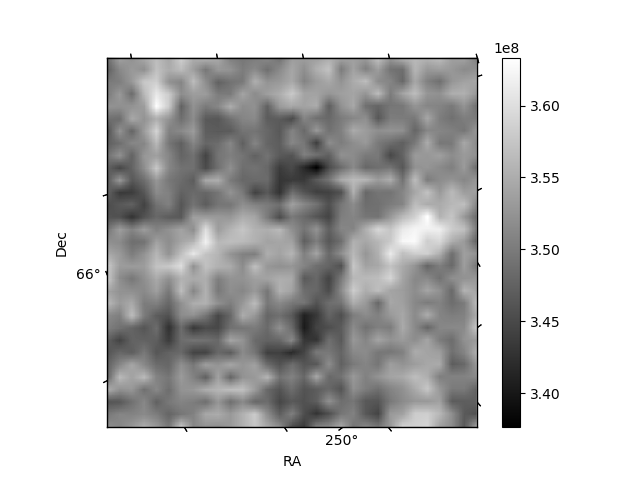
Quadrant C |
| Plot type | Count rate plots | Images |
|---|---|---|
| Comparison with Poisson distribution Blue bars denote a histogram of data divided into 1 sec bins. Red curve is a Poisson curve with rate = median count rate of data. |
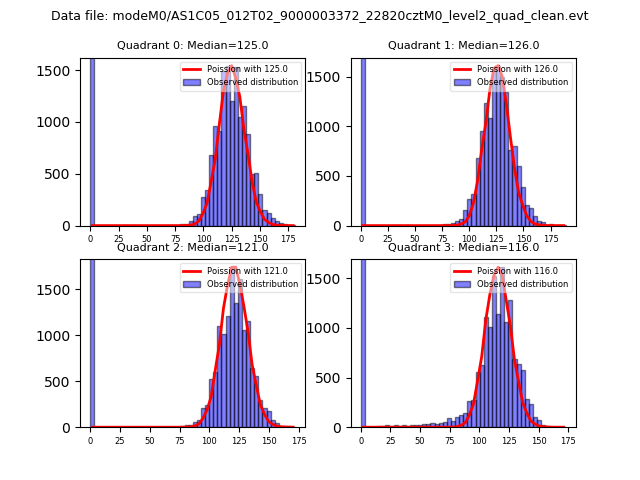 |
 |
| Quadrant-wise count rates Data is divided into 100 sec bins |
 |
|
| Module-wise count rates for Quadrant A Data is divided into 100 sec bins |
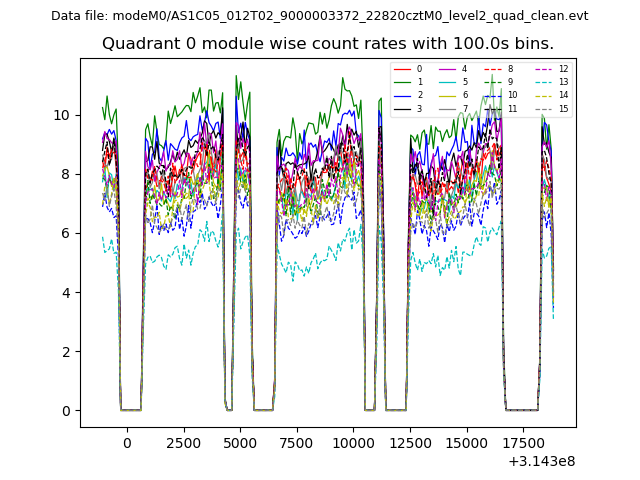 |
 |
| Module-wise count rates for Quadrant B Data is divided into 100 sec bins |
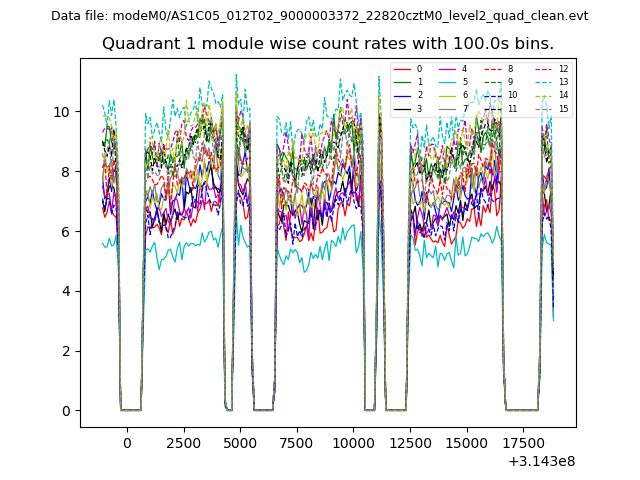 |
 |
| Module-wise count rates for Quadrant C Data is divided into 100 sec bins |
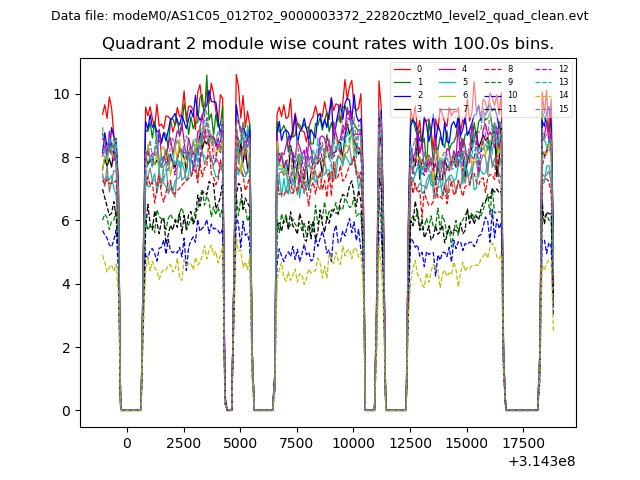 |
 |
| Module-wise count rates for Quadrant D Data is divided into 100 sec bins |
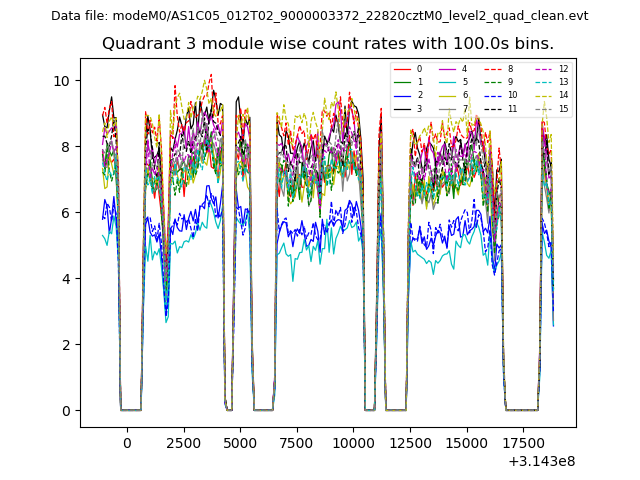 |
 |
| Parameter | Plot |
|---|---|
| CZT HV Monitor | 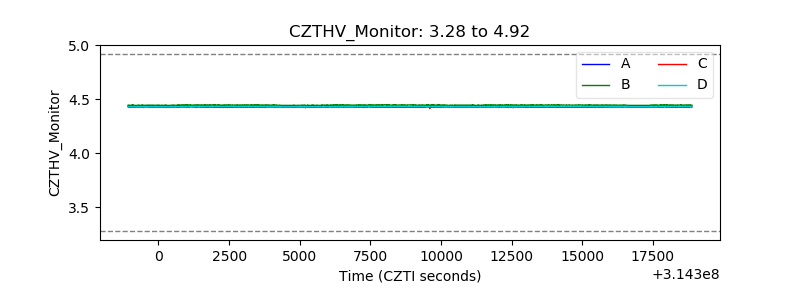 |
| D_VDD | 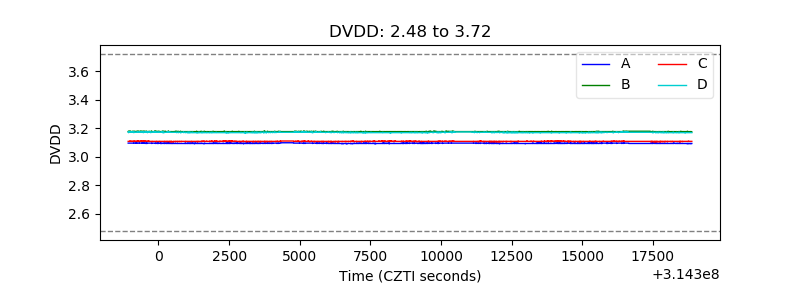 |
| Temperature 1 | 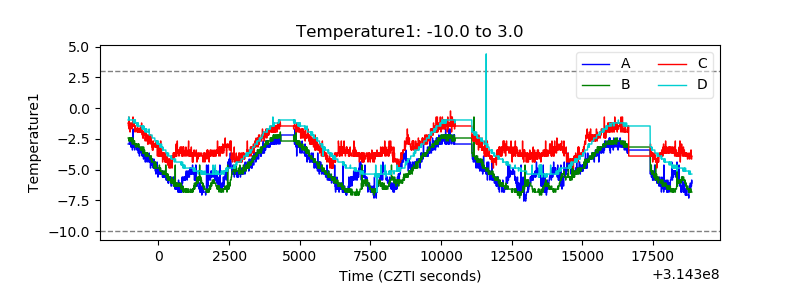 |
| Veto HV Monitor | 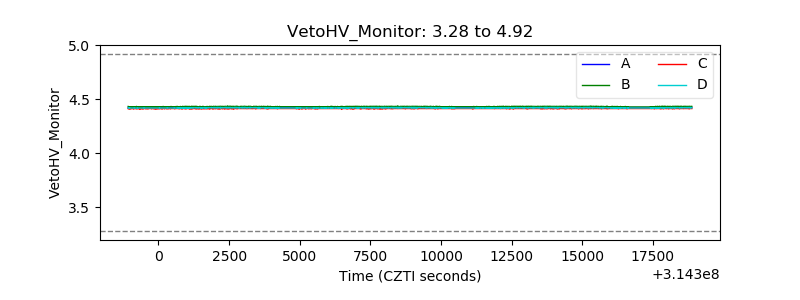 |
| Veto LLD | 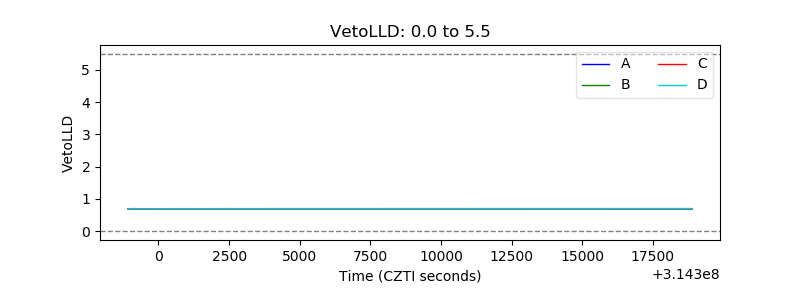 |
| Alpha Counter | 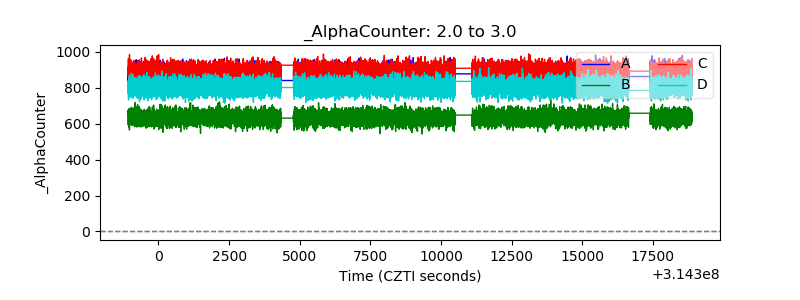 |
| _CPM_Rate | 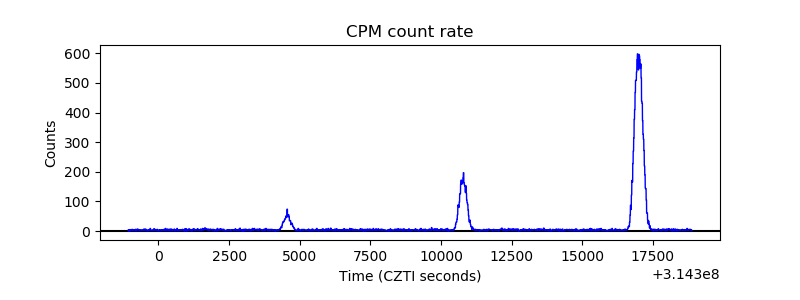 |
| CZT Counter |  |
| +2.5 Volts monitor |  |
| +5 Volts monitor |  |
| _ROLL_ROT | 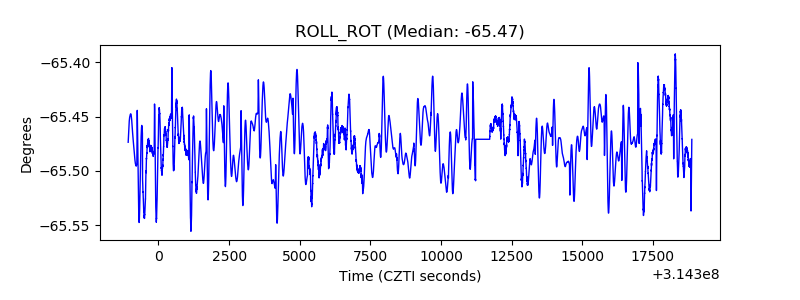 |
| _Roll_DEC | 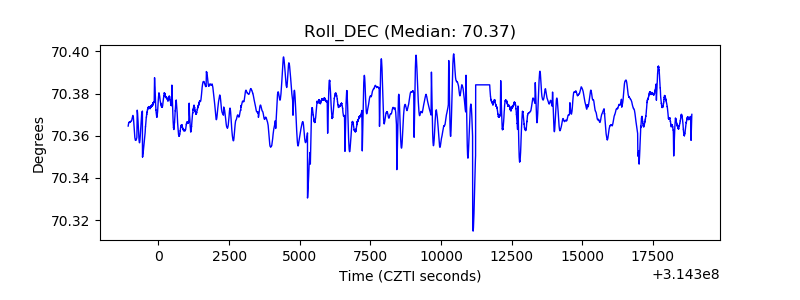 |
| _Roll_RA |  |
| Veto Counter | 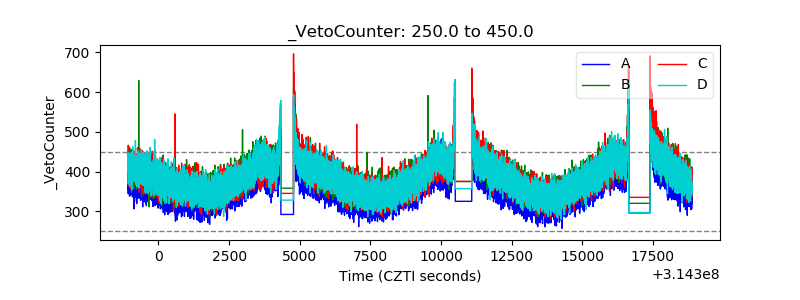 |