| Param | Original file | Final file |
|---|---|---|
| Filename | modeM0/AS1C05_012T02_9000003372_22821cztM0_level2.evt | modeM0/AS1C05_012T02_9000003372_22821cztM0_level2_quad_clean.evt |
| Size (bytes) | 606,070,080 | 106,597,440 |
| Size | 578.0 MB | 101.7 MB |
| Events in quadrant A | 3,225,016 | 706,681 |
| Events in quadrant B | 3,513,567 | 710,854 |
| Events in quadrant C | 3,367,975 | 686,687 |
| Events in quadrant D | 7,774,364 | 636,583 |
| Mode M0 | |||
|---|---|---|---|
| Quadrant | BADHDUFLAG | Total packets | Discarded packets |
| A | 0 | 14232 | 2 |
| B | 0 | 15029 | 2 |
| C | 0 | 14676 | 2 |
| D | 0 | 28117 | 2 |
| Mode M9 | |||
|---|---|---|---|
| Quadrant | BADHDUFLAG | Total packets | Discarded packets |
| A | 0 | 18 | 0 |
| B | 0 | 18 | 0 |
| C | 0 | 18 | 0 |
| D | 0 | 18 | 0 |
| Mode SS | |||
|---|---|---|---|
| Quadrant | BADHDUFLAG | Total packets | Discarded packets |
| A | 0 | 142 | 0 |
| B | 0 | 142 | 0 |
| C | 0 | 142 | 0 |
| D | 0 | 142 | 0 |
| Quadrant | Total seconds | Saturated seconds | Saturation percentage |
|---|---|---|---|
| A | 7000 | 37 | 0.528571% |
| B | 7001 | 113 | 1.614055% |
| C | 7001 | 97 | 1.385516% |
| D | 7001 | 1101 | 15.726325% |
Noise dominated data is calculated using 1-second bins in cleaned event files. If a bin has >2000 counts, and if more than 50% of those come from <1% of pixels, then it is considered to be noise-dominated and hence unusable.
| Quadrant | # 1 sec bins | Bins with >0 counts | Bins with >2000 counts | High rate bins dominated by noise | Noise dominated (total time) | Noise dominated (detector-on time) | Marked lightcurve |
|---|---|---|---|---|---|---|---|
| A | 8695 | 7002 | 0 | 0 | 0.00% | 0.00% | 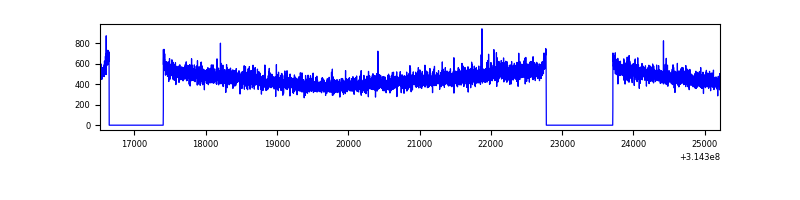 |
| B | 8696 | 7003 | 48 | 48 | 0.55% | 0.69% | 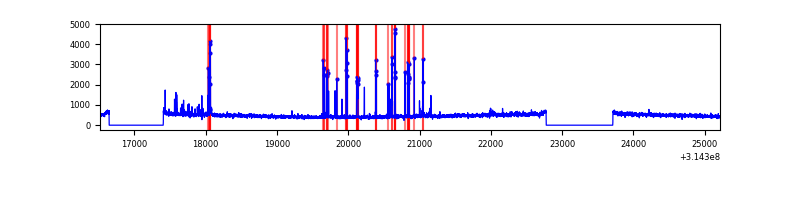 |
| C | 8696 | 7003 | 2 | 2 | 0.02% | 0.03% | 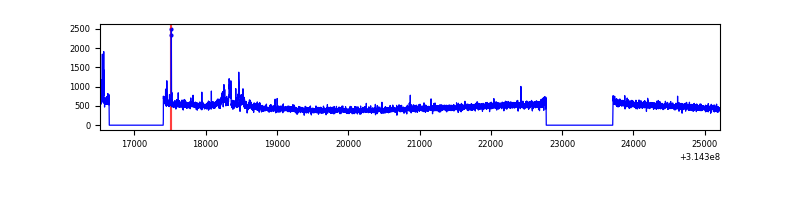 |
| D | 8696 | 7003 | 851 | 851 | 9.79% | 12.15% | 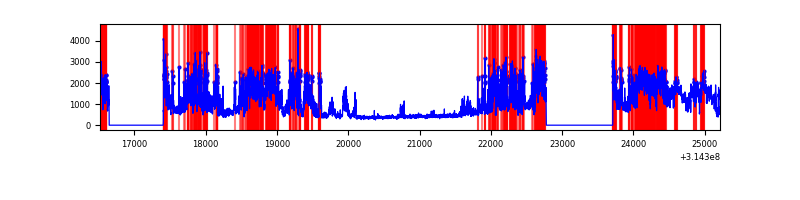 |
Top three noisy pixels from each quadrant. If the there are fewer than three noisy pixels in the level2.evt file, extra rows are filled as -1
| Pixel properties | Quadrant properties | ||||||
|---|---|---|---|---|---|---|---|
| Quadrant | DetID | PixID | Counts | Sigma | Mean | Median | Sigma |
| A | 13 | 254 | 11438 | 63.49 | 832 | 813 | 167.4 |
| A | 13 | 252 | 7335 | 38.97 | 832 | 813 | 167.4 |
| A | 3 | 137 | 7284 | 38.67 | 832 | 813 | 167.4 |
| B | 0 | 229 | 250654 | 1594.86 | 826 | 805 | 156.7 |
| B | 12 | 111 | 19524 | 119.49 | 826 | 805 | 156.7 |
| B | 11 | 111 | 17216 | 104.75 | 826 | 805 | 156.7 |
| C | 14 | 238 | 128660 | 678.1 | 801 | 805 | 188.5 |
| C | 2 | 16 | 104557 | 550.26 | 801 | 805 | 188.5 |
| C | 0 | 239 | 7177 | 33.79 | 801 | 805 | 188.5 |
| D | 7 | 238 | 4798529 | 25849.81 | 769 | 746 | 185.6 |
| D | 1 | 52 | 30904 | 162.49 | 769 | 746 | 185.6 |
| D | 2 | 234 | 26843 | 140.61 | 769 | 746 | 185.6 |
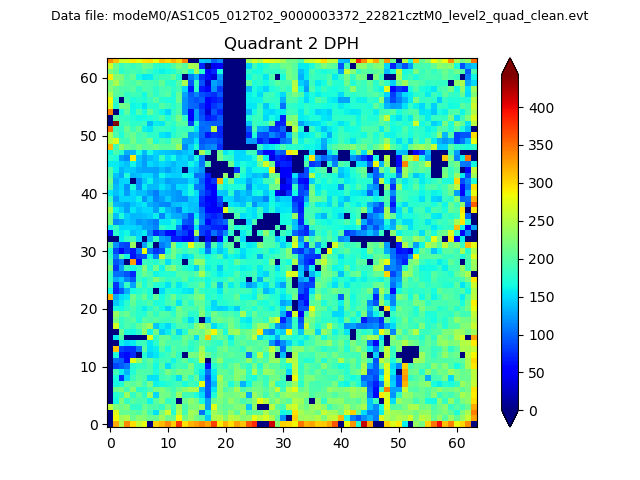
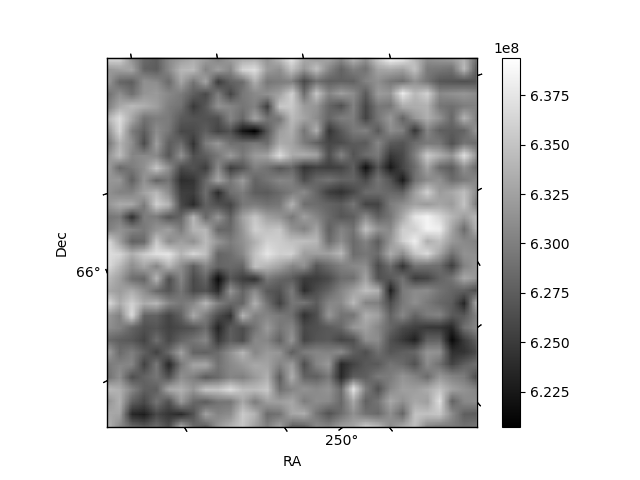
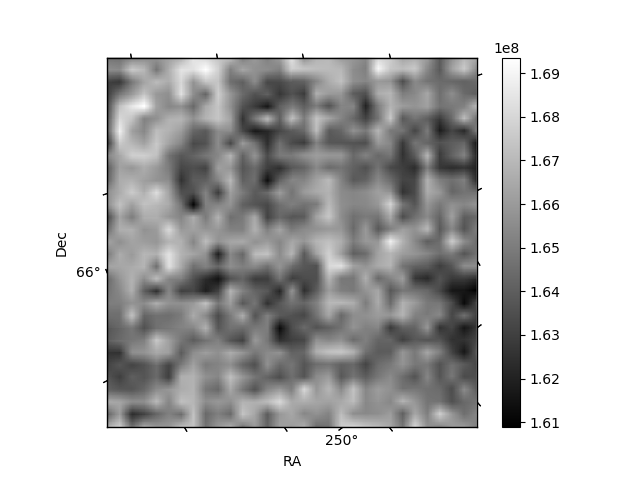
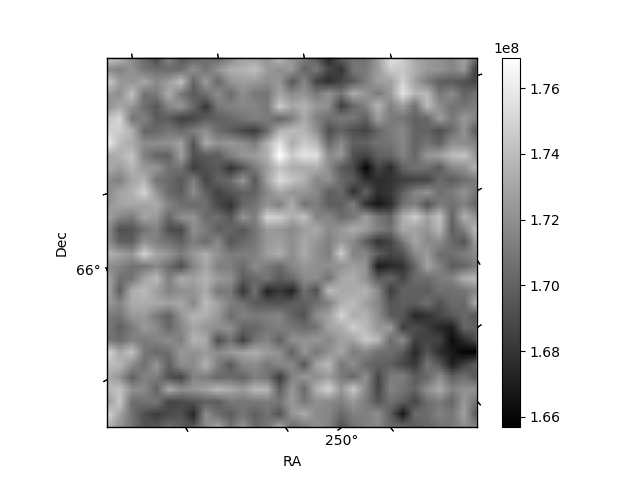
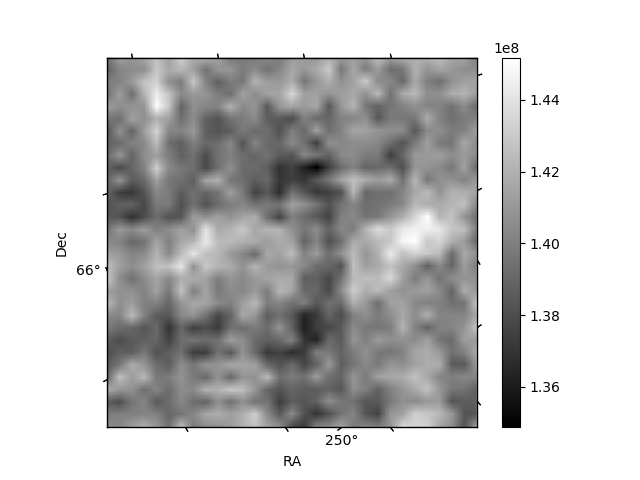
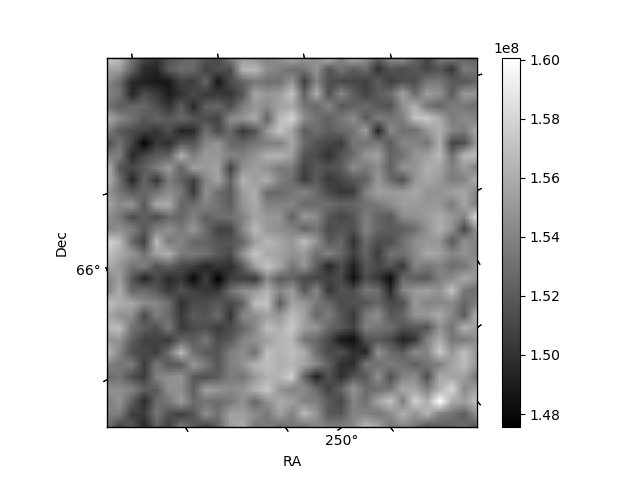
Histogram calculated using DETX and DETY for each event in the final _common_clean file
| Quadrant A | 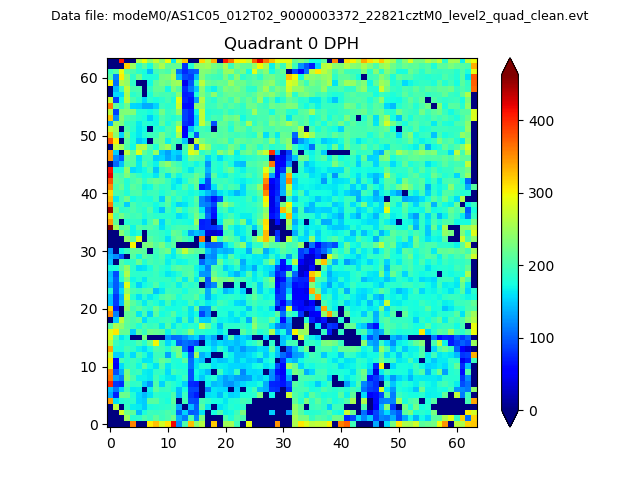 |
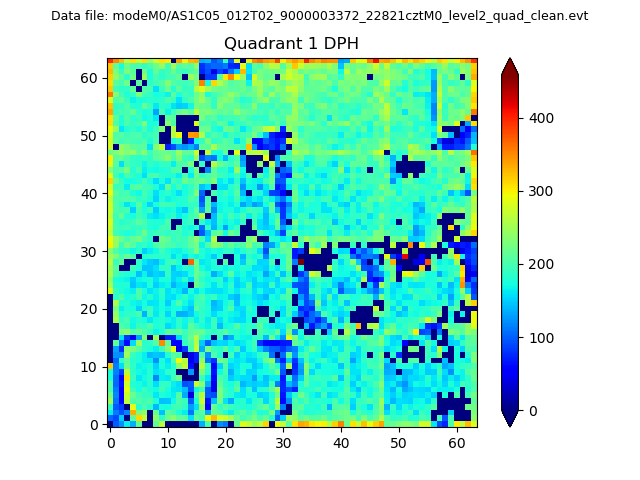 |
Quadrant B |
|---|---|---|---|
| Quadrant D | 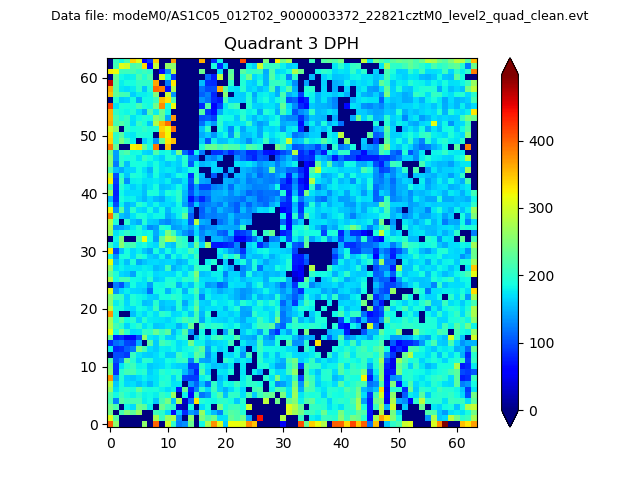 |
 |
Quadrant C |
| Plot type | Count rate plots | Images |
|---|---|---|
| Comparison with Poisson distribution Blue bars denote a histogram of data divided into 1 sec bins. Red curve is a Poisson curve with rate = median count rate of data. |
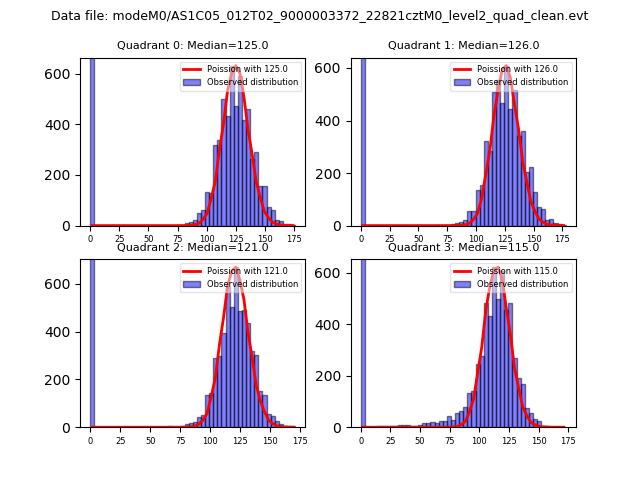 |
 |
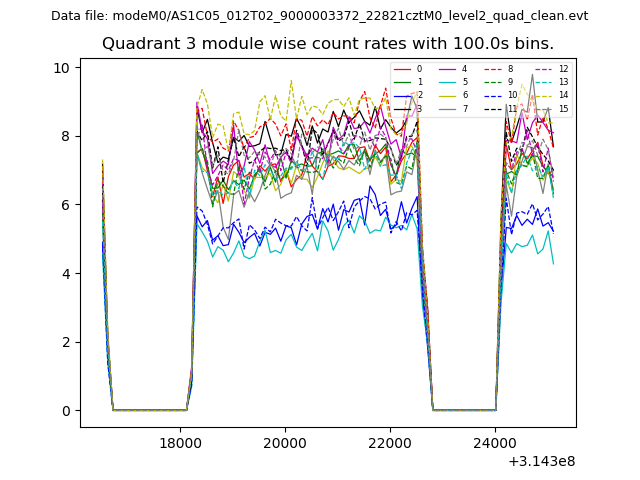
| Quadrant-wise count rates Data is divided into 100 sec bins |
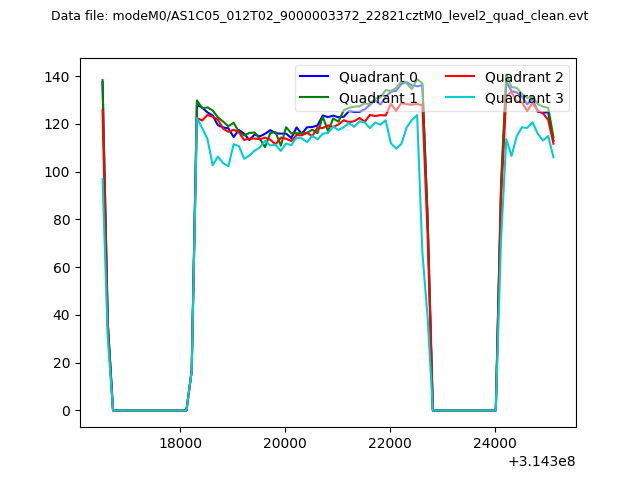 |
|
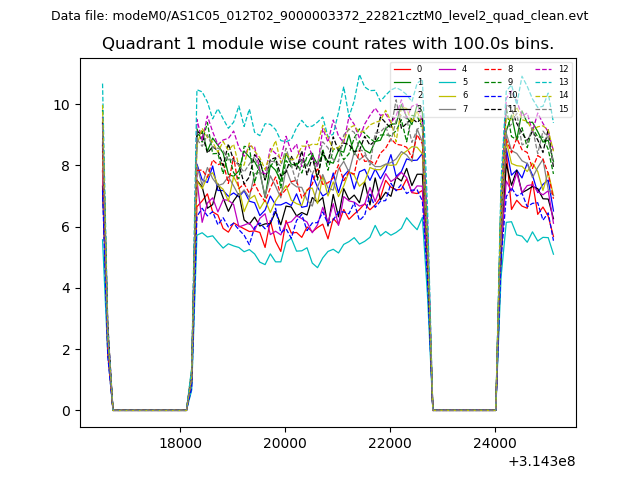
| Module-wise count rates for Quadrant A Data is divided into 100 sec bins |
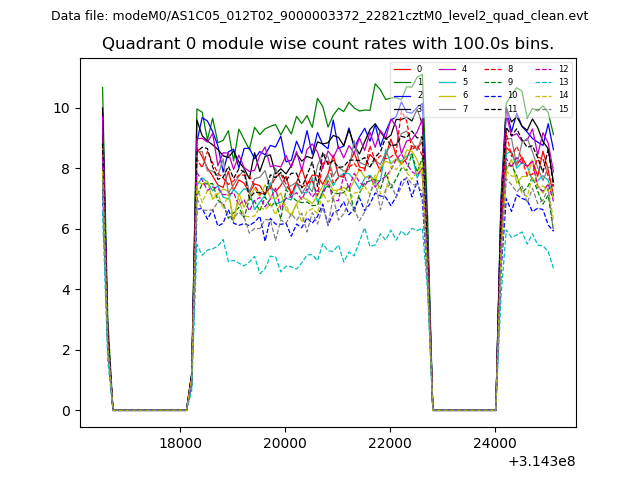 |
 |
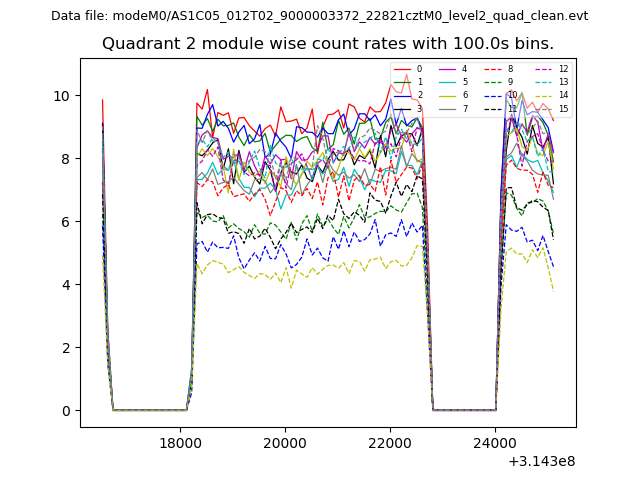
| Module-wise count rates for Quadrant B Data is divided into 100 sec bins |
 |
 |
| Module-wise count rates for Quadrant C Data is divided into 100 sec bins |
 |
 |
| Module-wise count rates for Quadrant D Data is divided into 100 sec bins |
 |
 |
| Parameter | Plot |
|---|---|
| CZT HV Monitor | 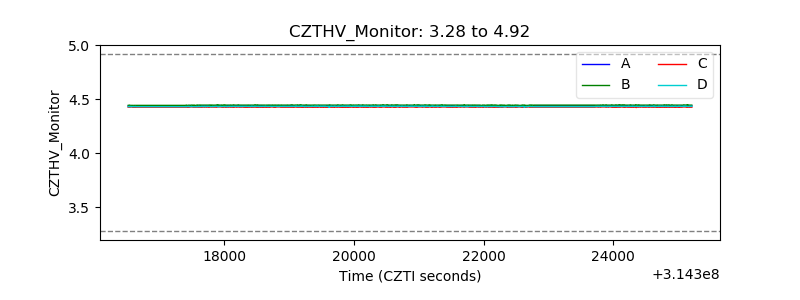 |
| D_VDD | 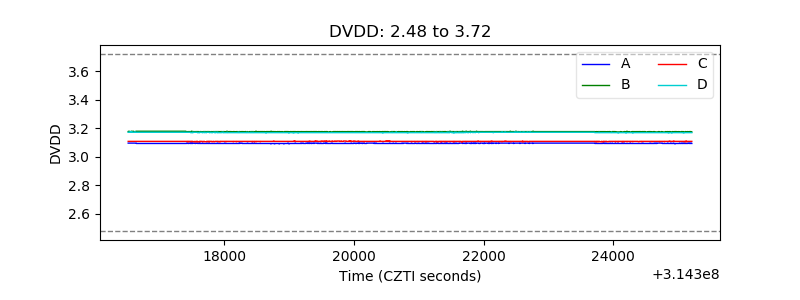 |
| Temperature 1 | 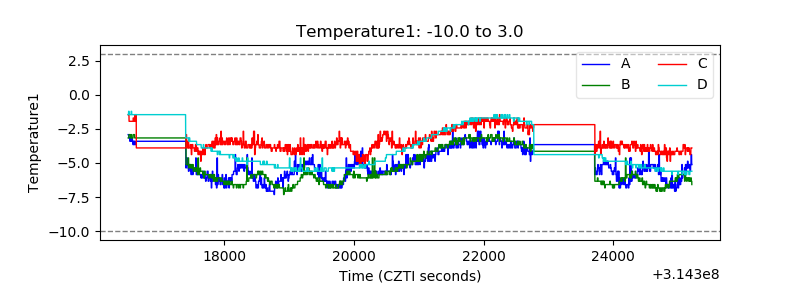 |
| Veto HV Monitor | 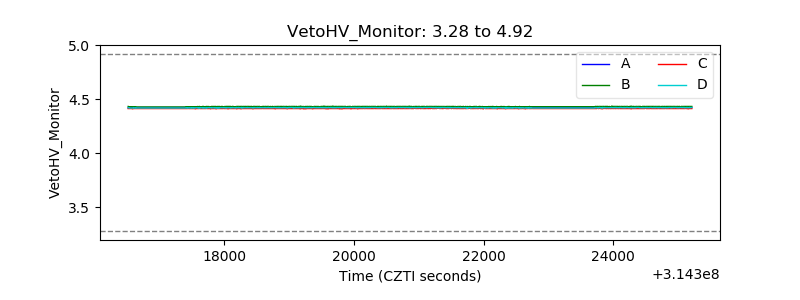 |
| Veto LLD | 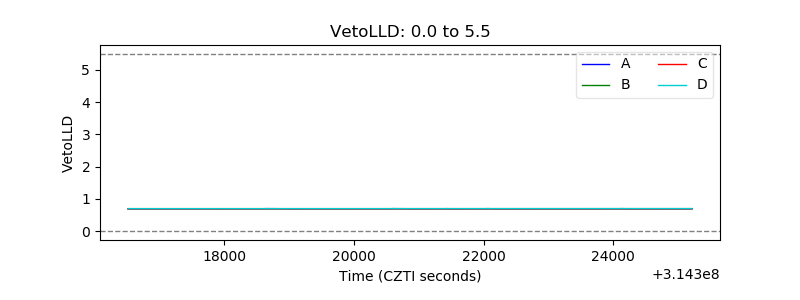 |
| Alpha Counter | 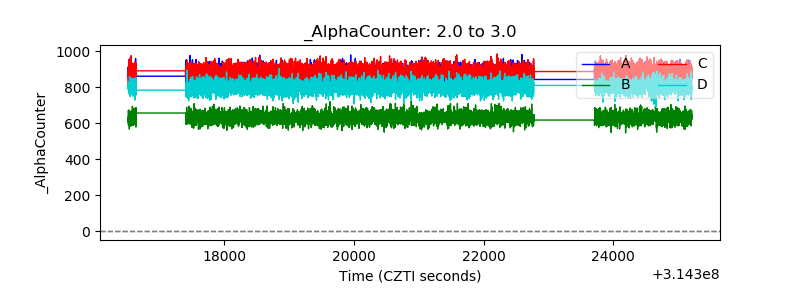 |
| _CPM_Rate | 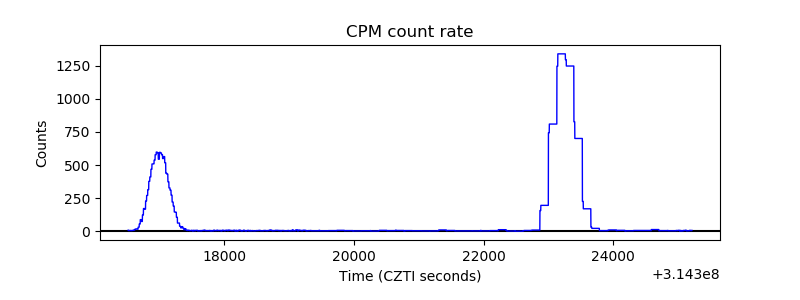 |
| CZT Counter | 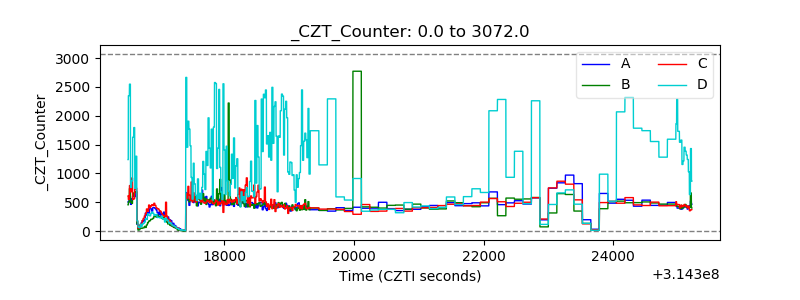 |
| +2.5 Volts monitor |  |
| +5 Volts monitor |  |
| _ROLL_ROT |  |
| _Roll_DEC | 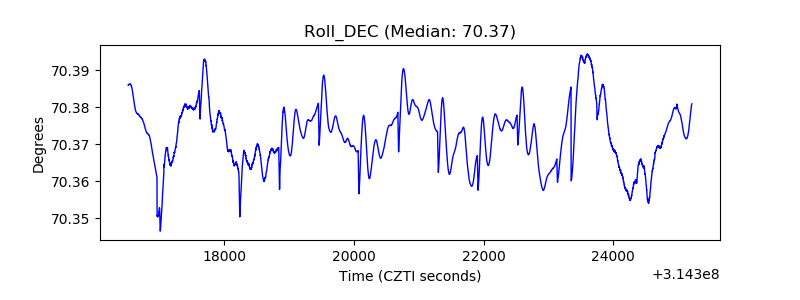 |
| _Roll_RA | 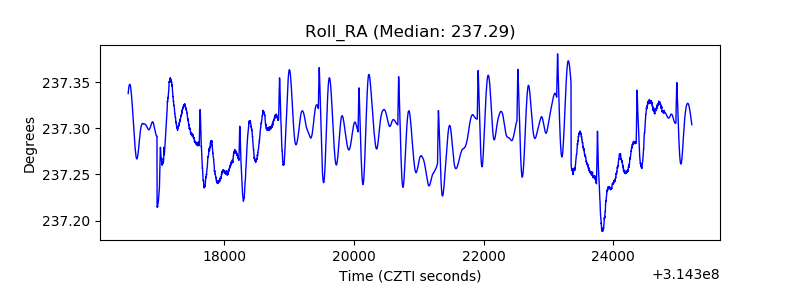 |
| Veto Counter | 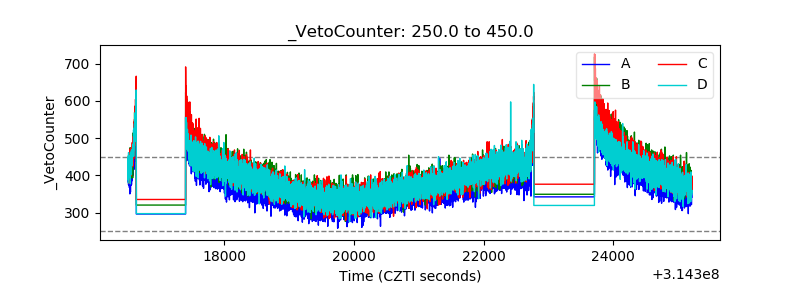 |