| Param | Original file | Final file |
|---|---|---|
| Filename | modeM0/AS1C05_012T02_9000003372_22822cztM0_level2.evt | modeM0/AS1C05_012T02_9000003372_22822cztM0_level2_quad_clean.evt |
| Size (bytes) | 569,327,040 | 117,601,920 |
| Size | 543.0 MB | 112.2 MB |
| Events in quadrant A | 3,054,273 | 801,050 |
| Events in quadrant B | 3,108,237 | 816,814 |
| Events in quadrant C | 3,087,825 | 775,696 |
| Events in quadrant D | 7,542,698 | 706,034 |
| Mode M0 | |||
|---|---|---|---|
| Quadrant | BADHDUFLAG | Total packets | Discarded packets |
| A | 0 | 13480 | 2 |
| B | 0 | 13571 | 2 |
| C | 0 | 13576 | 2 |
| D | 0 | 27228 | 2 |
| Mode M9 | |||
|---|---|---|---|
| Quadrant | BADHDUFLAG | Total packets | Discarded packets |
| A | 0 | 15 | 0 |
| B | 0 | 16 | 0 |
| C | 0 | 16 | 0 |
| D | 0 | 16 | 0 |
| Mode SS | |||
|---|---|---|---|
| Quadrant | BADHDUFLAG | Total packets | Discarded packets |
| A | 0 | 136 | 0 |
| B | 0 | 136 | 0 |
| C | 0 | 136 | 0 |
| D | 0 | 136 | 0 |
| Quadrant | Total seconds | Saturated seconds | Saturation percentage |
|---|---|---|---|
| A | 6620 | 8 | 0.120846% |
| B | 6619 | 17 | 0.256836% |
| C | 6619 | 48 | 0.725185% |
| D | 6619 | 1117 | 16.875661% |
Noise dominated data is calculated using 1-second bins in cleaned event files. If a bin has >2000 counts, and if more than 50% of those come from <1% of pixels, then it is considered to be noise-dominated and hence unusable.
| Quadrant | # 1 sec bins | Bins with >0 counts | Bins with >2000 counts | High rate bins dominated by noise | Noise dominated (total time) | Noise dominated (detector-on time) | Marked lightcurve |
|---|---|---|---|---|---|---|---|
| A | 7690 | 6621 | 0 | 0 | 0.00% | 0.00% | 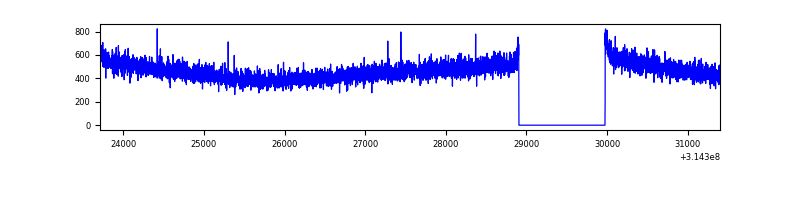 |
| B | 7689 | 6620 | 0 | 0 | 0.00% | 0.00% | 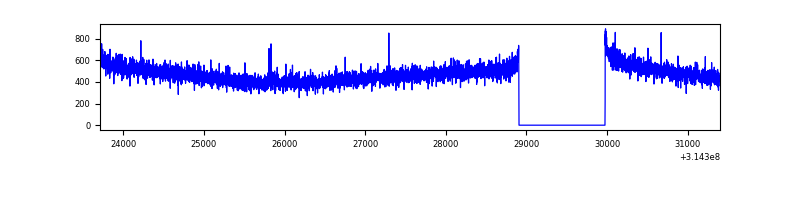 |
| C | 7689 | 6620 | 0 | 0 | 0.00% | 0.00% | 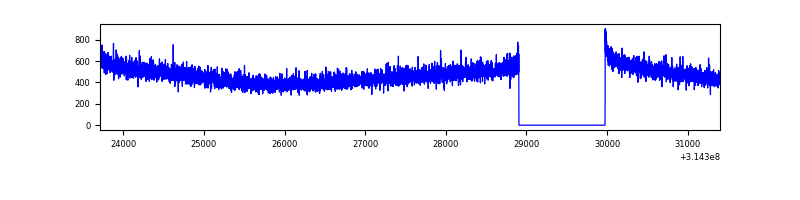 |
| D | 7689 | 6620 | 953 | 953 | 12.39% | 14.40% | 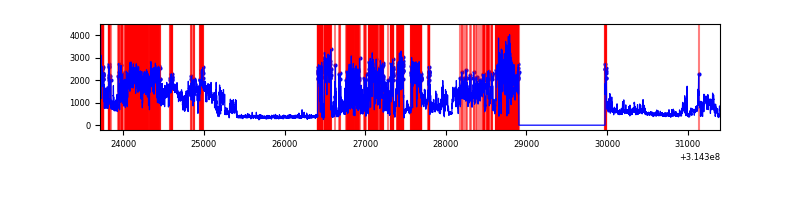 |
Top three noisy pixels from each quadrant. If the there are fewer than three noisy pixels in the level2.evt file, extra rows are filled as -1
| Pixel properties | Quadrant properties | ||||||
|---|---|---|---|---|---|---|---|
| Quadrant | DetID | PixID | Counts | Sigma | Mean | Median | Sigma |
| A | 13 | 254 | 11193 | 65.53 | 791 | 773 | 159.0 |
| A | 0 | 226 | 6771 | 37.72 | 791 | 773 | 159.0 |
| A | 3 | 137 | 6766 | 37.69 | 791 | 773 | 159.0 |
| B | 12 | 111 | 18273 | 115.62 | 792 | 770 | 151.4 |
| B | 11 | 111 | 16188 | 101.84 | 792 | 770 | 151.4 |
| B | 14 | 111 | 14522 | 90.84 | 792 | 770 | 151.4 |
| C | 14 | 238 | 121507 | 681.01 | 759 | 762 | 177.3 |
| C | 13 | 61 | 5305 | 25.62 | 759 | 762 | 177.3 |
| C | 0 | 239 | 4269 | 19.78 | 759 | 762 | 177.3 |
| D | 7 | 238 | 4354041 | 25435.21 | 719 | 699 | 171.2 |
| D | 12 | 227 | 409378 | 2387.78 | 719 | 699 | 171.2 |
| D | 1 | 52 | 29699 | 169.44 | 719 | 699 | 171.2 |
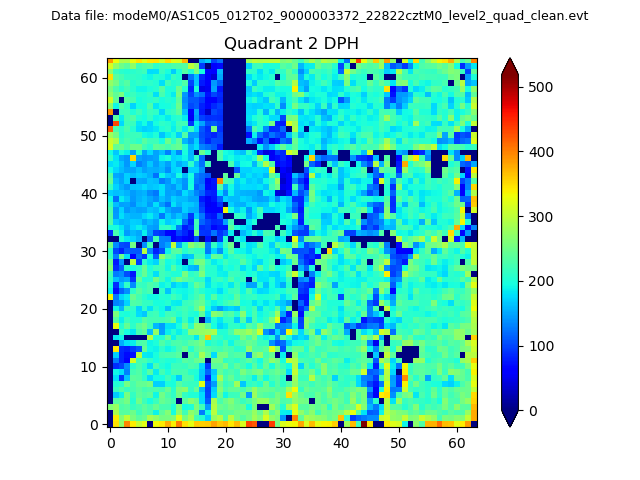
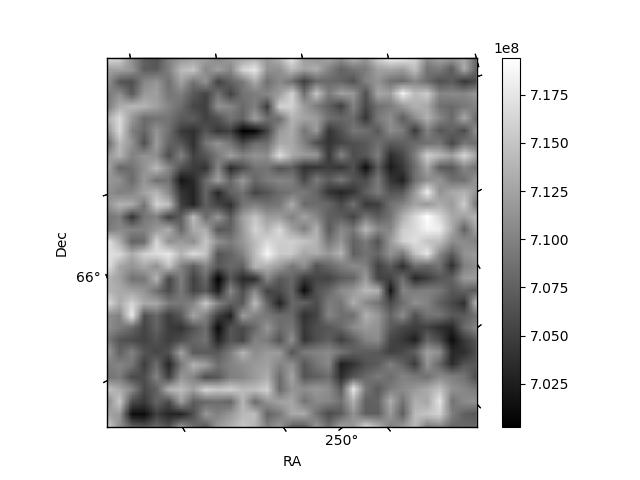
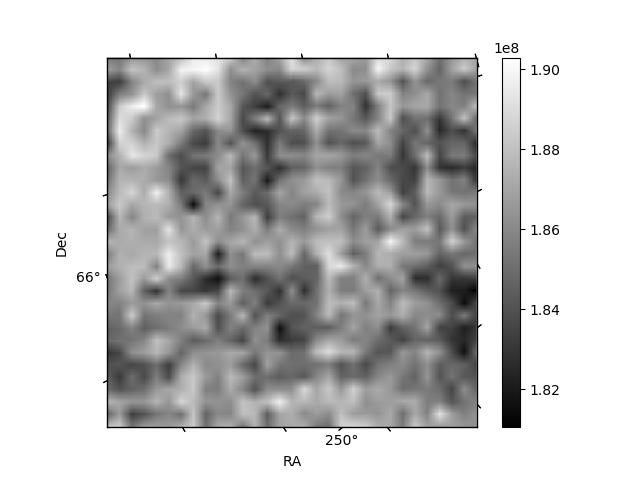
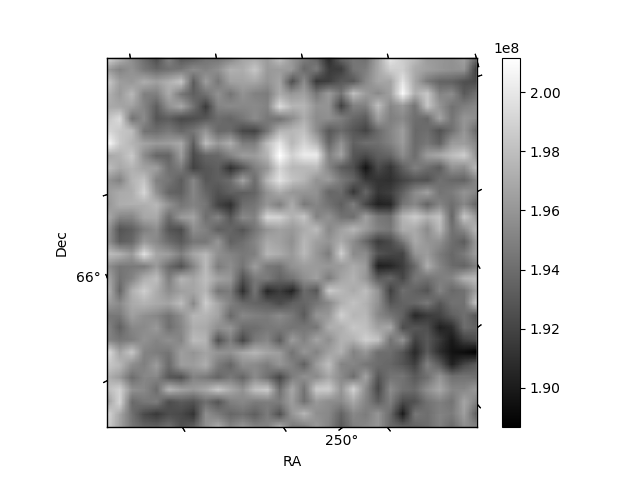
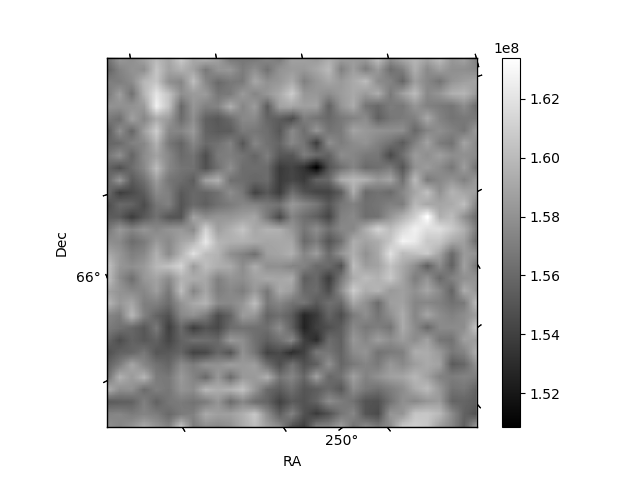
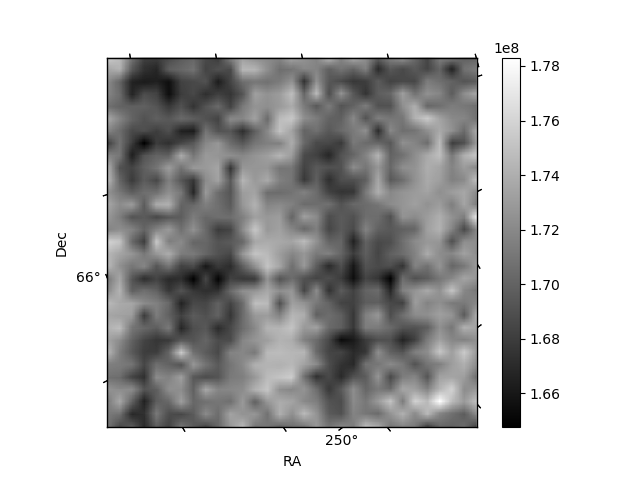
Histogram calculated using DETX and DETY for each event in the final _common_clean file
| Quadrant A | 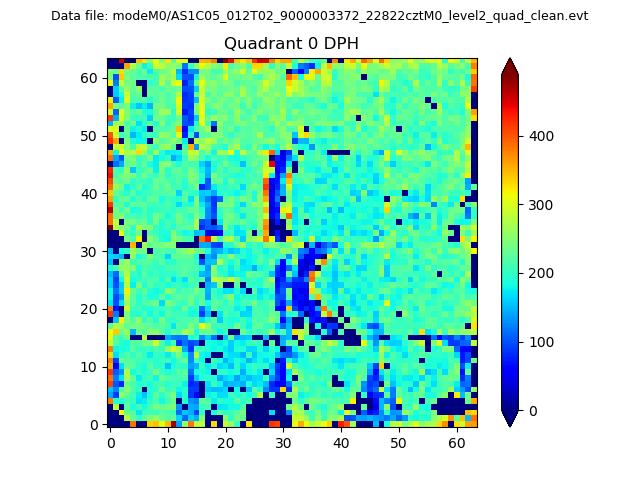 |
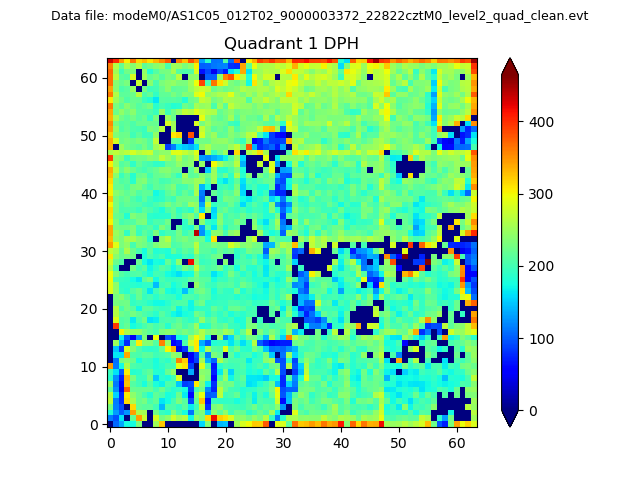 |
Quadrant B |
|---|---|---|---|
| Quadrant D | 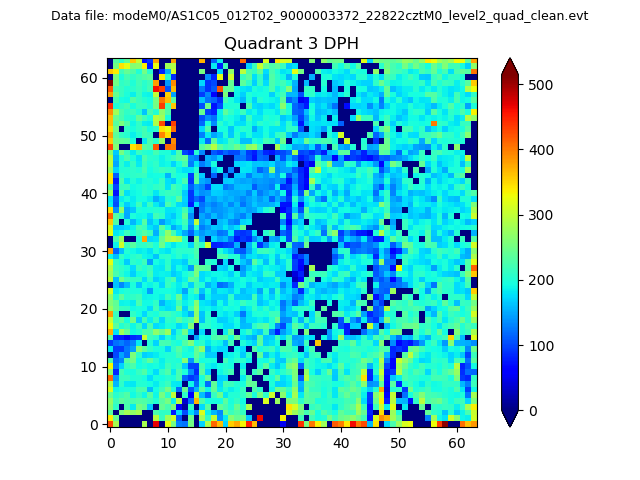 |
 |
Quadrant C |
| Plot type | Count rate plots | Images |
|---|---|---|
| Comparison with Poisson distribution Blue bars denote a histogram of data divided into 1 sec bins. Red curve is a Poisson curve with rate = median count rate of data. |
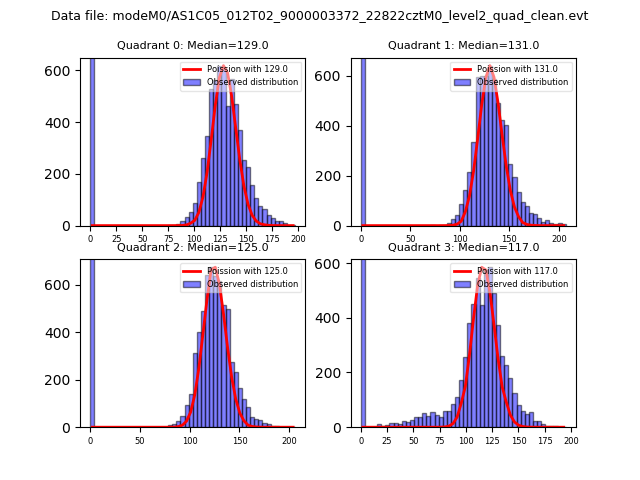 |
 |
| Quadrant-wise count rates Data is divided into 100 sec bins |
 |
|
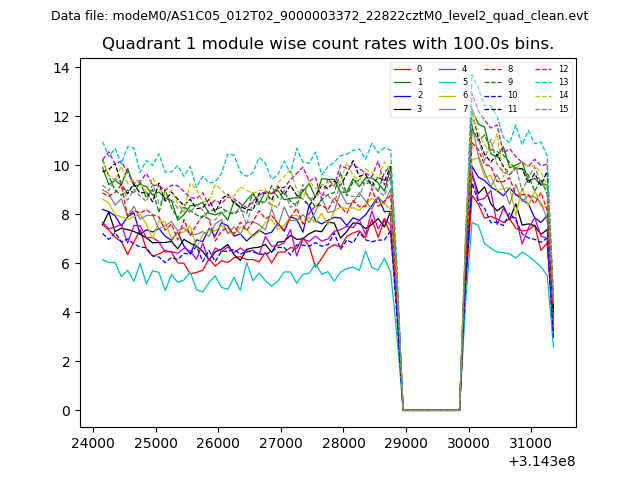
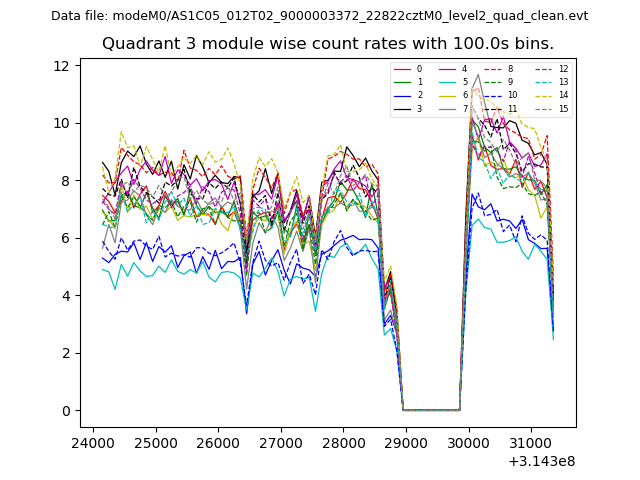
| Module-wise count rates for Quadrant A Data is divided into 100 sec bins |
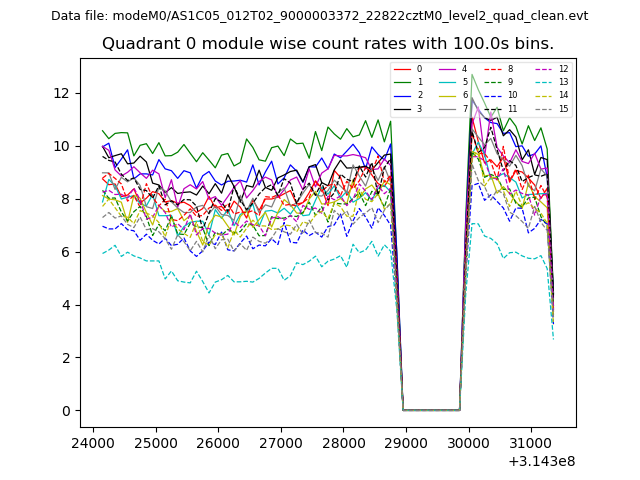 |
 |
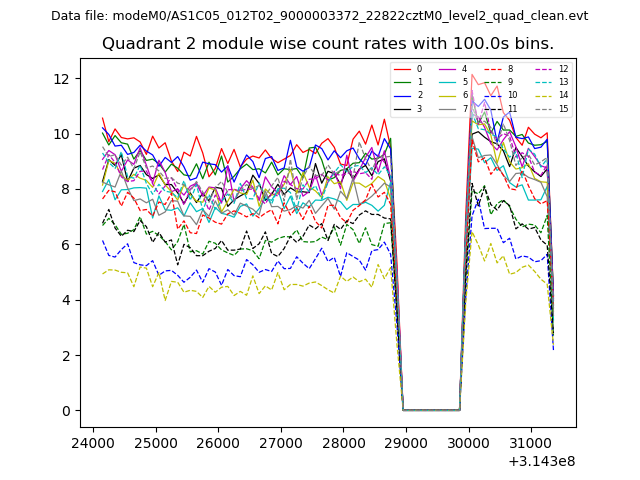
| Module-wise count rates for Quadrant B Data is divided into 100 sec bins |
 |
 |
| Module-wise count rates for Quadrant C Data is divided into 100 sec bins |
 |
 |
| Module-wise count rates for Quadrant D Data is divided into 100 sec bins |
 |
 |
| Parameter | Plot |
|---|---|
| CZT HV Monitor | 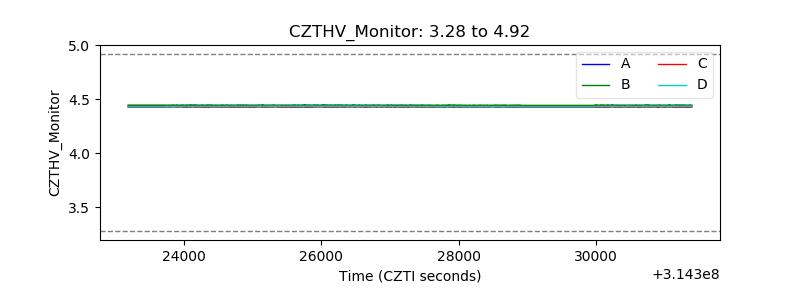 |
| D_VDD | 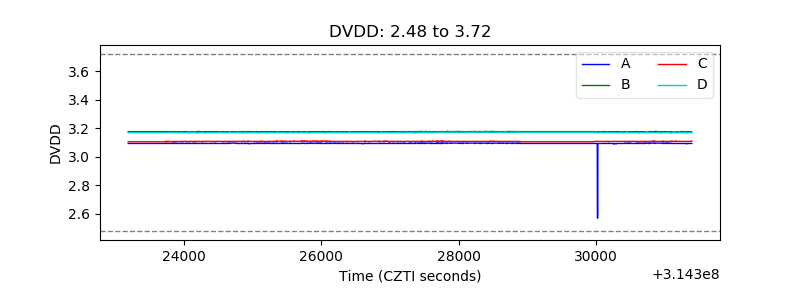 |
| Temperature 1 | 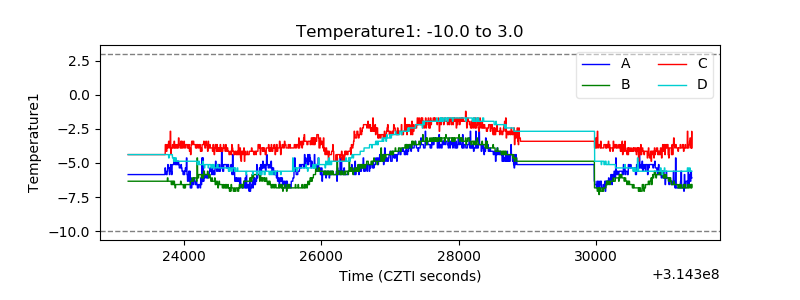 |
| Veto HV Monitor | 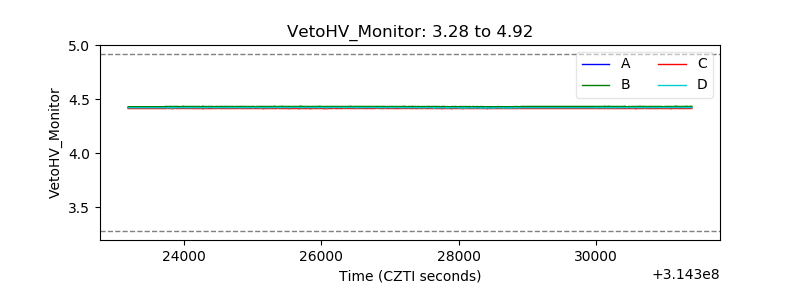 |
| Veto LLD | 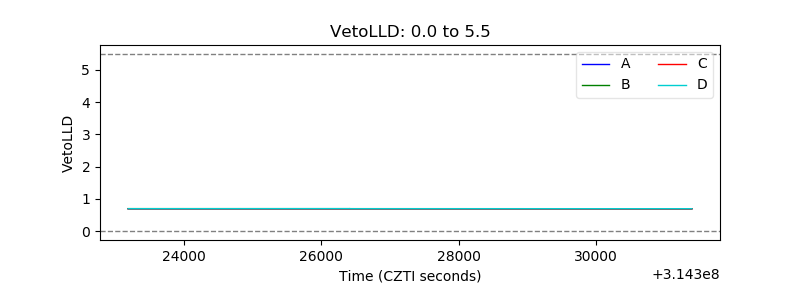 |
| Alpha Counter |  |
| _CPM_Rate |  |
| CZT Counter | 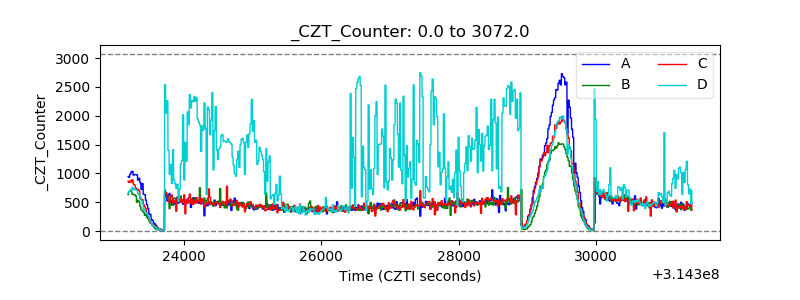 |
| +2.5 Volts monitor |  |
| +5 Volts monitor |  |
| _ROLL_ROT | 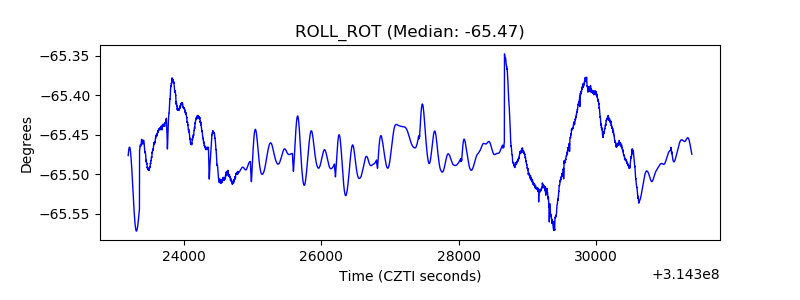 |
| _Roll_DEC | 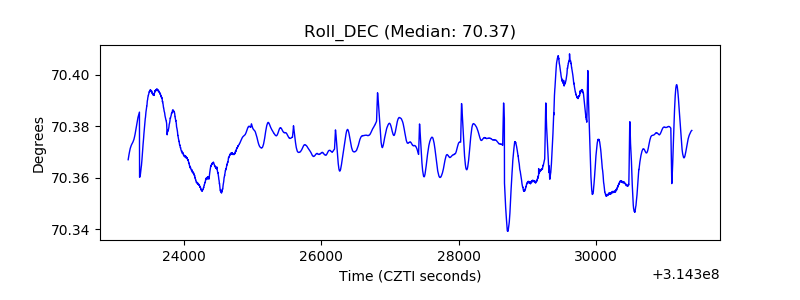 |
| _Roll_RA | 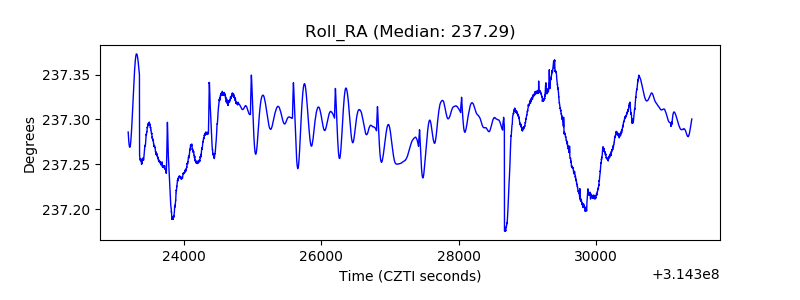 |
| Veto Counter | 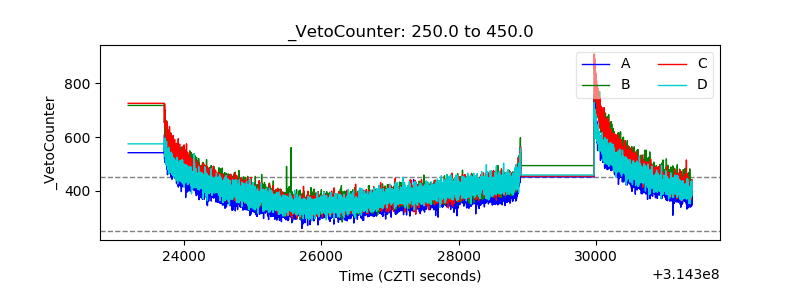 |