| Param | Original file | Final file |
|---|---|---|
| Filename | modeM0/AS1C05_012T02_9000003372_22824cztM0_level2.evt | modeM0/AS1C05_012T02_9000003372_22824cztM0_level2_quad_clean.evt |
| Size (bytes) | 511,902,720 | 124,130,880 |
| Size | 488.2 MB | 118.4 MB |
| Events in quadrant A | 3,135,635 | 847,481 |
| Events in quadrant B | 3,130,806 | 870,172 |
| Events in quadrant C | 3,087,561 | 813,635 |
| Events in quadrant D | 5,711,290 | 778,114 |
| Mode M0 | |||
|---|---|---|---|
| Quadrant | BADHDUFLAG | Total packets | Discarded packets |
| A | 0 | 13468 | 2 |
| B | 0 | 13504 | 2 |
| C | 0 | 13417 | 2 |
| D | 0 | 21584 | 2 |
| Mode M9 | |||
|---|---|---|---|
| Quadrant | BADHDUFLAG | Total packets | Discarded packets |
| A | 0 | 13 | 0 |
| B | 0 | 14 | 0 |
| C | 0 | 14 | 0 |
| D | 0 | 14 | 0 |
| Mode SS | |||
|---|---|---|---|
| Quadrant | BADHDUFLAG | Total packets | Discarded packets |
| A | 0 | 132 | 0 |
| B | 0 | 132 | 0 |
| C | 0 | 132 | 0 |
| D | 0 | 132 | 0 |
| Quadrant | Total seconds | Saturated seconds | Saturation percentage |
|---|---|---|---|
| A | 6453 | 14 | 0.216953% |
| B | 6453 | 27 | 0.418410% |
| C | 6453 | 49 | 0.759337% |
| D | 6453 | 204 | 3.161320% |
Noise dominated data is calculated using 1-second bins in cleaned event files. If a bin has >2000 counts, and if more than 50% of those come from <1% of pixels, then it is considered to be noise-dominated and hence unusable.
| Quadrant | # 1 sec bins | Bins with >0 counts | Bins with >2000 counts | High rate bins dominated by noise | Noise dominated (total time) | Noise dominated (detector-on time) | Marked lightcurve |
|---|---|---|---|---|---|---|---|
| A | 7648 | 6454 | 0 | 0 | 0.00% | 0.00% | 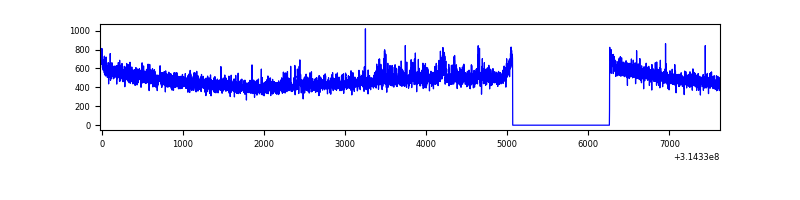 |
| B | 7648 | 6454 | 0 | 0 | 0.00% | 0.00% | 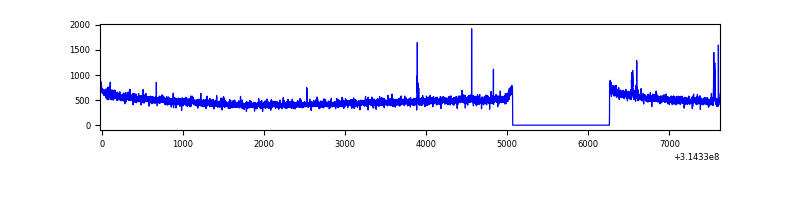 |
| C | 7648 | 6454 | 0 | 0 | 0.00% | 0.00% | 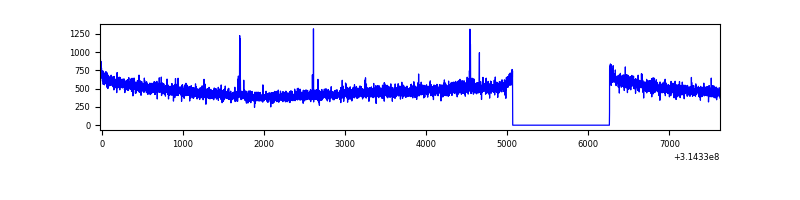 |
| D | 7648 | 6454 | 136 | 136 | 1.78% | 2.11% | 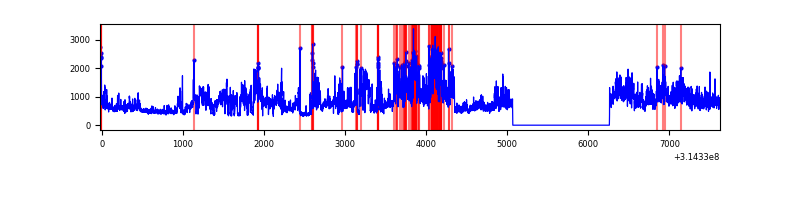 |
Top three noisy pixels from each quadrant. If the there are fewer than three noisy pixels in the level2.evt file, extra rows are filled as -1
| Pixel properties | Quadrant properties | ||||||
|---|---|---|---|---|---|---|---|
| Quadrant | DetID | PixID | Counts | Sigma | Mean | Median | Sigma |
| A | 11 | 47 | 80608 | 506.06 | 792 | 778 | 157.7 |
| A | 13 | 254 | 11425 | 67.49 | 792 | 778 | 157.7 |
| A | 0 | 226 | 6819 | 38.29 | 792 | 778 | 157.7 |
| B | 0 | 230 | 17757 | 114.26 | 793 | 773 | 148.6 |
| B | 12 | 111 | 17673 | 113.69 | 793 | 773 | 148.6 |
| B | 11 | 111 | 15956 | 102.14 | 793 | 773 | 148.6 |
| C | 14 | 238 | 120892 | 689.94 | 754 | 758 | 174.1 |
| C | 2 | 16 | 13894 | 75.44 | 754 | 758 | 174.1 |
| C | 10 | 22 | 9737 | 51.57 | 754 | 758 | 174.1 |
| D | 7 | 238 | 2410412 | 13395.79 | 751 | 728 | 179.9 |
| D | 1 | 52 | 328942 | 1824.59 | 751 | 728 | 179.9 |
| D | 12 | 227 | 121728 | 672.66 | 751 | 728 | 179.9 |
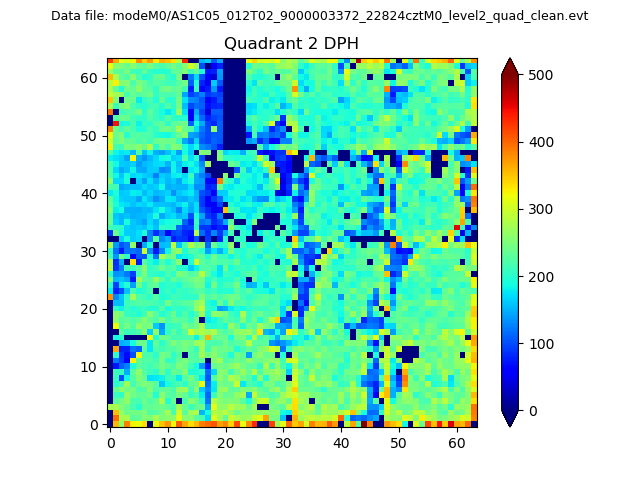
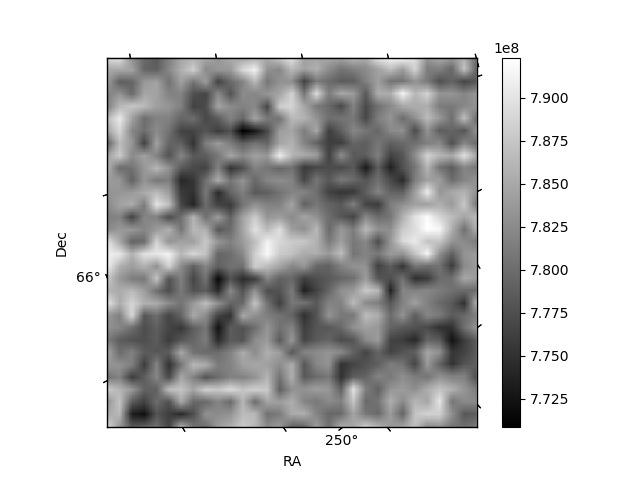
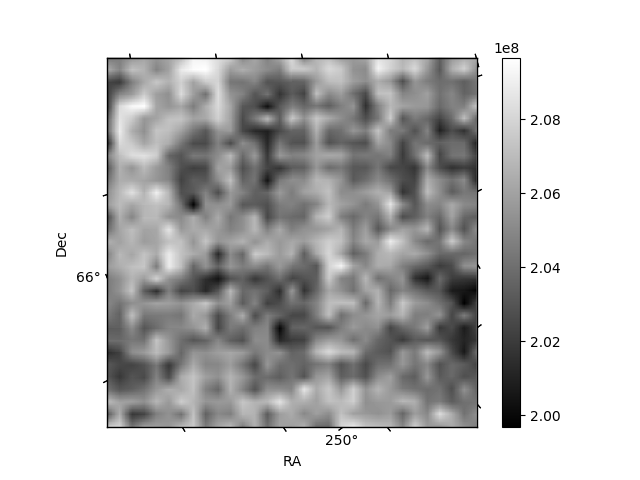
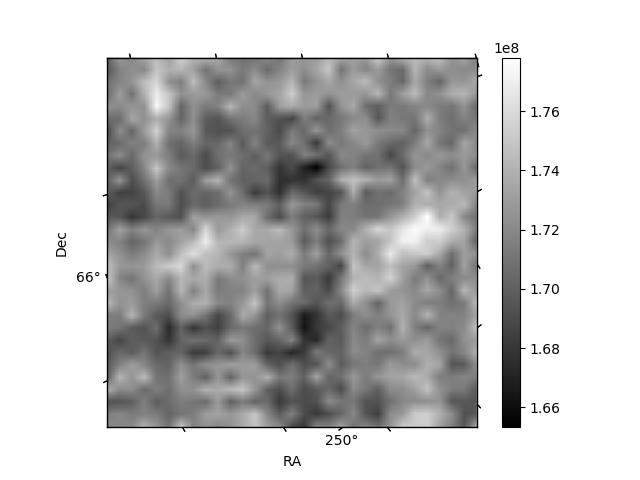
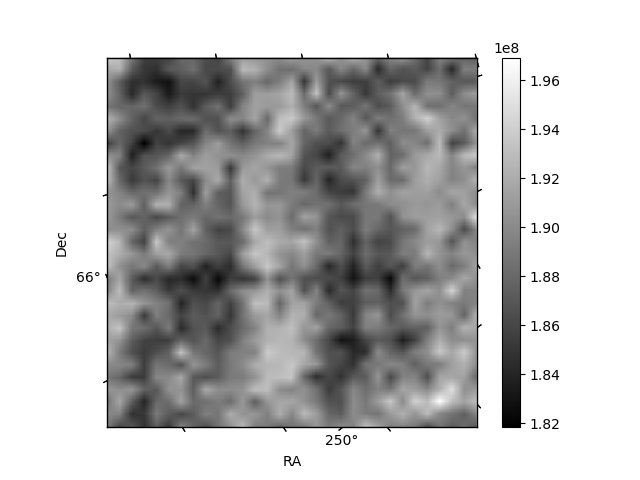
Histogram calculated using DETX and DETY for each event in the final _common_clean file
| Quadrant A | 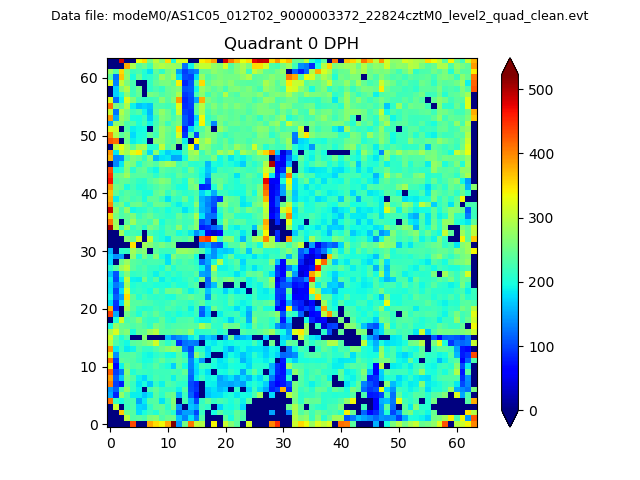 |
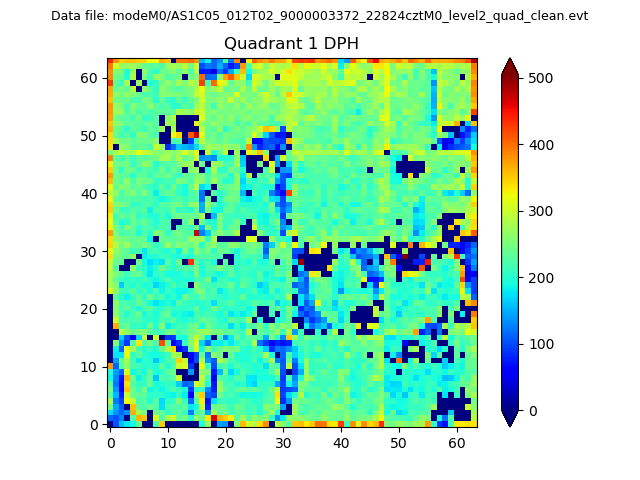 |
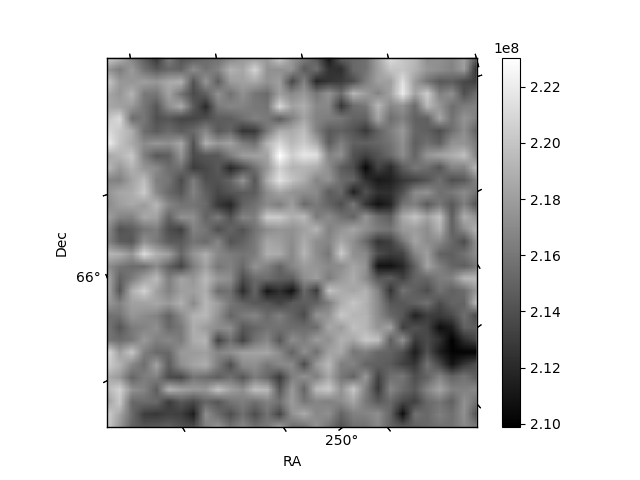
Quadrant B |
|---|---|---|---|
| Quadrant D | 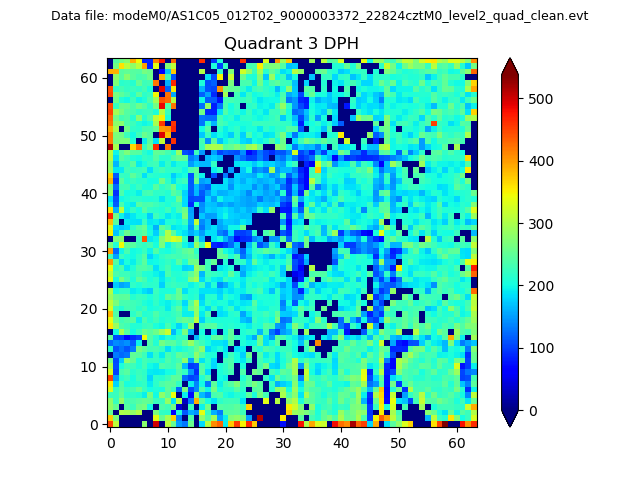 |
 |
Quadrant C |
| Plot type | Count rate plots | Images |
|---|---|---|
| Comparison with Poisson distribution Blue bars denote a histogram of data divided into 1 sec bins. Red curve is a Poisson curve with rate = median count rate of data. |
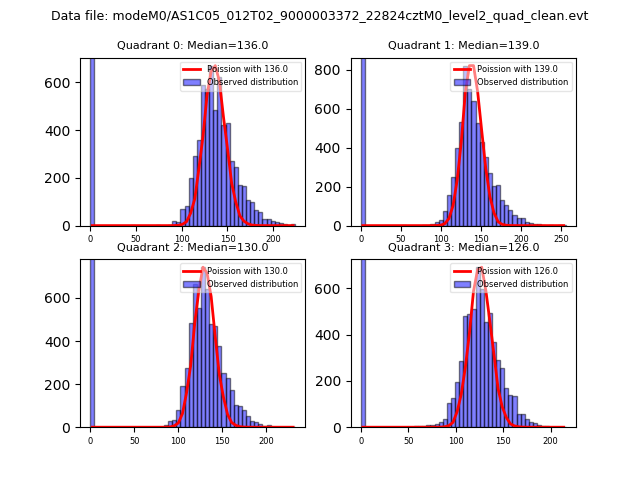 |
 |
| Quadrant-wise count rates Data is divided into 100 sec bins |
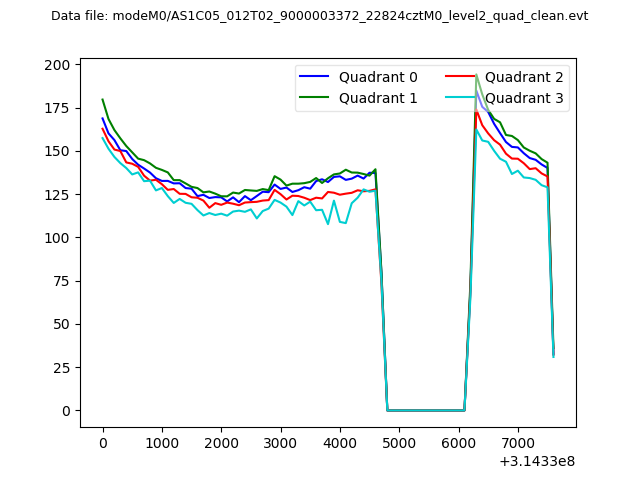 |
|
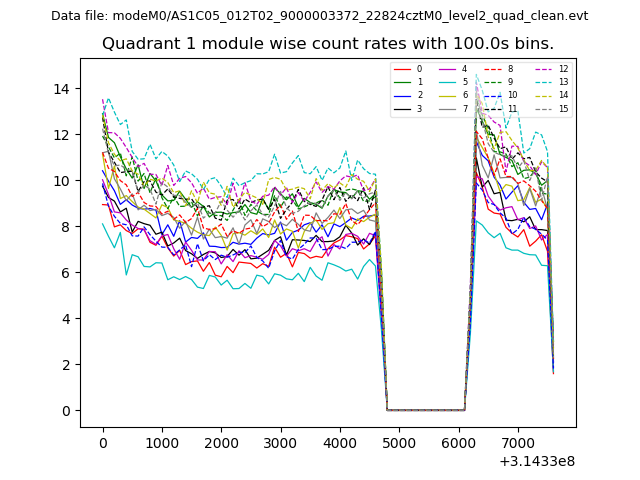
| Module-wise count rates for Quadrant A Data is divided into 100 sec bins |
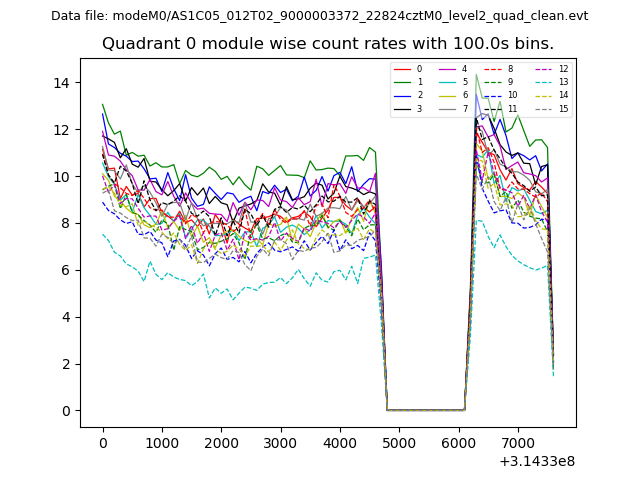 |
 |
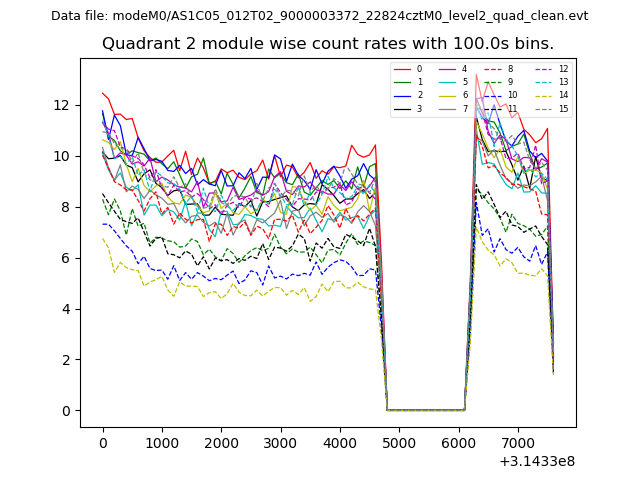
| Module-wise count rates for Quadrant B Data is divided into 100 sec bins |
 |
 |
| Module-wise count rates for Quadrant C Data is divided into 100 sec bins |
 |
 |
| Module-wise count rates for Quadrant D Data is divided into 100 sec bins |
 |
 |
| Parameter | Plot |
|---|---|
| CZT HV Monitor | 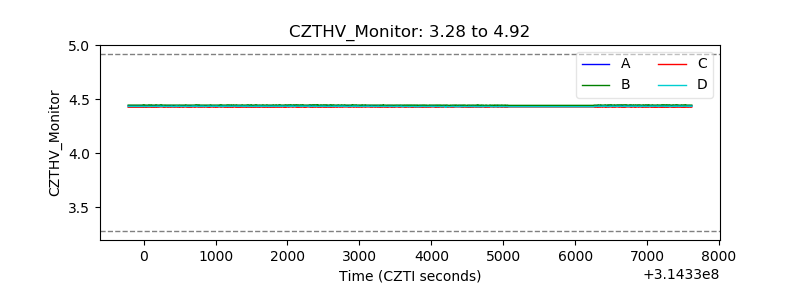 |
| D_VDD | 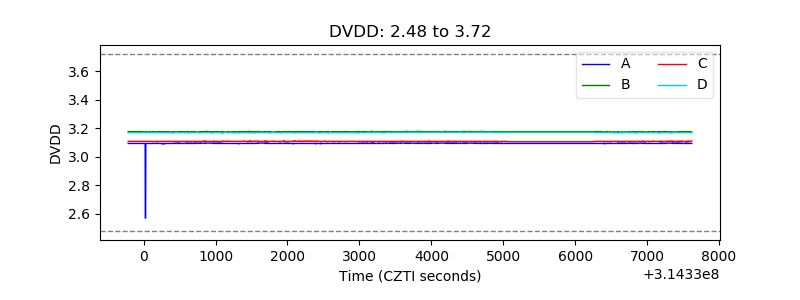 |
| Temperature 1 | 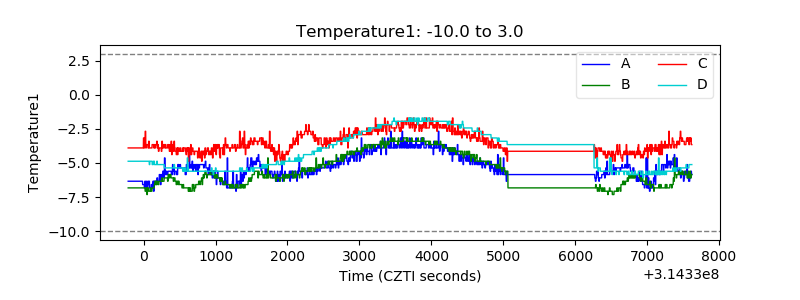 |
| Veto HV Monitor | 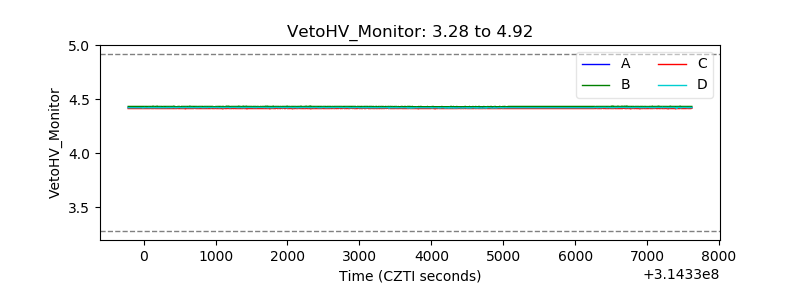 |
| Veto LLD |  |
| Alpha Counter | 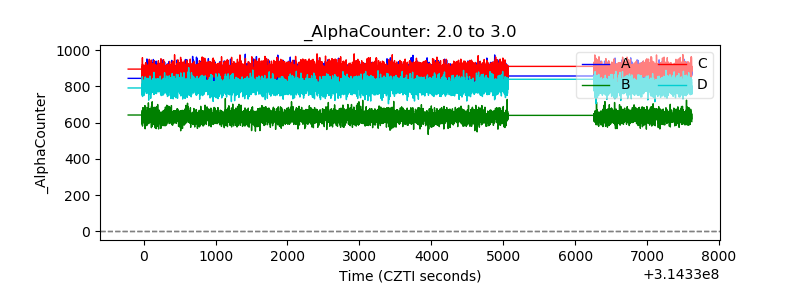 |
| _CPM_Rate | 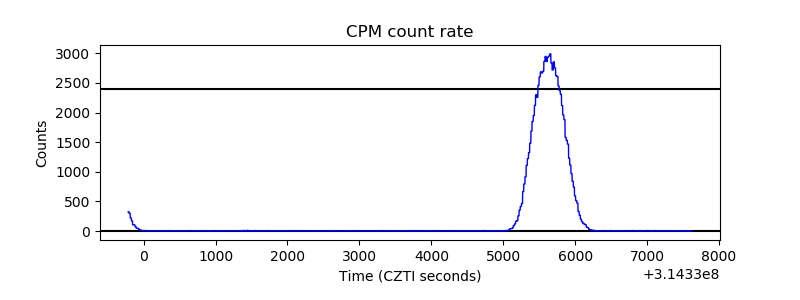 |
| CZT Counter | 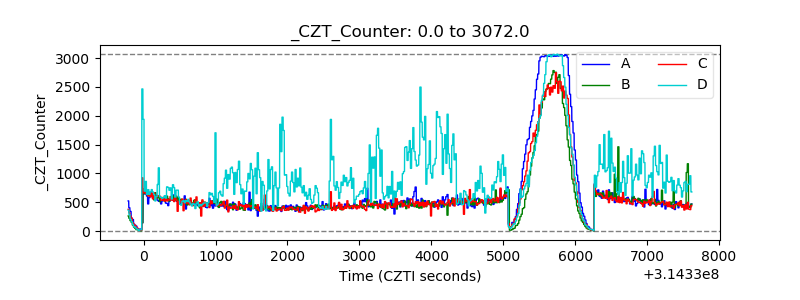 |
| +2.5 Volts monitor |  |
| +5 Volts monitor |  |
| _ROLL_ROT | 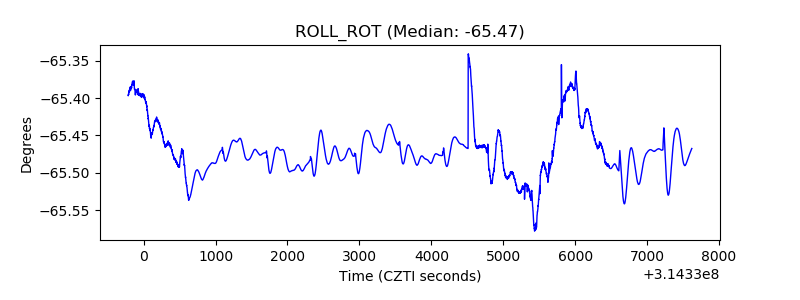 |
| _Roll_DEC | 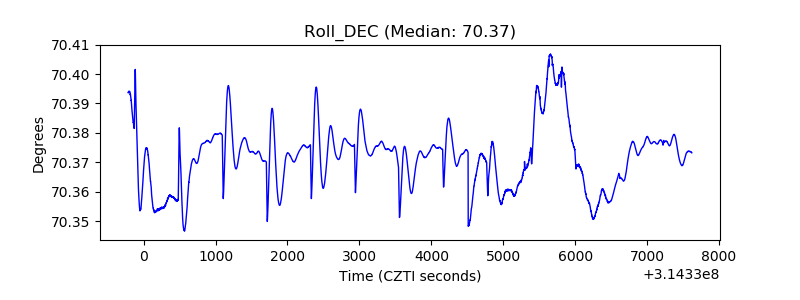 |
| _Roll_RA | 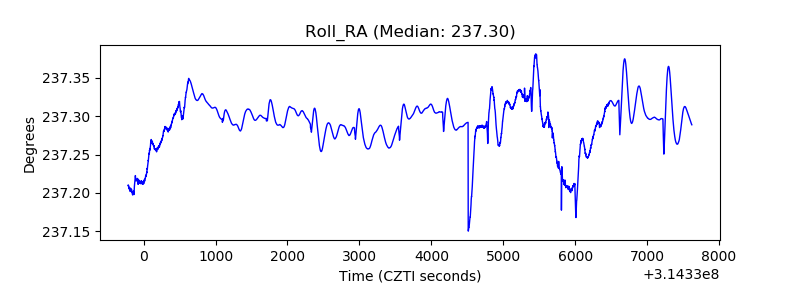 |
| Veto Counter |  |