| Param | Original file | Final file |
|---|---|---|
| Filename | modeM0/AS1C05_012T02_9000003372_22825cztM0_level2.evt | modeM0/AS1C05_012T02_9000003372_22825cztM0_level2_quad_clean.evt |
| Size (bytes) | 473,480,640 | 109,298,880 |
| Size | 451.5 MB | 104.2 MB |
| Events in quadrant A | 2,822,009 | 750,608 |
| Events in quadrant B | 2,857,546 | 767,968 |
| Events in quadrant C | 2,810,135 | 711,186 |
| Events in quadrant D | 5,455,511 | 674,445 |
| Mode M0 | |||
|---|---|---|---|
| Quadrant | BADHDUFLAG | Total packets | Discarded packets |
| A | 0 | 12109 | 91 |
| B | 0 | 12183 | 97 |
| C | 0 | 12119 | 83 |
| D | 0 | 20365 | 116 |
| Mode M9 | |||
|---|---|---|---|
| Quadrant | BADHDUFLAG | Total packets | Discarded packets |
| A | 0 | 13 | 0 |
| B | 0 | 13 | 0 |
| C | 0 | 13 | 0 |
| D | 0 | 13 | 0 |
| Mode SS | |||
|---|---|---|---|
| Quadrant | BADHDUFLAG | Total packets | Discarded packets |
| A | 0 | 120 | 0 |
| B | 0 | 120 | 2 |
| C | 0 | 120 | 0 |
| D | 0 | 120 | 0 |
| Quadrant | Total seconds | Saturated seconds | Saturation percentage |
|---|---|---|---|
| A | 5804 | 17 | 0.292901% |
| B | 5806 | 38 | 0.654495% |
| C | 5809 | 43 | 0.740231% |
| D | 5805 | 276 | 4.754522% |
Noise dominated data is calculated using 1-second bins in cleaned event files. If a bin has >2000 counts, and if more than 50% of those come from <1% of pixels, then it is considered to be noise-dominated and hence unusable.
| Quadrant | # 1 sec bins | Bins with >0 counts | Bins with >2000 counts | High rate bins dominated by noise | Noise dominated (total time) | Noise dominated (detector-on time) | Marked lightcurve |
|---|---|---|---|---|---|---|---|
| A | 7121 | 5842 | 0 | 0 | 0.00% | 0.00% | 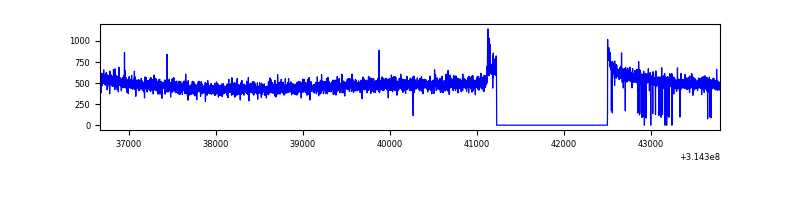 |
| B | 7122 | 5844 | 0 | 0 | 0.00% | 0.00% | 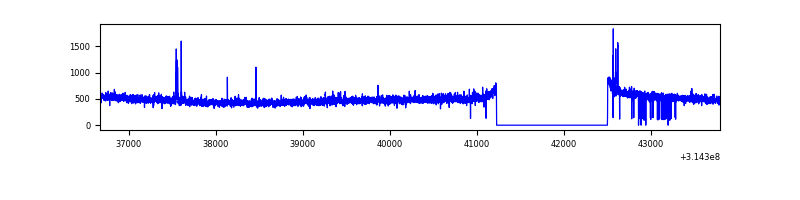 |
| C | 7122 | 5842 | 4 | 4 | 0.06% | 0.07% | 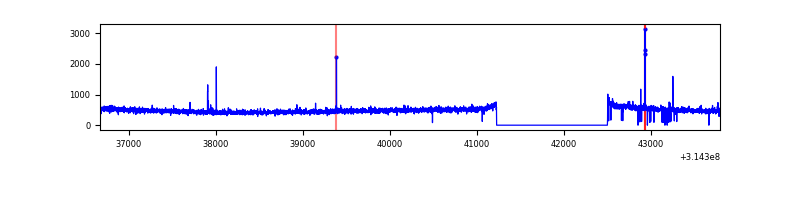 |
| D | 7122 | 5843 | 228 | 228 | 3.20% | 3.90% | 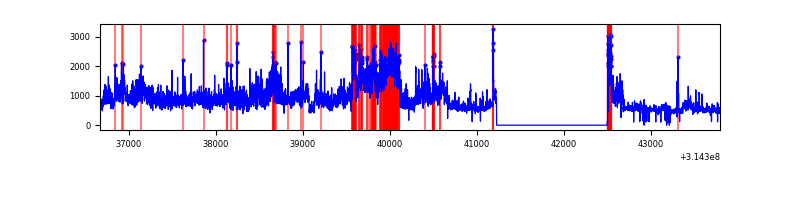 |
Top three noisy pixels from each quadrant. If the there are fewer than three noisy pixels in the level2.evt file, extra rows are filled as -1
| Pixel properties | Quadrant properties | ||||||
|---|---|---|---|---|---|---|---|
| Quadrant | DetID | PixID | Counts | Sigma | Mean | Median | Sigma |
| A | 13 | 252 | 13387 | 88.77 | 727 | 714 | 142.8 |
| A | 13 | 254 | 10895 | 71.32 | 727 | 714 | 142.8 |
| A | 0 | 226 | 6482 | 40.4 | 727 | 714 | 142.8 |
| B | 0 | 229 | 26248 | 189.95 | 722 | 708 | 134.5 |
| B | 12 | 111 | 15576 | 110.58 | 722 | 708 | 134.5 |
| B | 0 | 230 | 15406 | 109.31 | 722 | 708 | 134.5 |
| C | 14 | 238 | 112936 | 716.75 | 682 | 685 | 156.6 |
| C | 2 | 16 | 29717 | 185.37 | 682 | 685 | 156.6 |
| C | 1 | 16 | 4787 | 26.19 | 682 | 685 | 156.6 |
| D | 7 | 238 | 2075076 | 12669.9 | 682 | 662 | 163.7 |
| D | 1 | 52 | 517551 | 3157.0 | 682 | 662 | 163.7 |
| D | 12 | 227 | 251983 | 1534.99 | 682 | 662 | 163.7 |
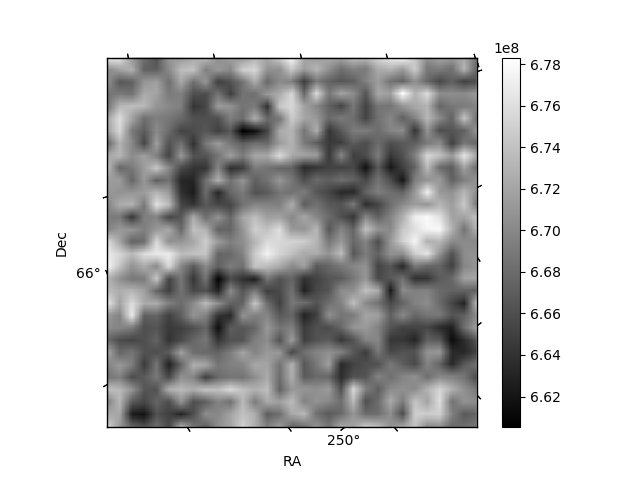
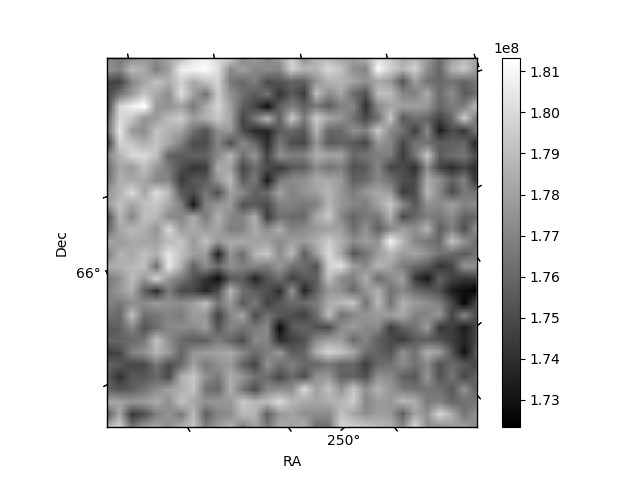
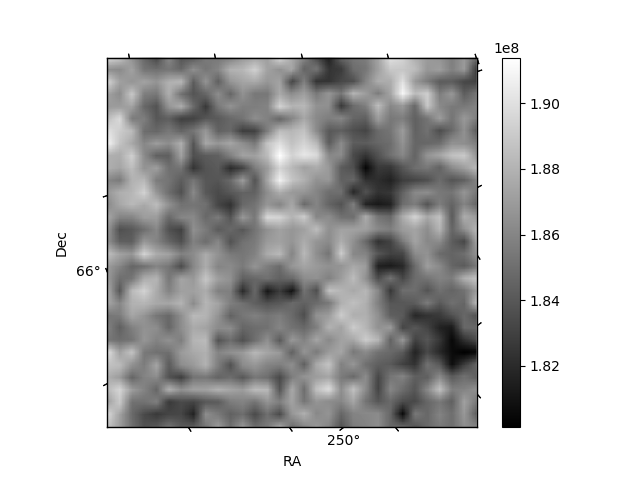
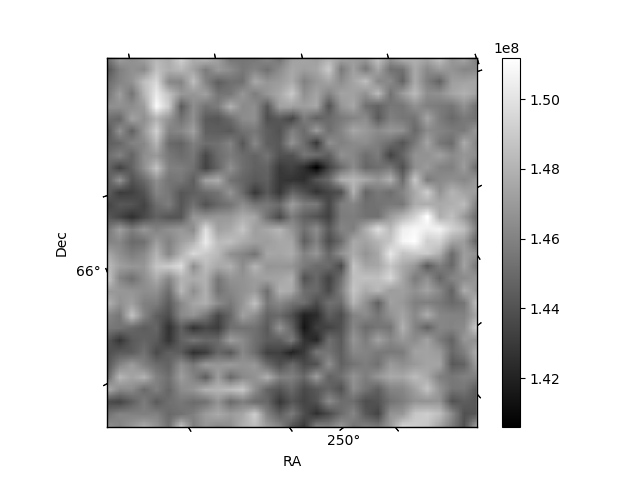
Histogram calculated using DETX and DETY for each event in the final _common_clean file
| Quadrant A | 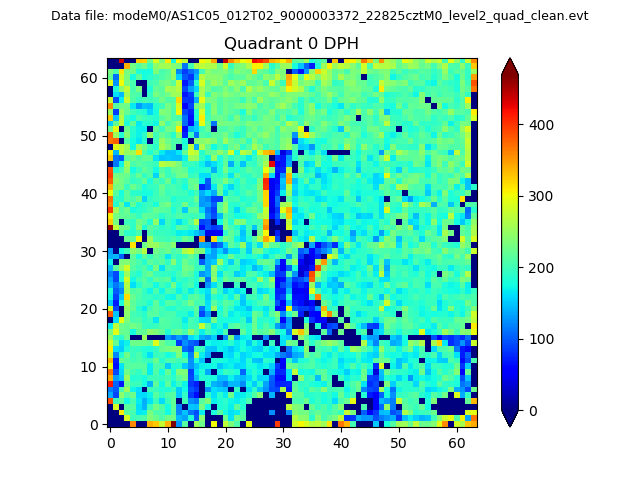 |
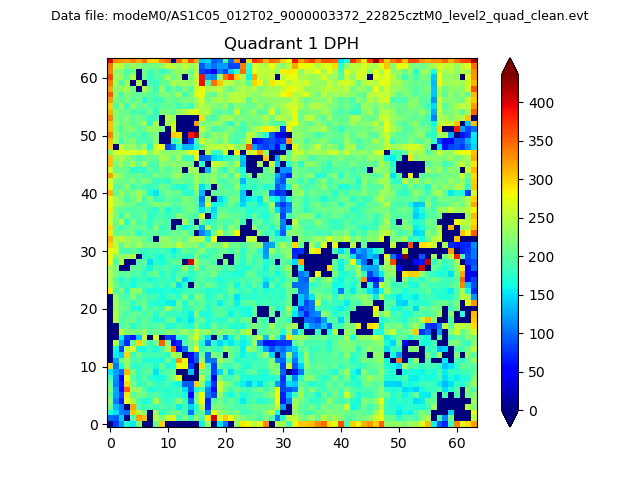 |
Quadrant B |
|---|---|---|---|
| Quadrant D | 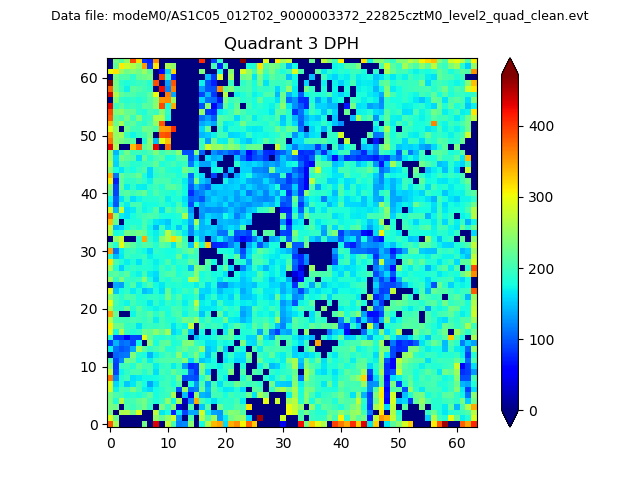 |
 |
Quadrant C |
| Plot type | Count rate plots | Images |
|---|---|---|
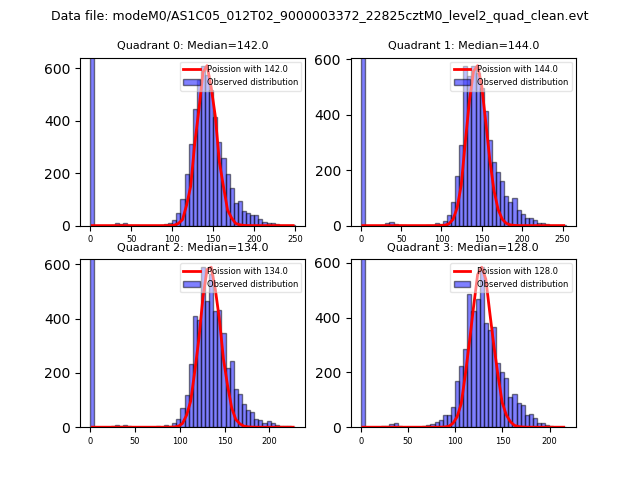
| Comparison with Poisson distribution Blue bars denote a histogram of data divided into 1 sec bins. Red curve is a Poisson curve with rate = median count rate of data. |
 |
 |
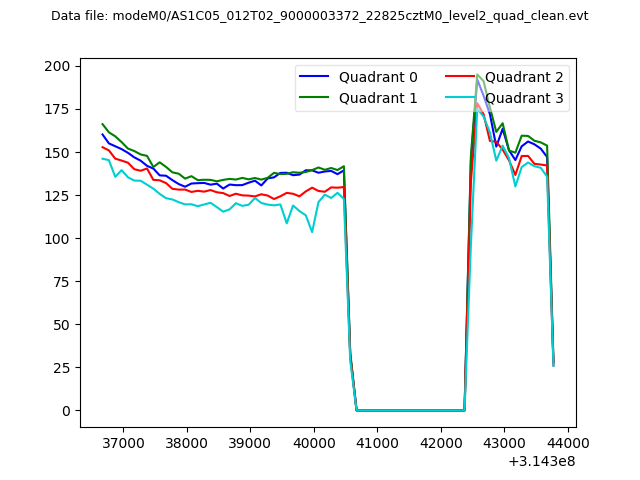
| Quadrant-wise count rates Data is divided into 100 sec bins |
 |
|
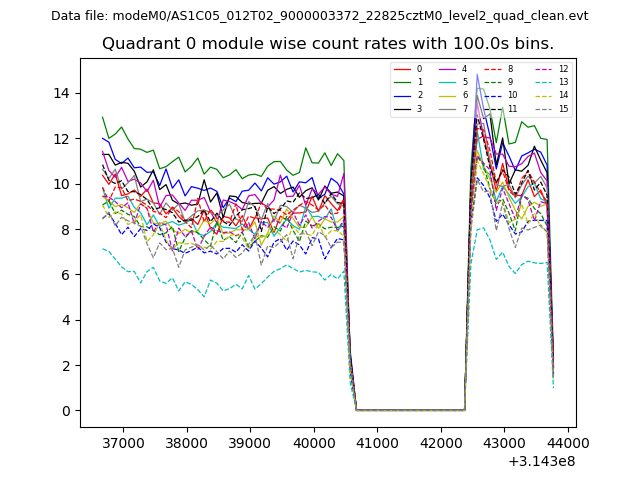
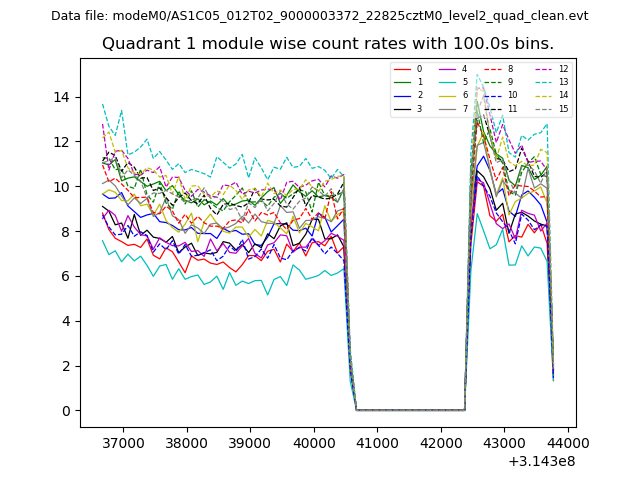
| Module-wise count rates for Quadrant A Data is divided into 100 sec bins |
 |
 |
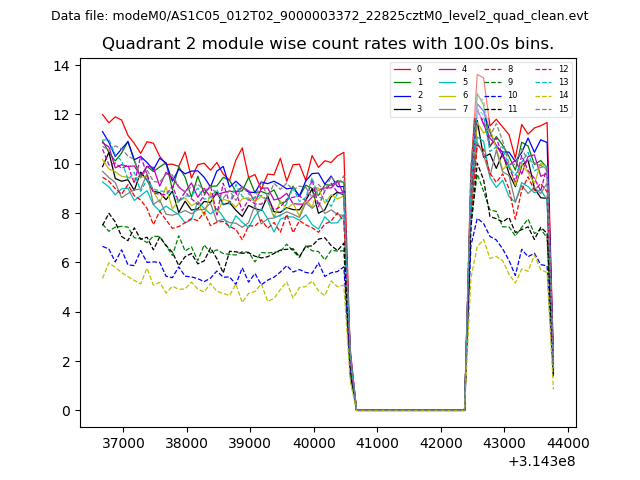
| Module-wise count rates for Quadrant B Data is divided into 100 sec bins |
 |
 |
| Module-wise count rates for Quadrant C Data is divided into 100 sec bins |
 |
 |
| Module-wise count rates for Quadrant D Data is divided into 100 sec bins |
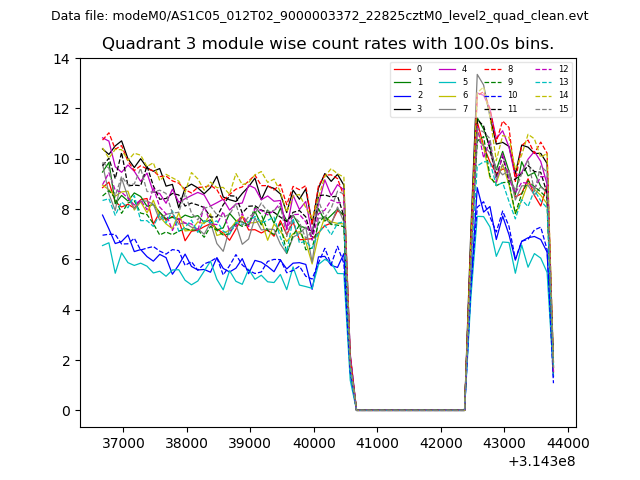 |
 |
| Parameter | Plot |
|---|---|
| CZT HV Monitor | 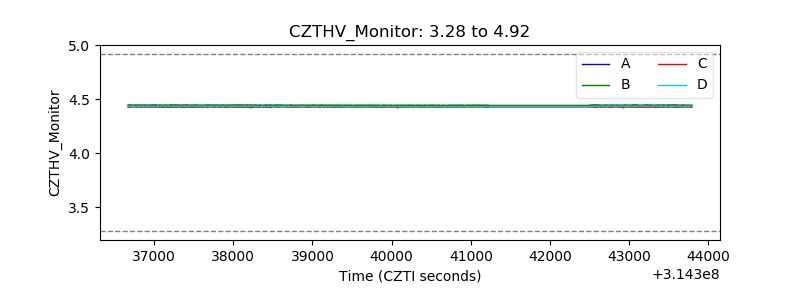 |
| D_VDD | 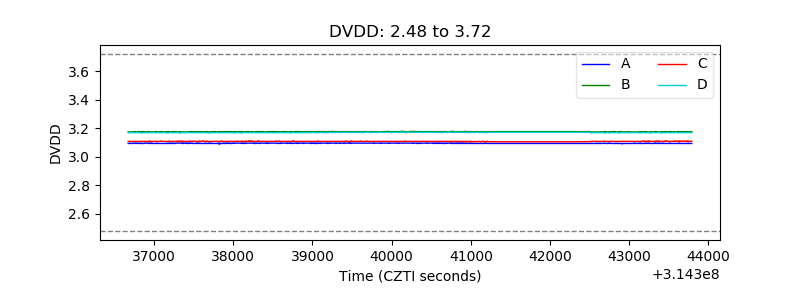 |
| Temperature 1 |  |
| Veto HV Monitor | 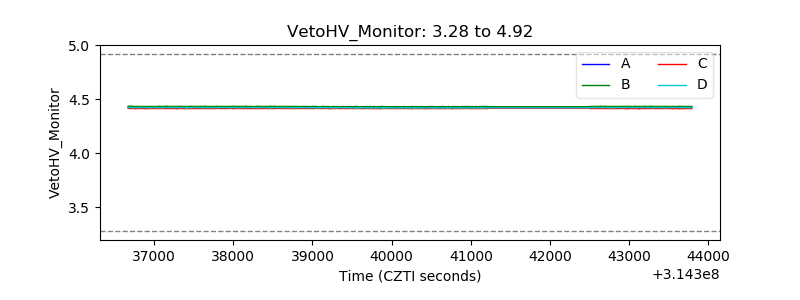 |
| Veto LLD | 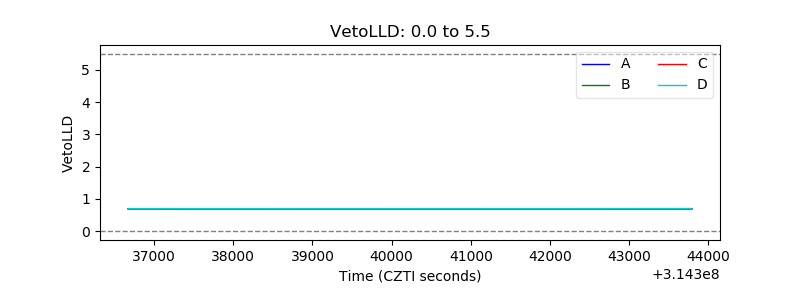 |
| Alpha Counter | 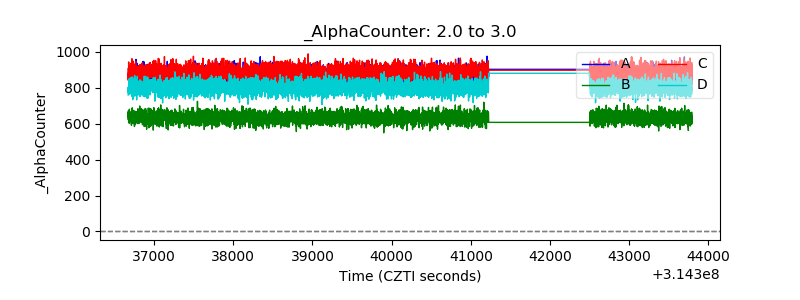 |
| _CPM_Rate | 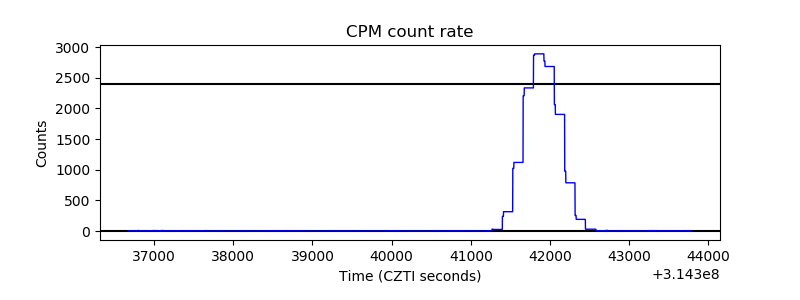 |
| CZT Counter |  |
| +2.5 Volts monitor |  |
| +5 Volts monitor | 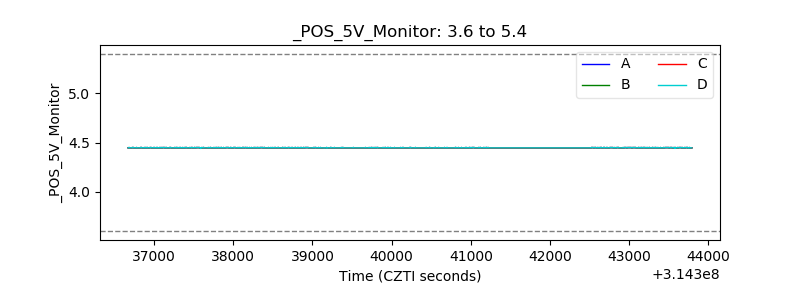 |
| _ROLL_ROT | 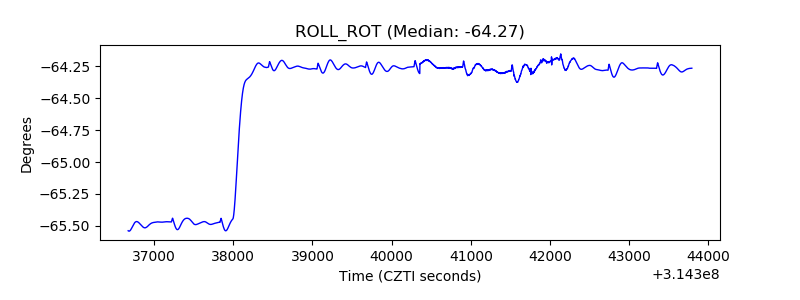 |
| _Roll_DEC | 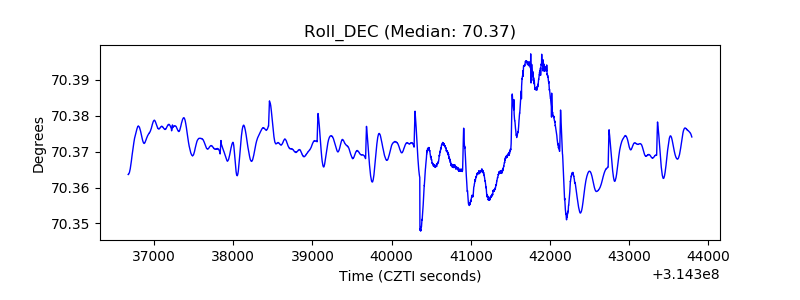 |
| _Roll_RA | 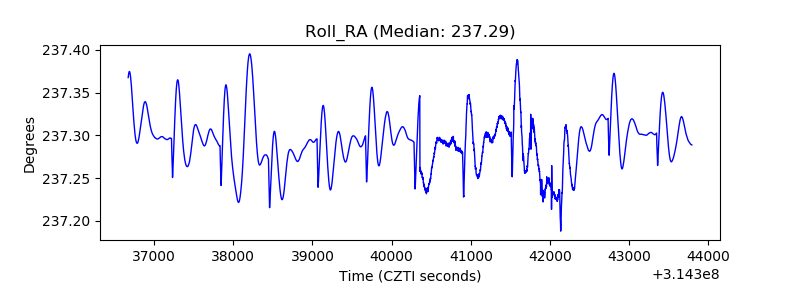 |
| Veto Counter | 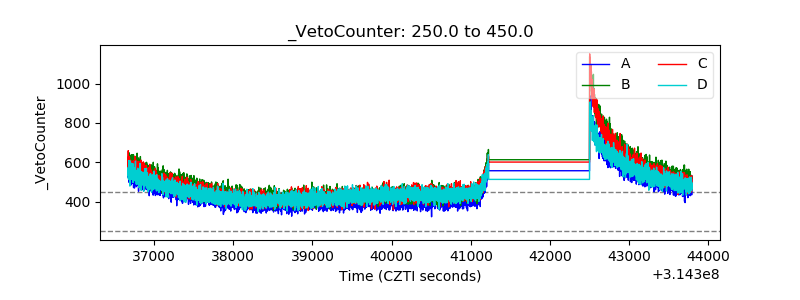 |