| Param | Original file | Final file |
|---|---|---|
| Filename | modeM0/AS1C05_012T02_9000003372_22827cztM0_level2.evt | modeM0/AS1C05_012T02_9000003372_22827cztM0_level2_quad_clean.evt |
| Size (bytes) | 416,229,120 | 101,226,240 |
| Size | 396.9 MB | 96.5 MB |
| Events in quadrant A | 3,065,399 | 691,767 |
| Events in quadrant B | 2,847,703 | 697,224 |
| Events in quadrant C | 2,776,301 | 643,625 |
| Events in quadrant D | 3,529,271 | 635,234 |
| Mode M0 | |||
|---|---|---|---|
| Quadrant | BADHDUFLAG | Total packets | Discarded packets |
| A | 0 | 12527 | 1 |
| B | 0 | 11861 | 1 |
| C | 0 | 11712 | 1 |
| D | 0 | 14177 | 1 |
| Mode M9 | |||
|---|---|---|---|
| Quadrant | BADHDUFLAG | Total packets | Discarded packets |
| A | 0 | 14 | 0 |
| B | 0 | 14 | 0 |
| C | 0 | 14 | 0 |
| D | 0 | 14 | 0 |
| Mode SS | |||
|---|---|---|---|
| Quadrant | BADHDUFLAG | Total packets | Discarded packets |
| A | 0 | 114 | 0 |
| B | 0 | 114 | 0 |
| C | 0 | 114 | 0 |
| D | 0 | 114 | 0 |
| Quadrant | Total seconds | Saturated seconds | Saturation percentage |
|---|---|---|---|
| A | 5696 | 57 | 1.000702% |
| B | 5697 | 42 | 0.737230% |
| C | 5697 | 58 | 1.018080% |
| D | 5697 | 127 | 2.229243% |
Noise dominated data is calculated using 1-second bins in cleaned event files. If a bin has >2000 counts, and if more than 50% of those come from <1% of pixels, then it is considered to be noise-dominated and hence unusable.
| Quadrant | # 1 sec bins | Bins with >0 counts | Bins with >2000 counts | High rate bins dominated by noise | Noise dominated (total time) | Noise dominated (detector-on time) | Marked lightcurve |
|---|---|---|---|---|---|---|---|
| A | 7016 | 5697 | 0 | 0 | 0.00% | 0.00% | 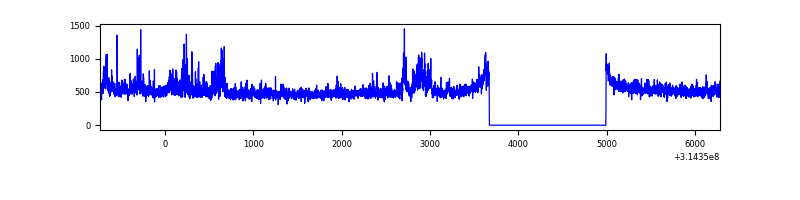 |
| B | 7017 | 5698 | 1 | 1 | 0.01% | 0.02% | 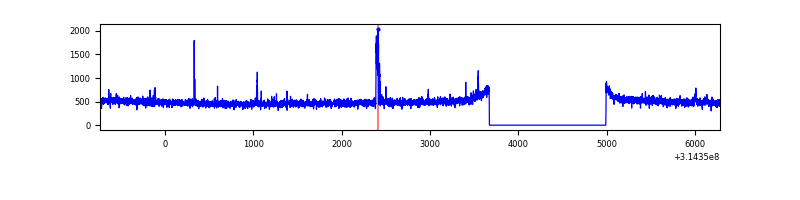 |
| C | 7017 | 5698 | 1 | 1 | 0.01% | 0.02% | 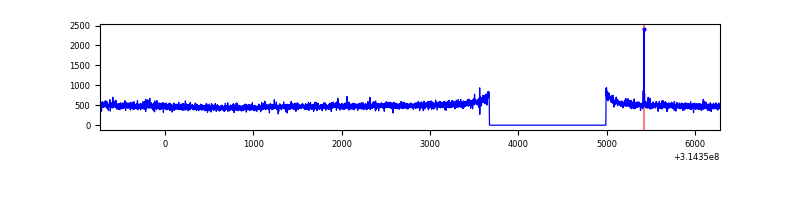 |
| D | 7017 | 5698 | 71 | 71 | 1.01% | 1.25% | 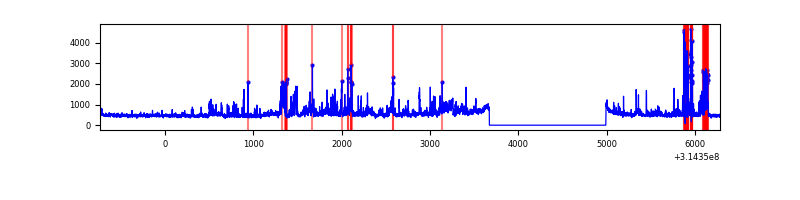 |
Top three noisy pixels from each quadrant. If the there are fewer than three noisy pixels in the level2.evt file, extra rows are filled as -1
| Pixel properties | Quadrant properties | ||||||
|---|---|---|---|---|---|---|---|
| Quadrant | DetID | PixID | Counts | Sigma | Mean | Median | Sigma |
| A | 11 | 47 | 248698 | 1721.42 | 730 | 718 | 144.1 |
| A | 13 | 254 | 9954 | 64.11 | 730 | 718 | 144.1 |
| A | 0 | 226 | 6450 | 39.79 | 730 | 718 | 144.1 |
| B | 0 | 230 | 41635 | 308.88 | 715 | 700 | 132.5 |
| B | 12 | 111 | 15424 | 111.1 | 715 | 700 | 132.5 |
| B | 11 | 111 | 14107 | 101.16 | 715 | 700 | 132.5 |
| C | 14 | 238 | 113362 | 723.89 | 679 | 684 | 155.7 |
| C | 10 | 22 | 9643 | 57.56 | 679 | 684 | 155.7 |
| C | 13 | 61 | 4773 | 26.27 | 679 | 684 | 155.7 |
| D | 7 | 238 | 351755 | 2100.72 | 696 | 674 | 167.1 |
| D | 1 | 52 | 262202 | 1564.87 | 696 | 674 | 167.1 |
| D | 2 | 136 | 151400 | 901.88 | 696 | 674 | 167.1 |
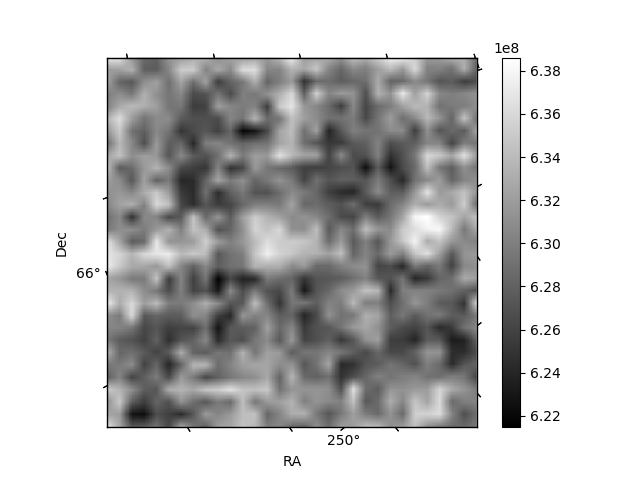
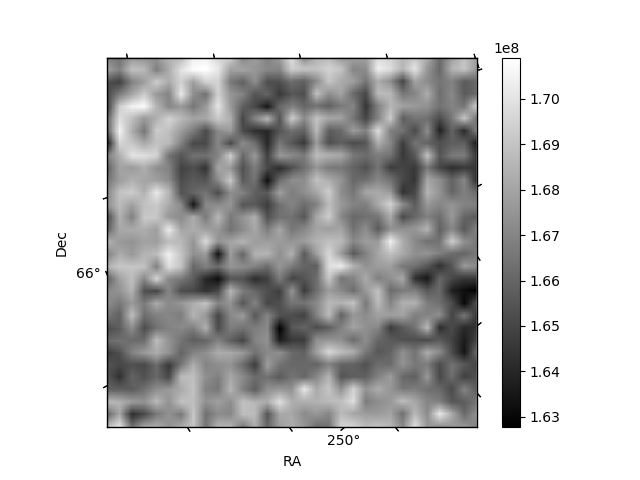
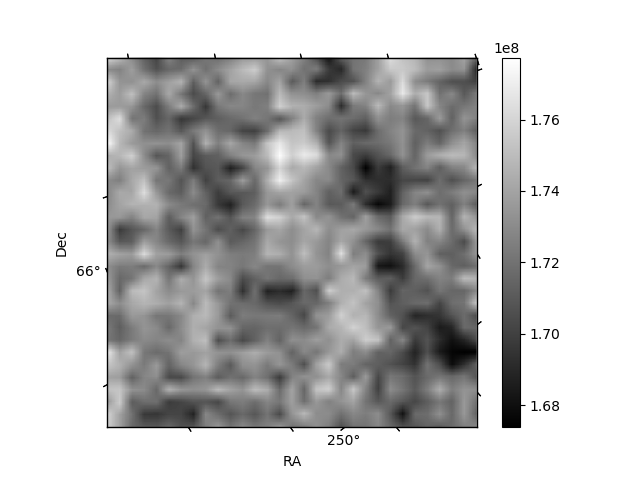
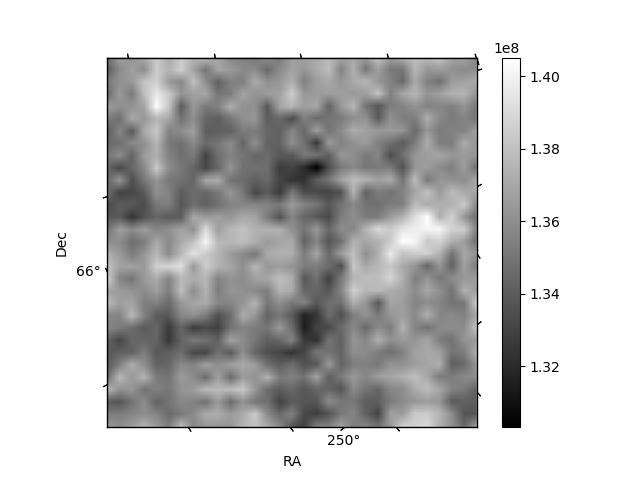
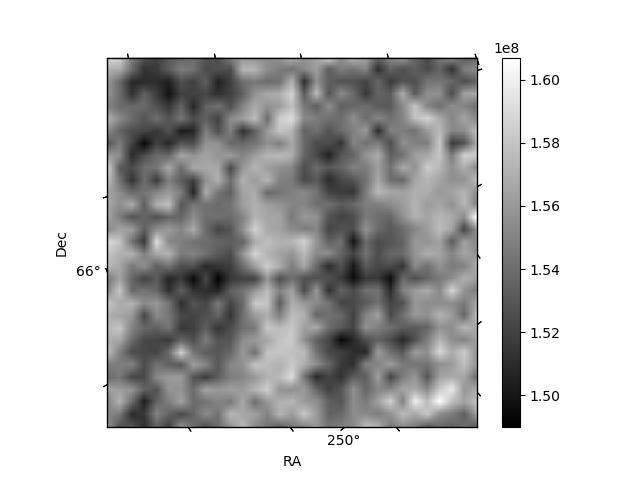
Histogram calculated using DETX and DETY for each event in the final _common_clean file
| Quadrant A | 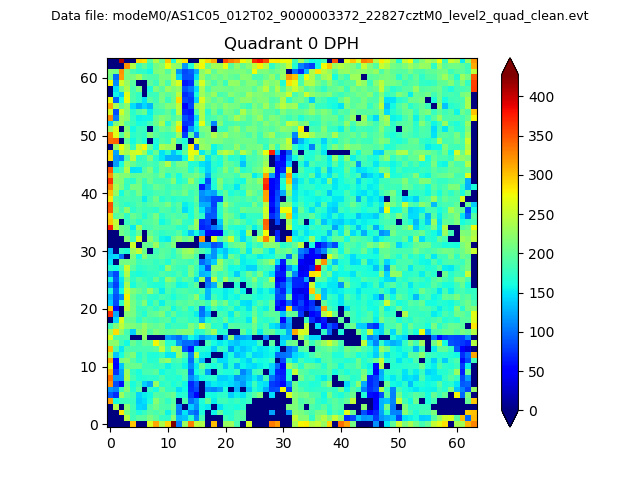 |
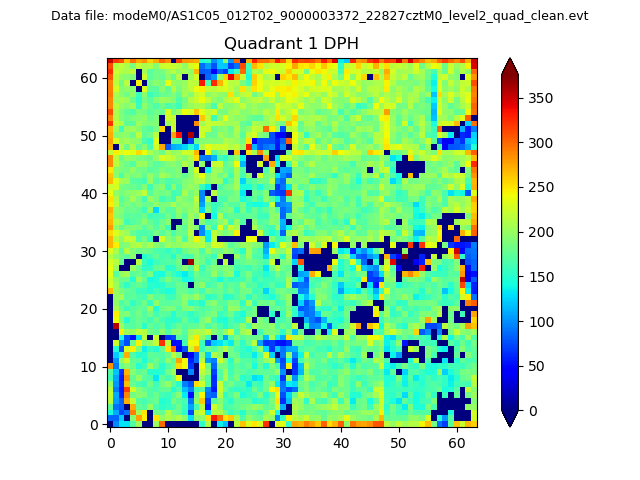 |
Quadrant B |
|---|---|---|---|
| Quadrant D | 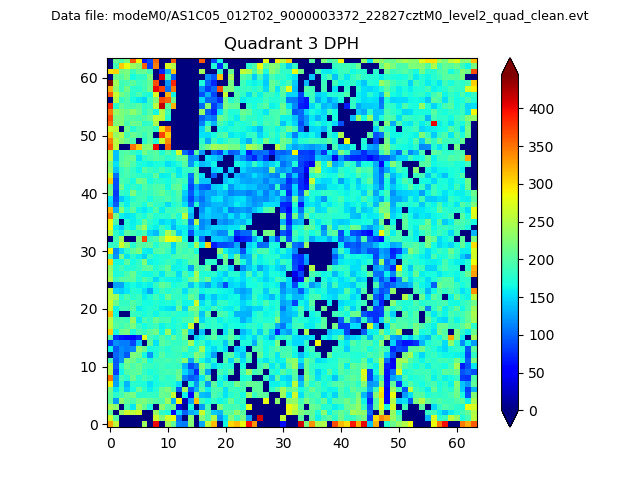 |
 |
Quadrant C |
| Plot type | Count rate plots | Images |
|---|---|---|
| Comparison with Poisson distribution Blue bars denote a histogram of data divided into 1 sec bins. Red curve is a Poisson curve with rate = median count rate of data. |
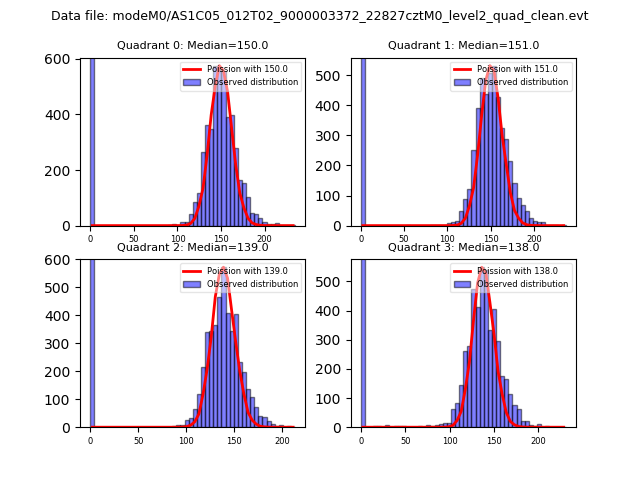 |
 |
| Quadrant-wise count rates Data is divided into 100 sec bins |
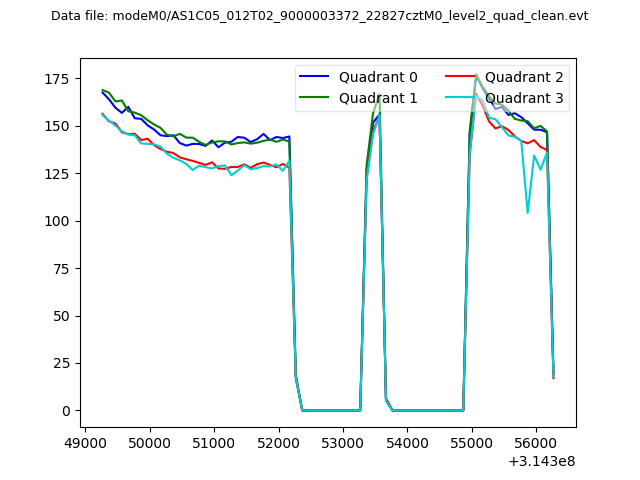 |
|
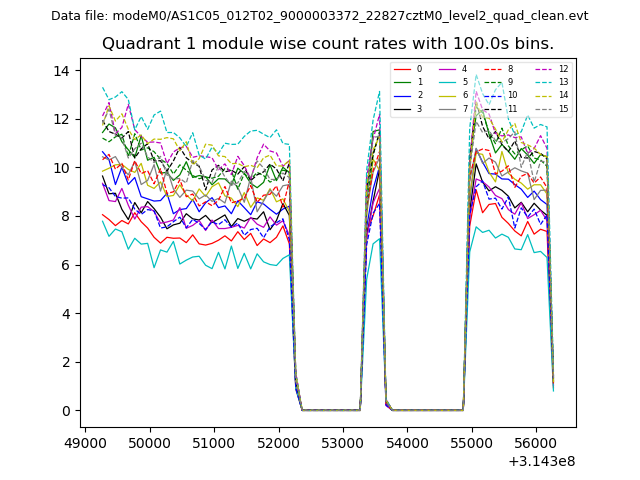
| Module-wise count rates for Quadrant A Data is divided into 100 sec bins |
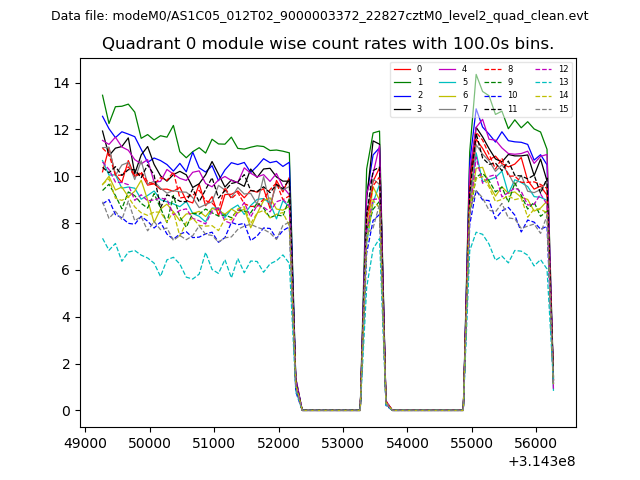 |
 |
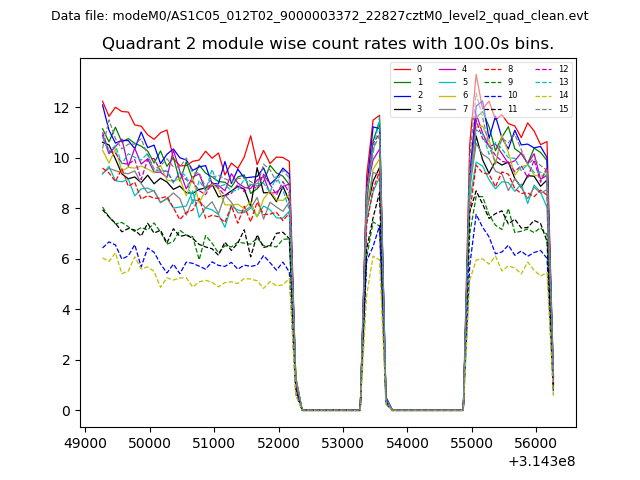
| Module-wise count rates for Quadrant B Data is divided into 100 sec bins |
 |
 |
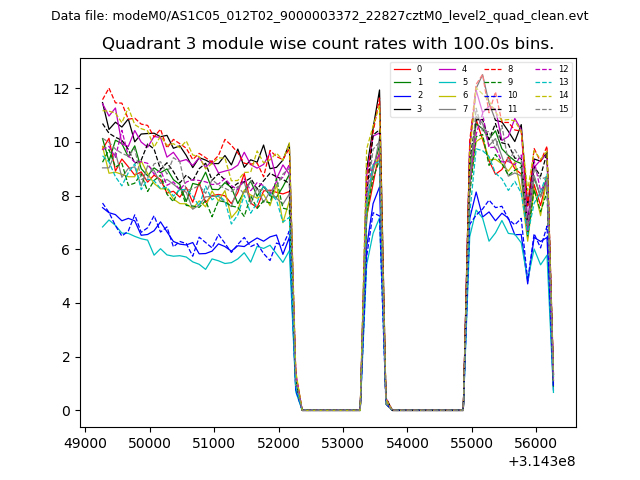
| Module-wise count rates for Quadrant C Data is divided into 100 sec bins |
 |
 |
| Module-wise count rates for Quadrant D Data is divided into 100 sec bins |
 |
 |
| Parameter | Plot |
|---|---|
| CZT HV Monitor | 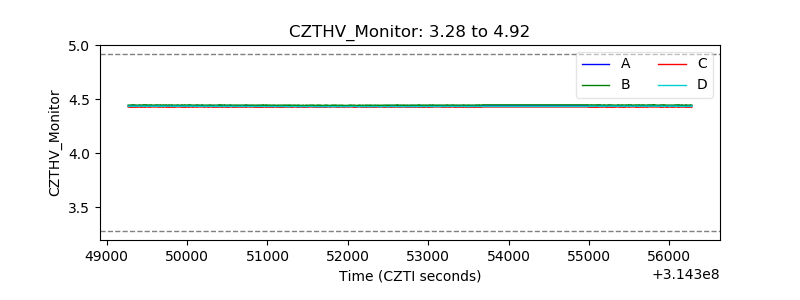 |
| D_VDD | 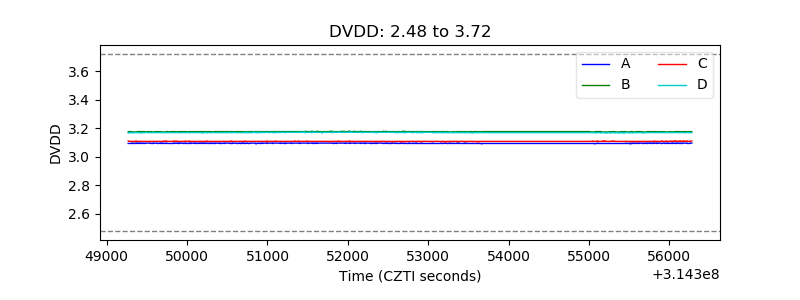 |
| Temperature 1 | 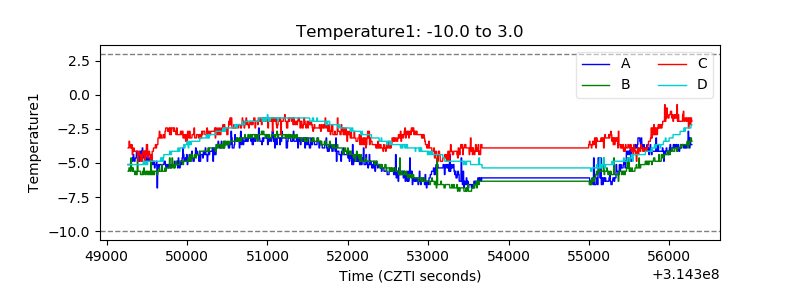 |
| Veto HV Monitor | 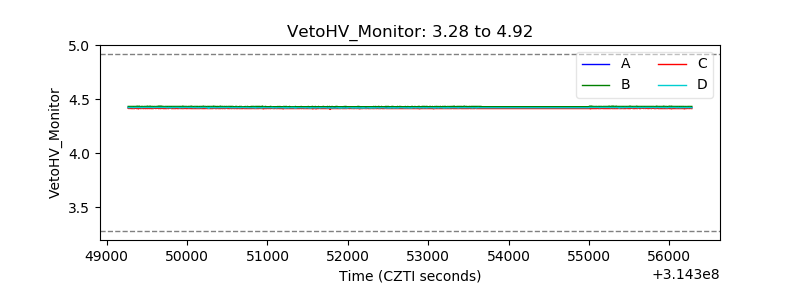 |
| Veto LLD | 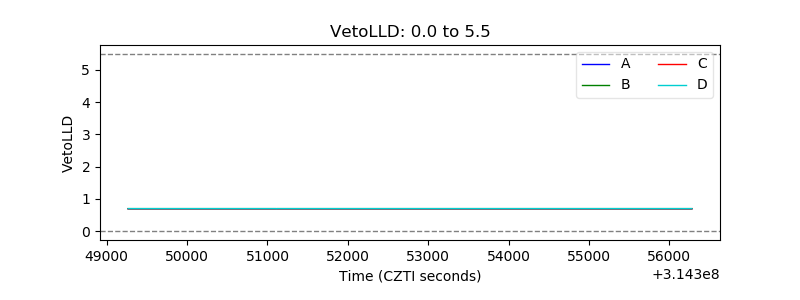 |
| Alpha Counter | 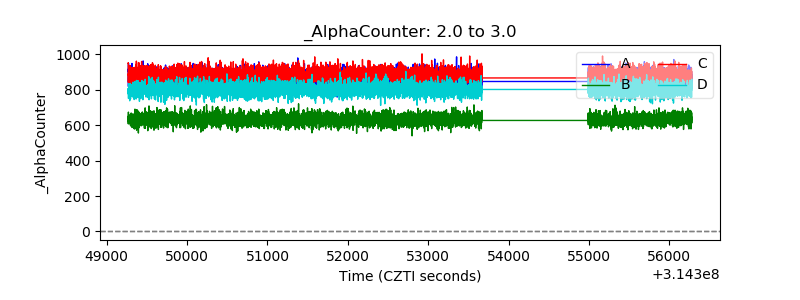 |
| _CPM_Rate | 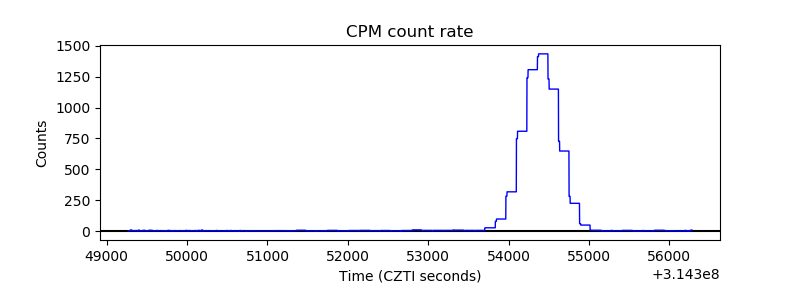 |
| CZT Counter | 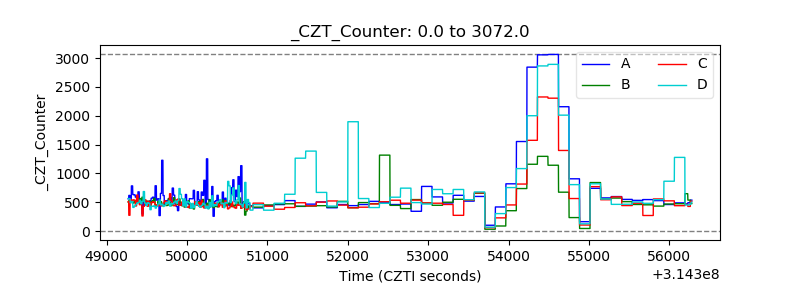 |
| +2.5 Volts monitor |  |
| +5 Volts monitor | 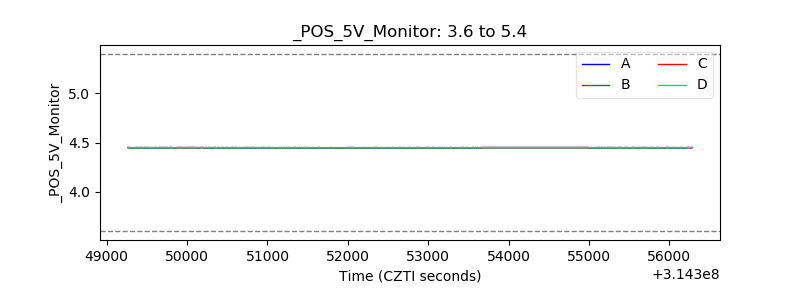 |
| _ROLL_ROT | 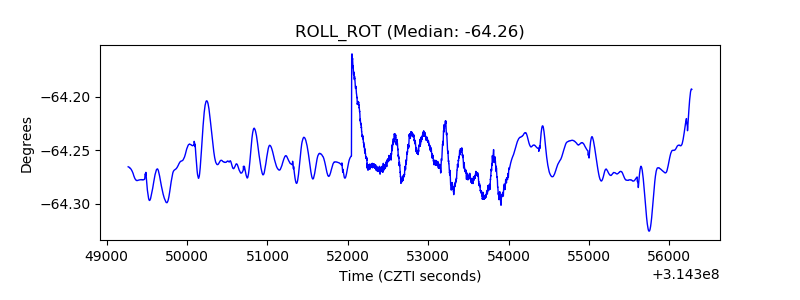 |
| _Roll_DEC | 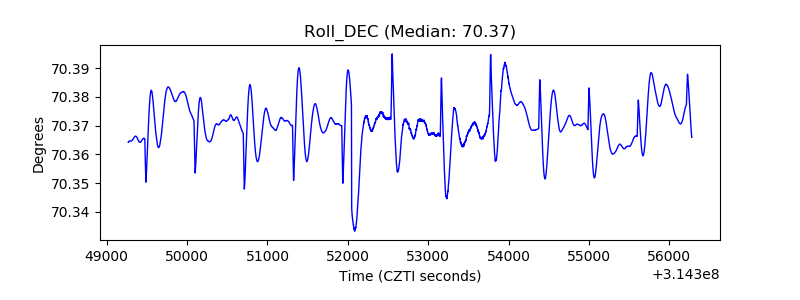 |
| _Roll_RA | 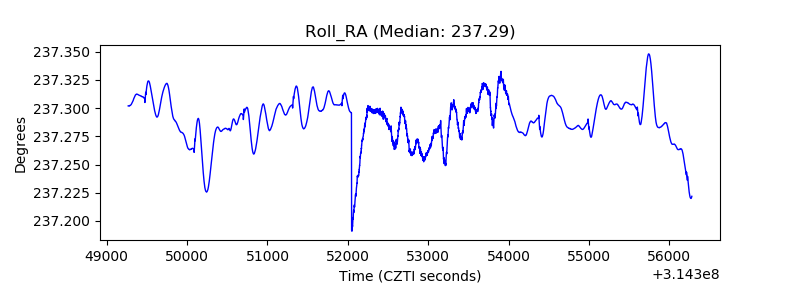 |
| Veto Counter | 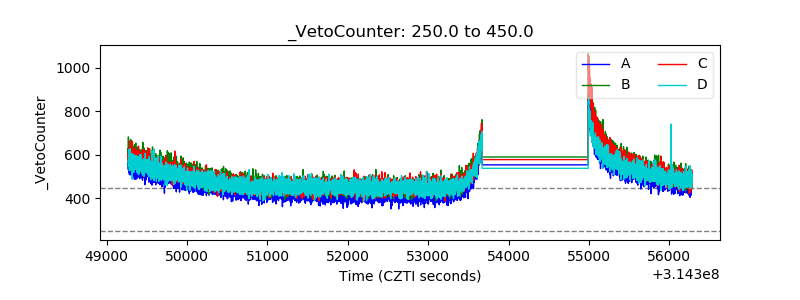 |