| Param | Original file | Final file |
|---|---|---|
| Filename | modeM0/AS1C05_012T02_9000003372_22831cztM0_level2.evt | modeM0/AS1C05_012T02_9000003372_22831cztM0_level2_quad_clean.evt |
| Size (bytes) | 503,622,720 | 115,444,800 |
| Size | 480.3 MB | 110.1 MB |
| Events in quadrant A | 3,307,649 | 771,003 |
| Events in quadrant B | 3,322,713 | 778,122 |
| Events in quadrant C | 3,275,320 | 732,703 |
| Events in quadrant D | 4,862,061 | 717,743 |
| Mode M0 | |||
|---|---|---|---|
| Quadrant | BADHDUFLAG | Total packets | Discarded packets |
| A | 0 | 14542 | 1 |
| B | 0 | 14578 | 1 |
| C | 0 | 14477 | 2 |
| D | 0 | 19225 | 1 |
| Mode M9 | |||
|---|---|---|---|
| Quadrant | BADHDUFLAG | Total packets | Discarded packets |
| A | 0 | 3 | 0 |
| B | 0 | 3 | 0 |
| C | 0 | 3 | 0 |
| D | 0 | 3 | 0 |
| Mode SS | |||
|---|---|---|---|
| Quadrant | BADHDUFLAG | Total packets | Discarded packets |
| A | 0 | 144 | 0 |
| B | 0 | 144 | 0 |
| C | 0 | 144 | 0 |
| D | 0 | 144 | 0 |
| Quadrant | Total seconds | Saturated seconds | Saturation percentage |
|---|---|---|---|
| A | 7139 | 42 | 0.588318% |
| B | 7140 | 55 | 0.770308% |
| C | 7139 | 88 | 1.232666% |
| D | 7139 | 113 | 1.582855% |
Noise dominated data is calculated using 1-second bins in cleaned event files. If a bin has >2000 counts, and if more than 50% of those come from <1% of pixels, then it is considered to be noise-dominated and hence unusable.
| Quadrant | # 1 sec bins | Bins with >0 counts | Bins with >2000 counts | High rate bins dominated by noise | Noise dominated (total time) | Noise dominated (detector-on time) | Marked lightcurve |
|---|---|---|---|---|---|---|---|
| A | 7434 | 7140 | 0 | 0 | 0.00% | 0.00% | 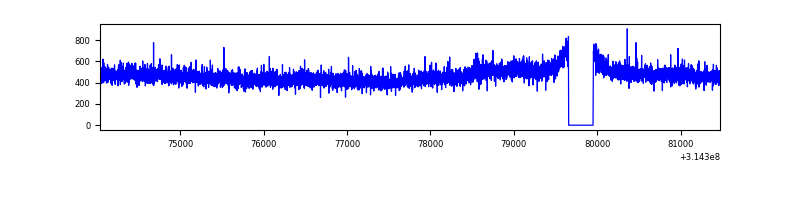 |
| B | 7435 | 7141 | 0 | 0 | 0.00% | 0.00% | 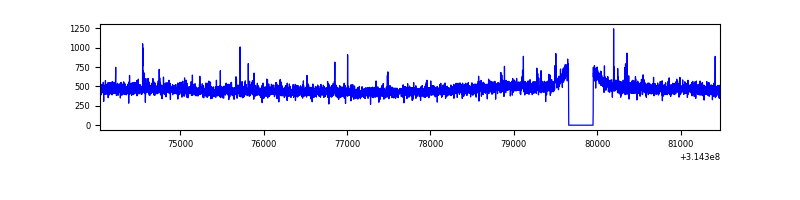 |
| C | 7434 | 7140 | 0 | 0 | 0.00% | 0.00% | 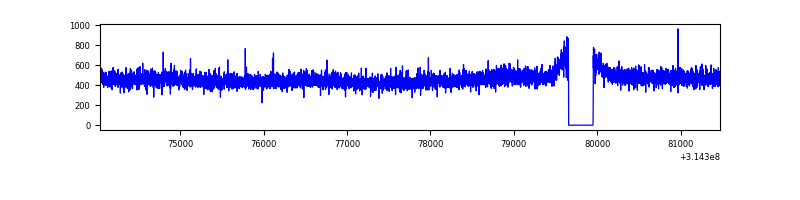 |
| D | 7434 | 7140 | 53 | 53 | 0.71% | 0.74% | 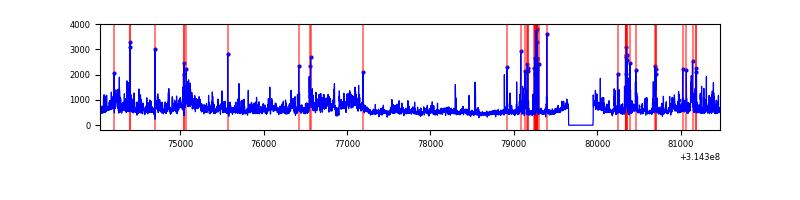 |
Top three noisy pixels from each quadrant. If the there are fewer than three noisy pixels in the level2.evt file, extra rows are filled as -1
| Pixel properties | Quadrant properties | ||||||
|---|---|---|---|---|---|---|---|
| Quadrant | DetID | PixID | Counts | Sigma | Mean | Median | Sigma |
| A | 13 | 252 | 39751 | 228.63 | 847 | 828 | 170.2 |
| A | 13 | 254 | 12515 | 68.65 | 847 | 828 | 170.2 |
| A | 3 | 137 | 7353 | 38.33 | 847 | 828 | 170.2 |
| B | 12 | 111 | 19284 | 115.85 | 838 | 816 | 159.4 |
| B | 11 | 111 | 17279 | 103.28 | 838 | 816 | 159.4 |
| B | 0 | 230 | 15598 | 92.73 | 838 | 816 | 159.4 |
| C | 14 | 238 | 129302 | 685.55 | 804 | 806 | 187.4 |
| C | 13 | 61 | 5688 | 26.05 | 804 | 806 | 187.4 |
| C | 8 | 128 | 4658 | 20.55 | 804 | 806 | 187.4 |
| D | 1 | 52 | 762656 | 3817.3 | 821 | 796 | 199.6 |
| D | 12 | 227 | 363739 | 1818.53 | 821 | 796 | 199.6 |
| D | 7 | 238 | 241275 | 1204.92 | 821 | 796 | 199.6 |
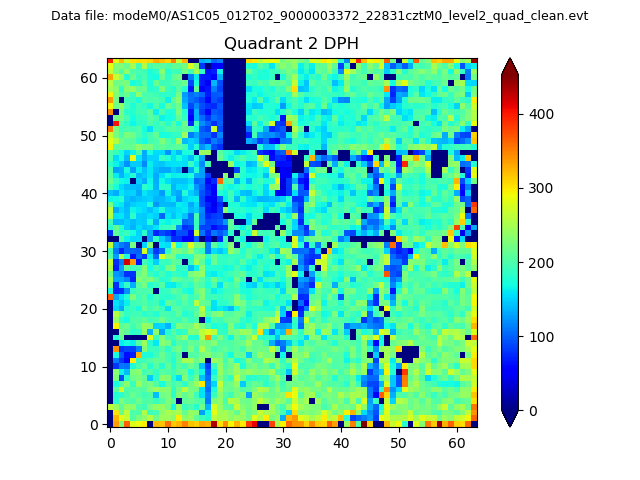
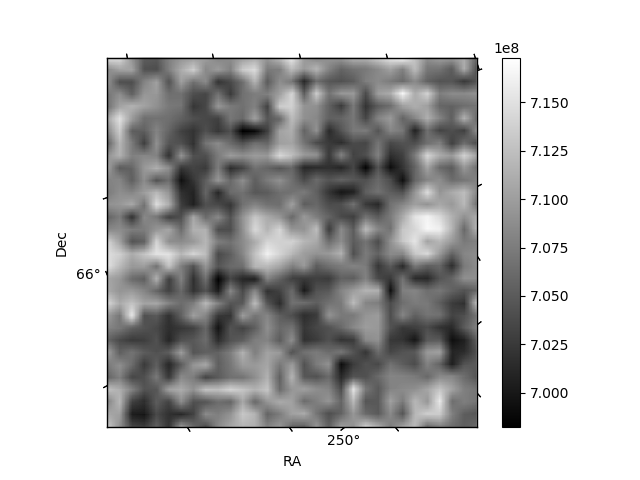
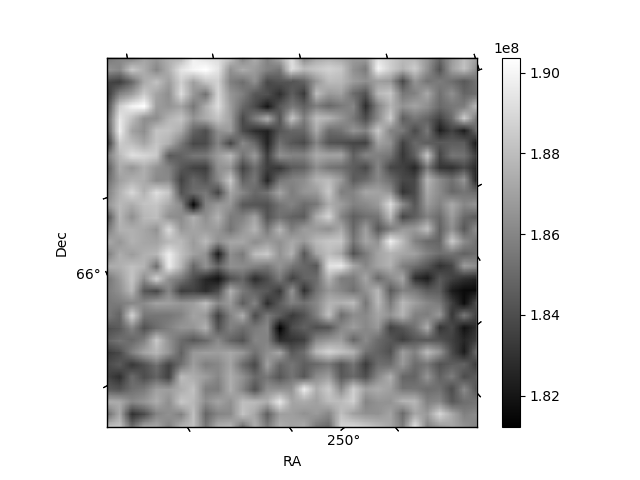
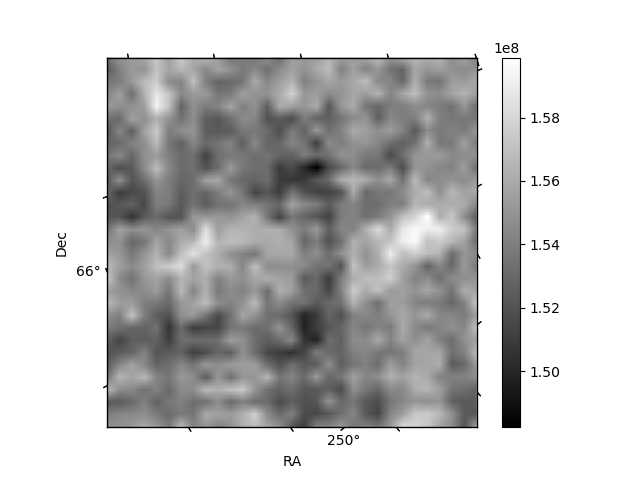
Histogram calculated using DETX and DETY for each event in the final _common_clean file
| Quadrant A | 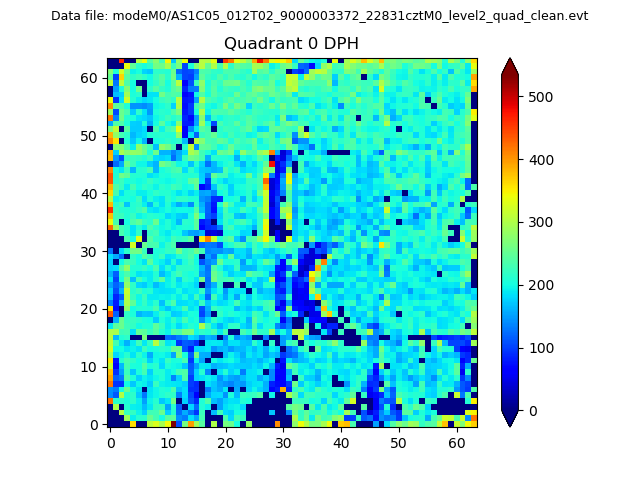 |
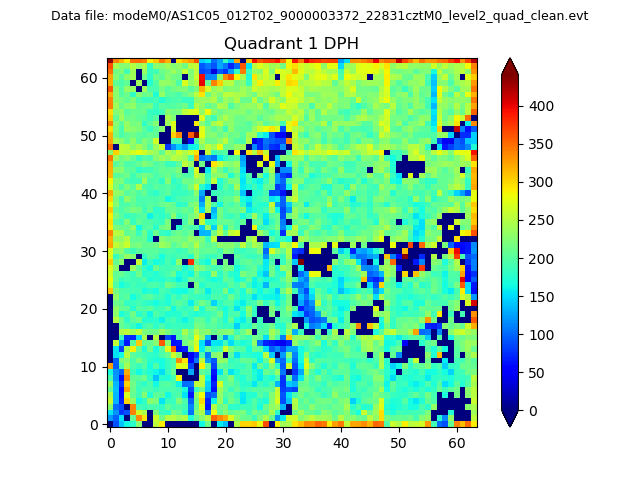 |
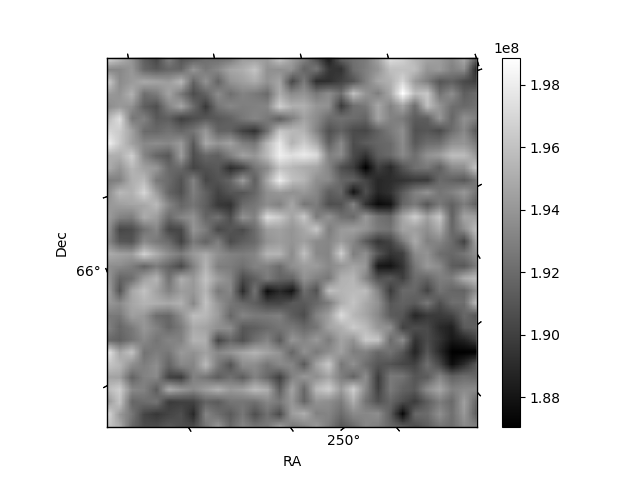
Quadrant B |
|---|---|---|---|
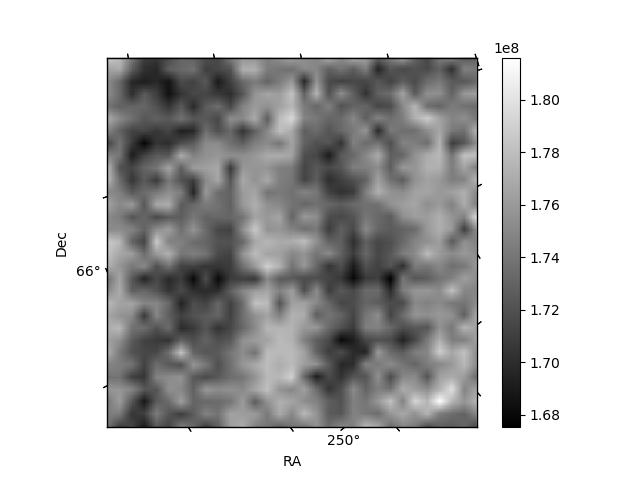
| Quadrant D | 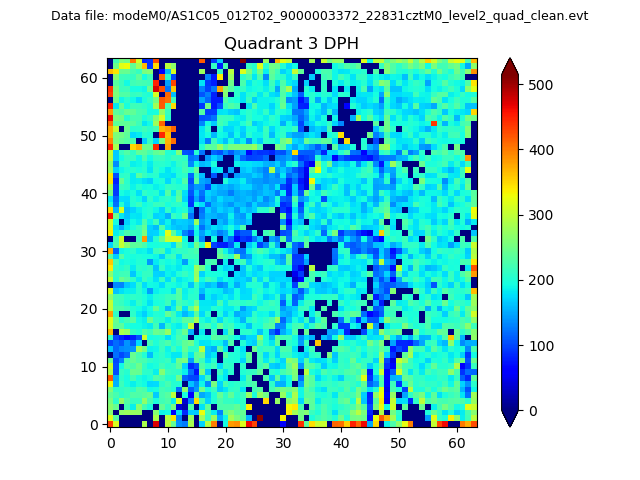 |
 |
Quadrant C |
| Plot type | Count rate plots | Images |
|---|---|---|
| Comparison with Poisson distribution Blue bars denote a histogram of data divided into 1 sec bins. Red curve is a Poisson curve with rate = median count rate of data. |
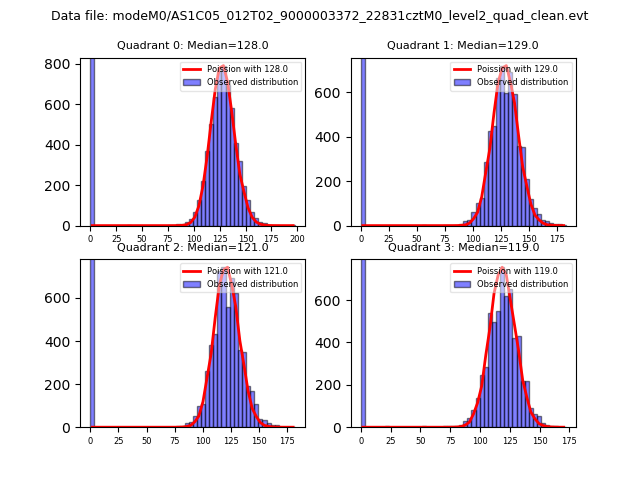 |
 |
| Quadrant-wise count rates Data is divided into 100 sec bins |
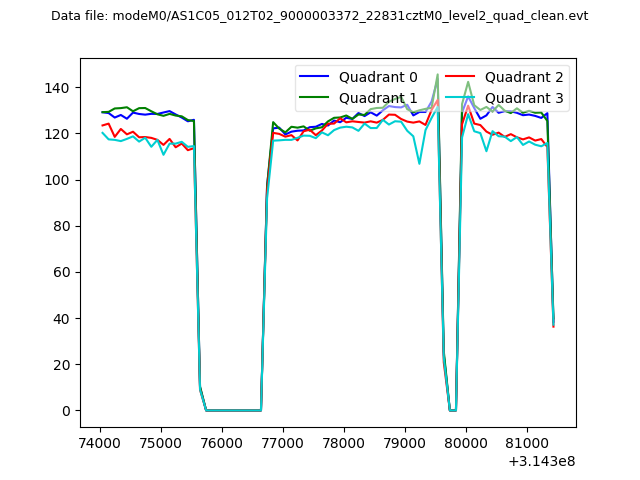 |
|
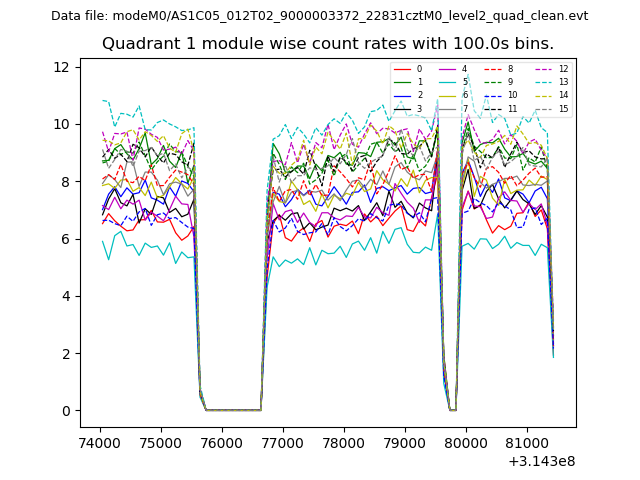
| Module-wise count rates for Quadrant A Data is divided into 100 sec bins |
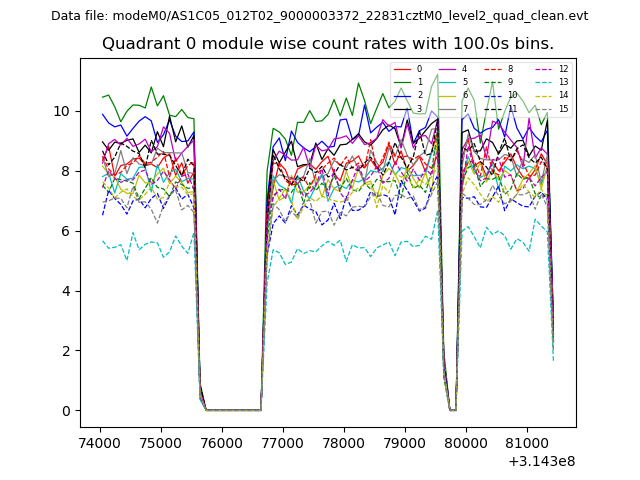 |
 |
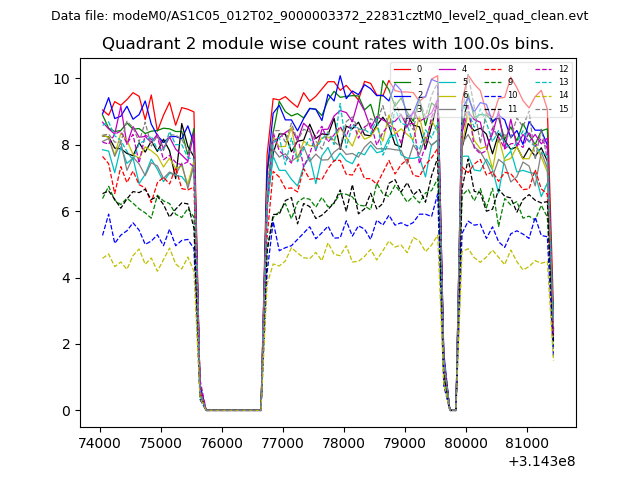
| Module-wise count rates for Quadrant B Data is divided into 100 sec bins |
 |
 |
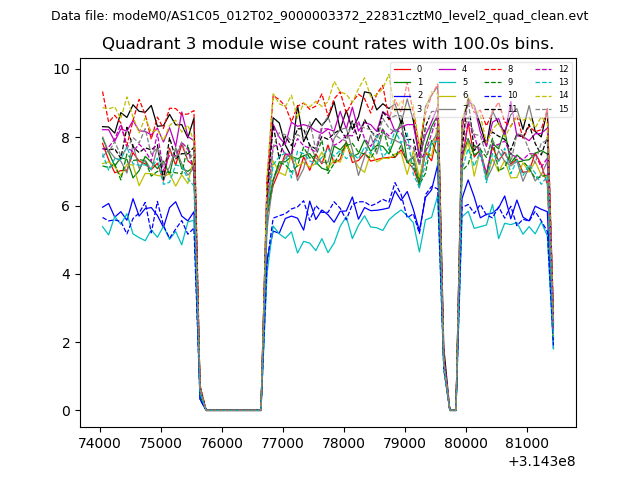
| Module-wise count rates for Quadrant C Data is divided into 100 sec bins |
 |
 |
| Module-wise count rates for Quadrant D Data is divided into 100 sec bins |
 |
 |
| Parameter | Plot |
|---|---|
| CZT HV Monitor | 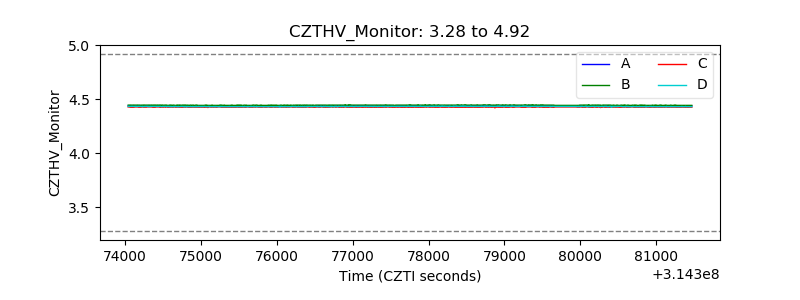 |
| D_VDD | 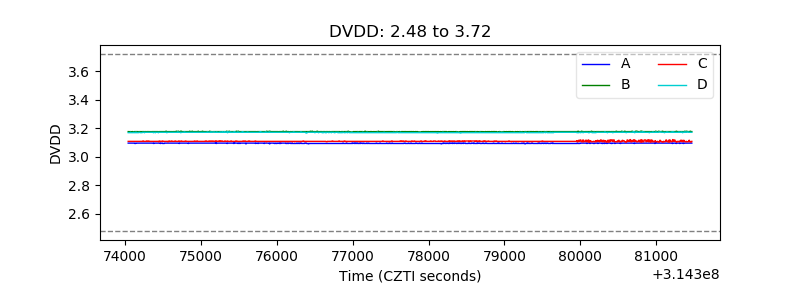 |
| Temperature 1 | 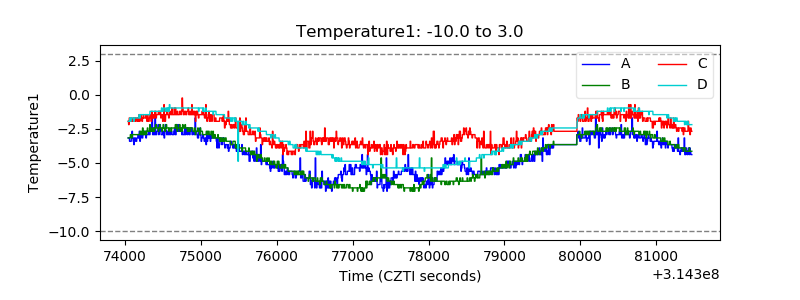 |
| Veto HV Monitor | 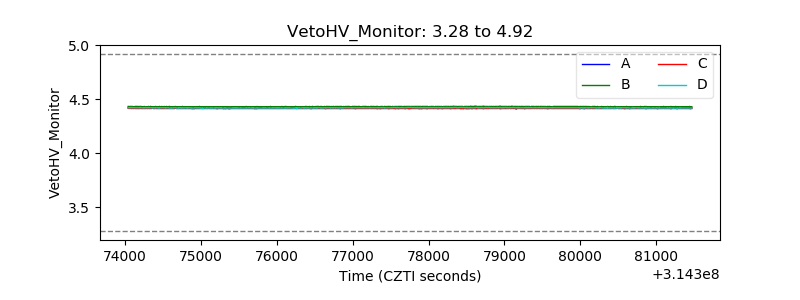 |
| Veto LLD | 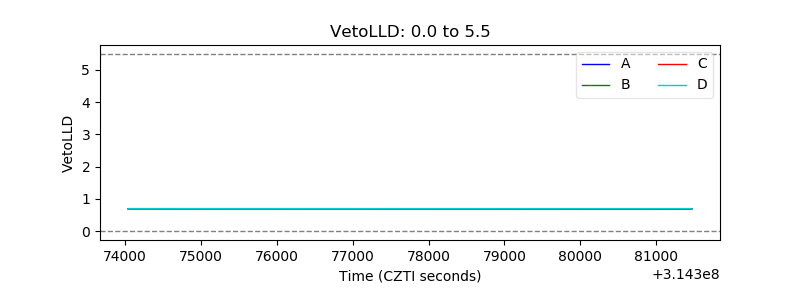 |
| Alpha Counter | 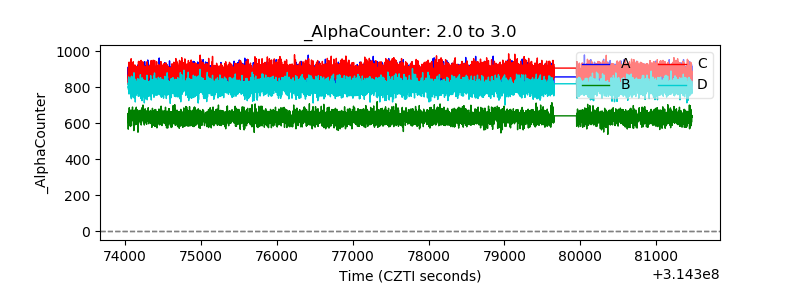 |
| _CPM_Rate | 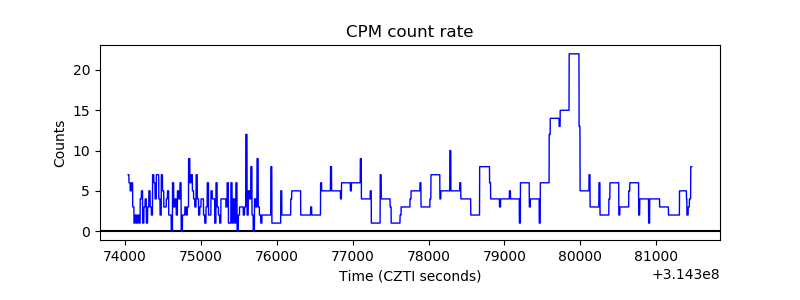 |
| CZT Counter | 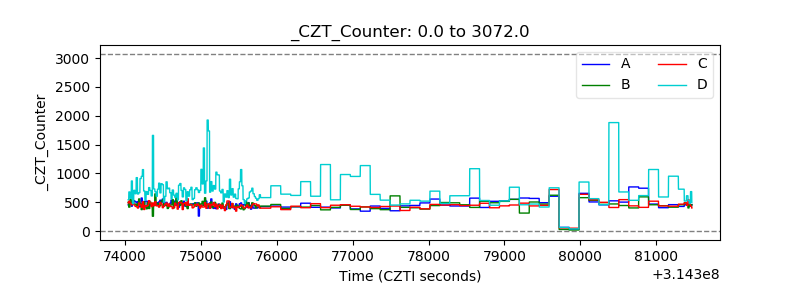 |
| +2.5 Volts monitor |  |
| +5 Volts monitor |  |
| _ROLL_ROT | 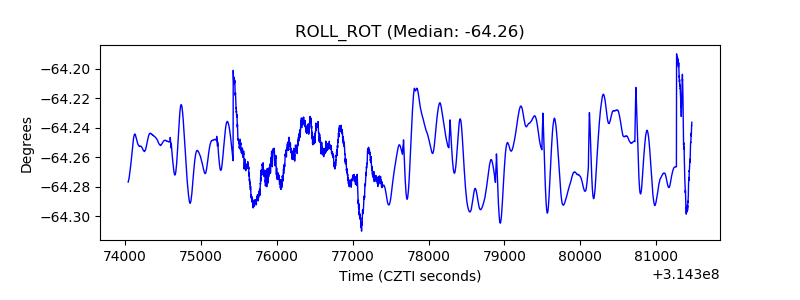 |
| _Roll_DEC | 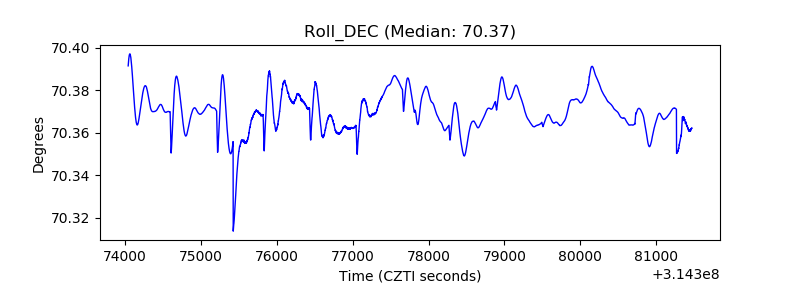 |
| _Roll_RA | 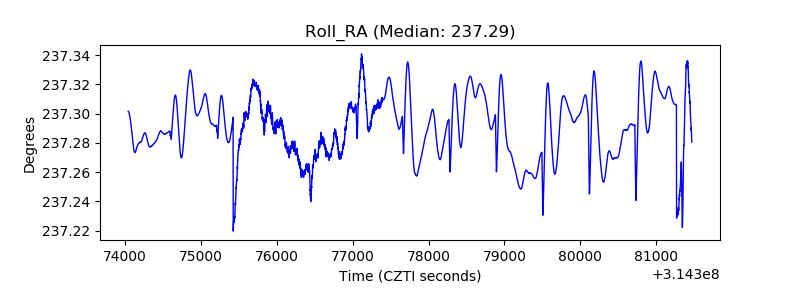 |
| Veto Counter | 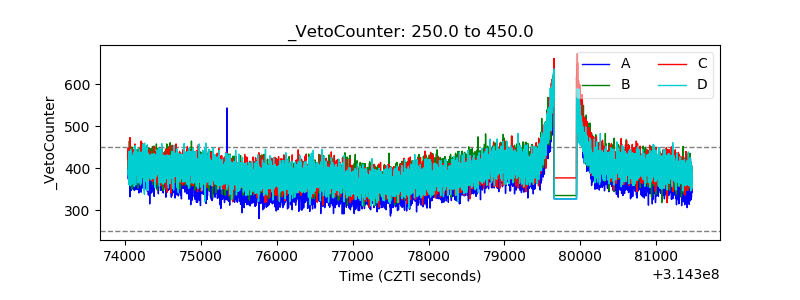 |