| Param | Original file | Final file |
|---|---|---|
| Filename | modeM0/AS1C05_012T02_9000003372_22835cztM0_level2.evt | modeM0/AS1C05_012T02_9000003372_22835cztM0_level2_quad_clean.evt |
| Size (bytes) | 706,579,200 | 160,715,520 |
| Size | 673.8 MB | 153.3 MB |
| Events in quadrant A | 4,803,388 | 1,048,318 |
| Events in quadrant B | 4,886,026 | 1,061,242 |
| Events in quadrant C | 4,840,036 | 1,017,393 |
| Events in quadrant D | 6,144,479 | 1,000,362 |
| Mode M0 | |||
|---|---|---|---|
| Quadrant | BADHDUFLAG | Total packets | Discarded packets |
| A | 0 | 21622 | 1 |
| B | 0 | 21758 | 1 |
| C | 0 | 21625 | 1 |
| D | 0 | 25668 | 1 |
| Mode M9 | |||
|---|---|---|---|
| Quadrant | BADHDUFLAG | Total packets | Discarded packets |
| A | 0 | 6 | 0 |
| B | 0 | 6 | 0 |
| C | 0 | 6 | 0 |
| D | 0 | 6 | 0 |
| Mode SS | |||
|---|---|---|---|
| Quadrant | BADHDUFLAG | Total packets | Discarded packets |
| A | 0 | 214 | 0 |
| B | 0 | 214 | 0 |
| C | 0 | 214 | 0 |
| D | 0 | 214 | 0 |
| Quadrant | Total seconds | Saturated seconds | Saturation percentage |
|---|---|---|---|
| A | 10700 | 23 | 0.214953% |
| B | 10701 | 36 | 0.336417% |
| C | 10701 | 86 | 0.803663% |
| D | 10701 | 157 | 1.467153% |
Noise dominated data is calculated using 1-second bins in cleaned event files. If a bin has >2000 counts, and if more than 50% of those come from <1% of pixels, then it is considered to be noise-dominated and hence unusable.
| Quadrant | # 1 sec bins | Bins with >0 counts | Bins with >2000 counts | High rate bins dominated by noise | Noise dominated (total time) | Noise dominated (detector-on time) | Marked lightcurve |
|---|---|---|---|---|---|---|---|
| A | 11210 | 10701 | 0 | 0 | 0.00% | 0.00% | 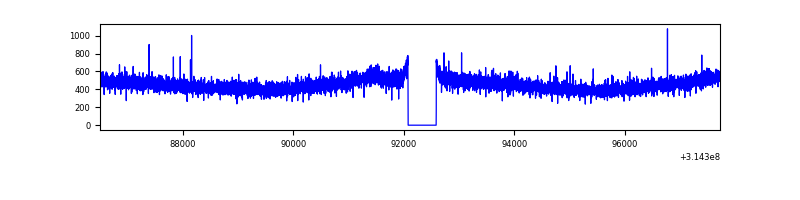 |
| B | 11211 | 10702 | 6 | 6 | 0.05% | 0.06% | 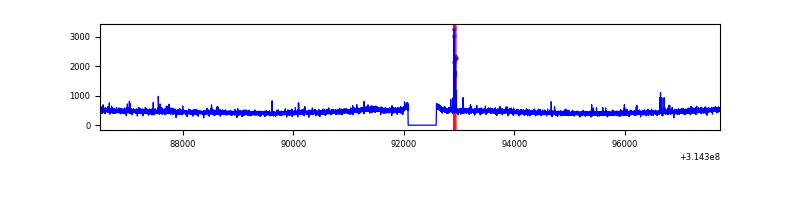 |
| C | 11211 | 10702 | 0 | 0 | 0.00% | 0.00% | 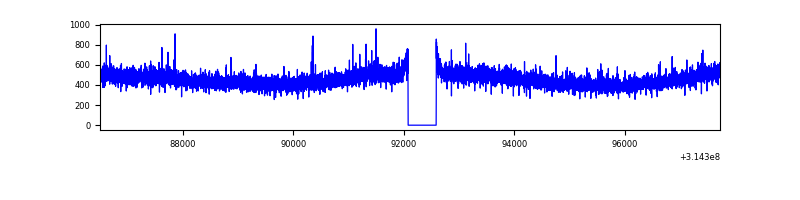 |
| D | 11211 | 10702 | 111 | 111 | 0.99% | 1.04% | 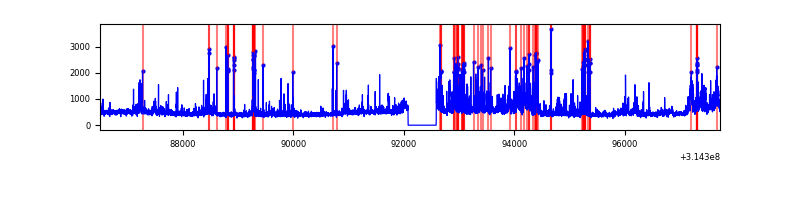 |
Top three noisy pixels from each quadrant. If the there are fewer than three noisy pixels in the level2.evt file, extra rows are filled as -1
| Pixel properties | Quadrant properties | ||||||
|---|---|---|---|---|---|---|---|
| Quadrant | DetID | PixID | Counts | Sigma | Mean | Median | Sigma |
| A | 13 | 254 | 19135 | 72.16 | 1241 | 1214 | 248.3 |
| A | 11 | 47 | 11360 | 40.85 | 1241 | 1214 | 248.3 |
| A | 3 | 137 | 11112 | 39.86 | 1241 | 1214 | 248.3 |
| B | 15 | 33 | 36062 | 148.86 | 1231 | 1198 | 234.2 |
| B | 12 | 111 | 28990 | 118.67 | 1231 | 1198 | 234.2 |
| B | 11 | 111 | 25845 | 105.24 | 1231 | 1198 | 234.2 |
| C | 14 | 238 | 190005 | 679.8 | 1188 | 1193 | 277.7 |
| C | 10 | 22 | 11938 | 38.69 | 1188 | 1193 | 277.7 |
| C | 0 | 239 | 9907 | 31.37 | 1188 | 1193 | 277.7 |
| D | 1 | 52 | 1101705 | 3773.83 | 1203 | 1168 | 291.6 |
| D | 10 | 230 | 130453 | 443.33 | 1203 | 1168 | 291.6 |
| D | 7 | 238 | 108555 | 368.24 | 1203 | 1168 | 291.6 |
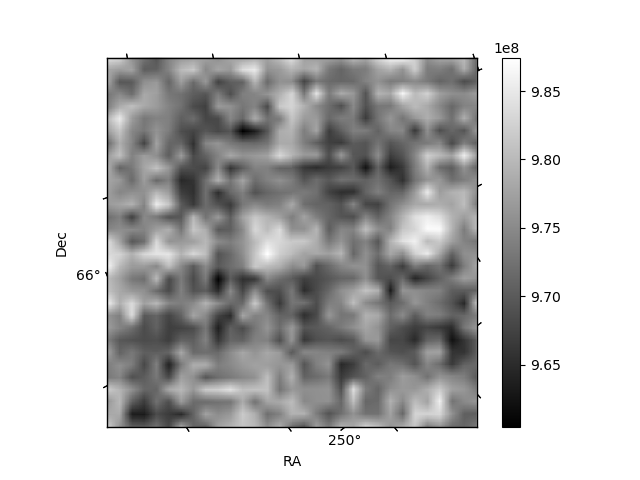
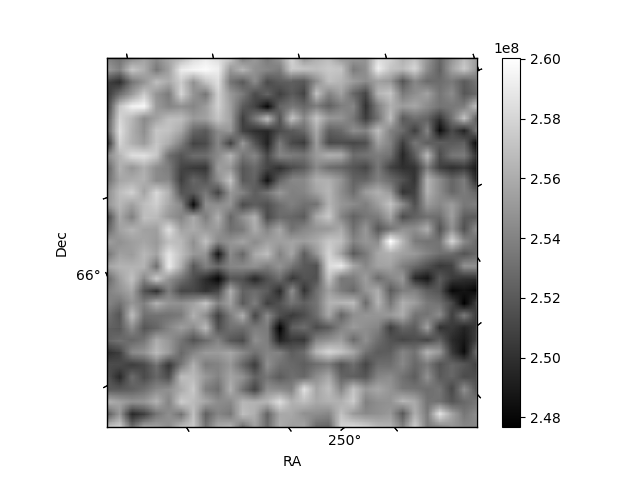
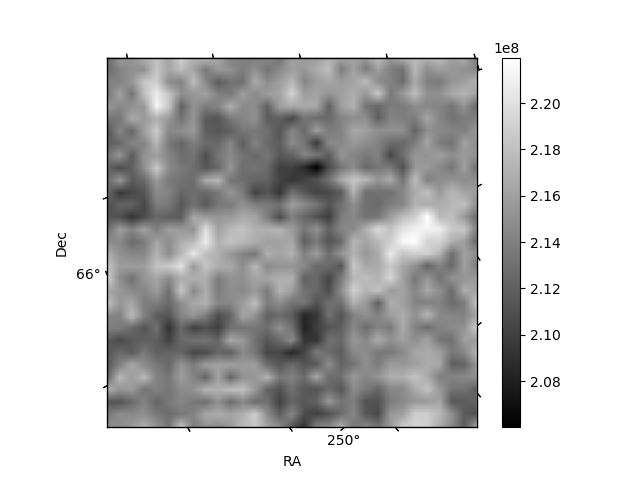
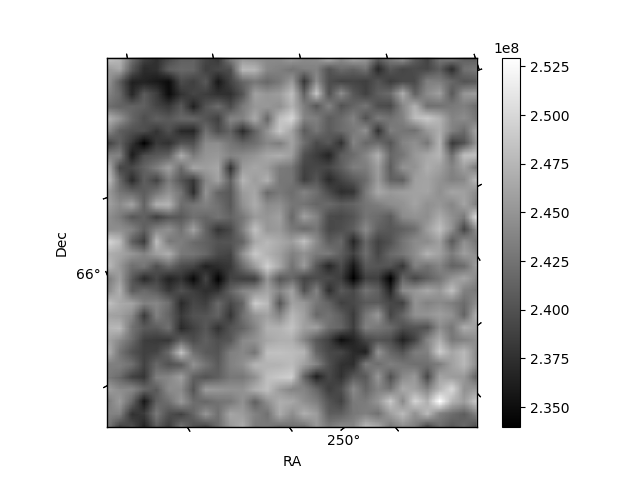
Histogram calculated using DETX and DETY for each event in the final _common_clean file
| Quadrant A | 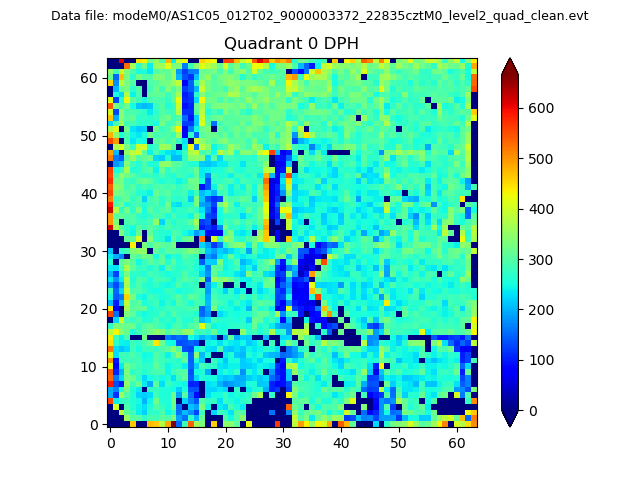 |
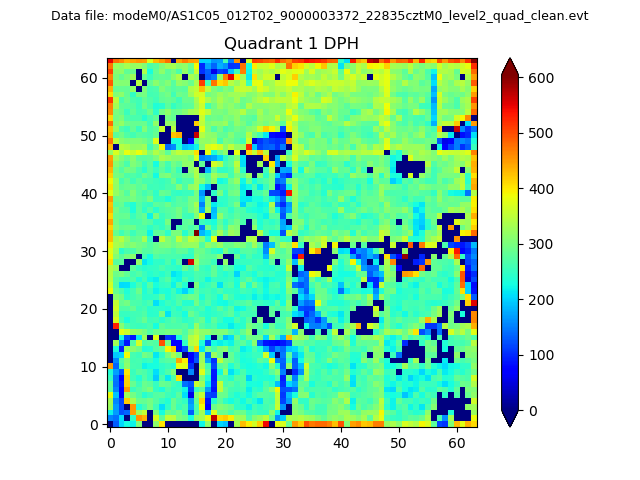 |
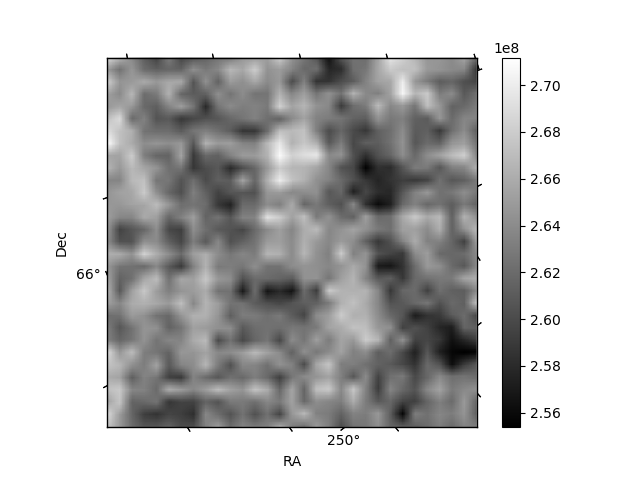
Quadrant B |
|---|---|---|---|
| Quadrant D | 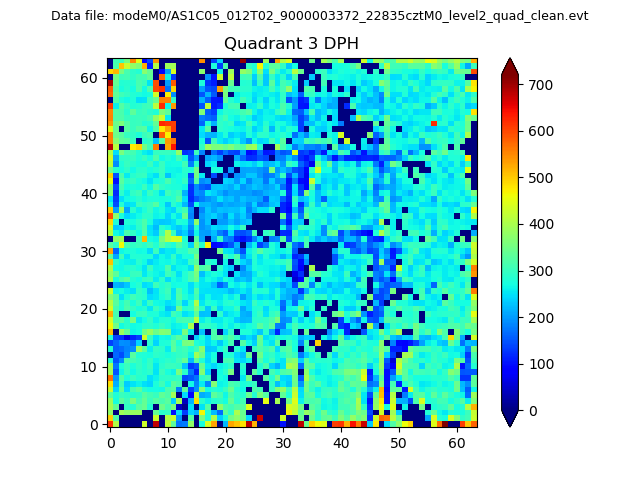 |
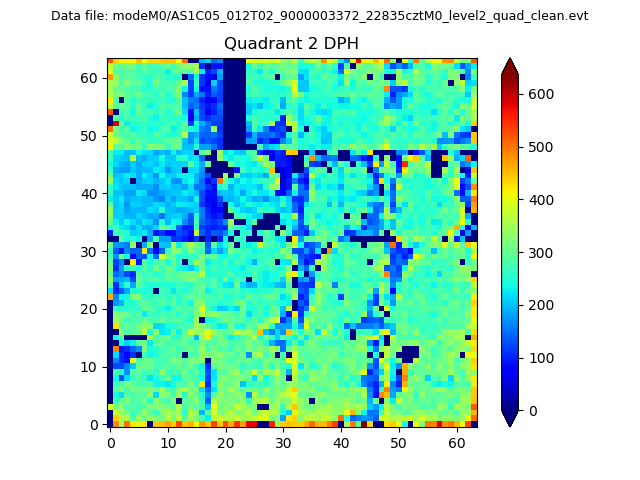 |
Quadrant C |
| Plot type | Count rate plots | Images |
|---|---|---|
| Comparison with Poisson distribution Blue bars denote a histogram of data divided into 1 sec bins. Red curve is a Poisson curve with rate = median count rate of data. |
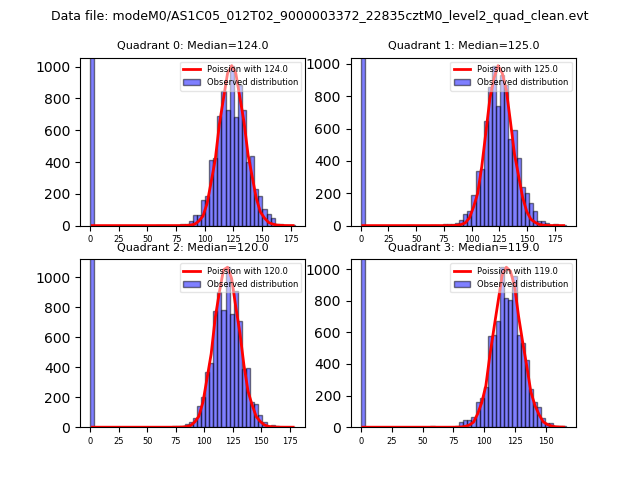 |
 |
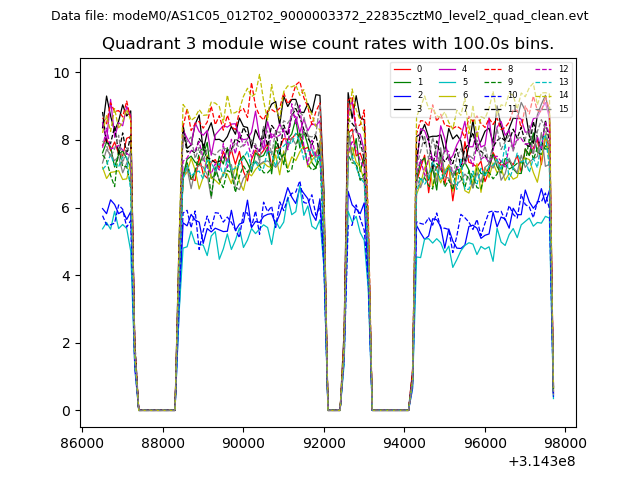
| Quadrant-wise count rates Data is divided into 100 sec bins |
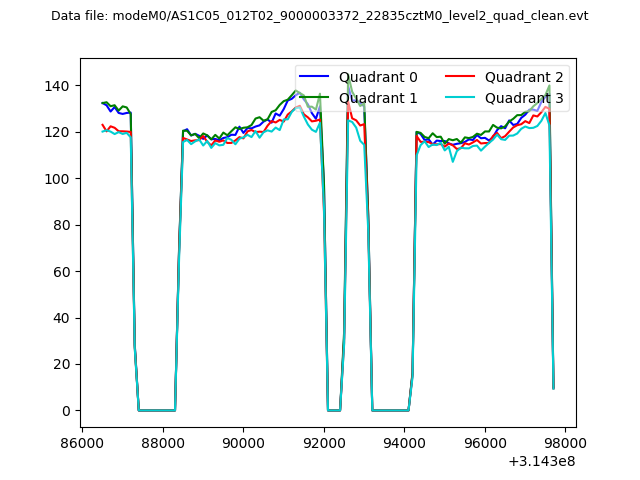 |
|
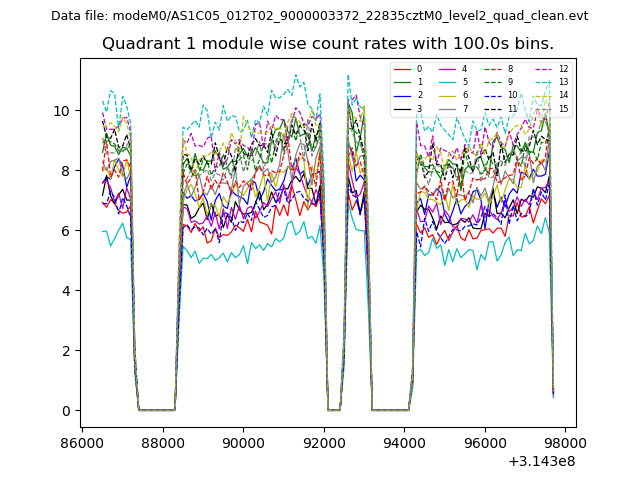
| Module-wise count rates for Quadrant A Data is divided into 100 sec bins |
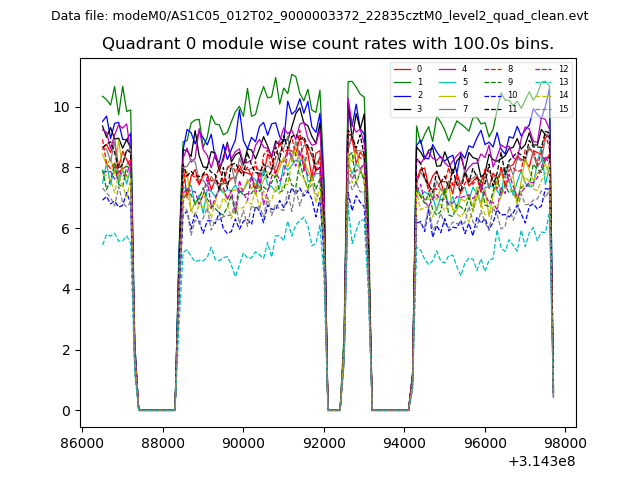 |
 |
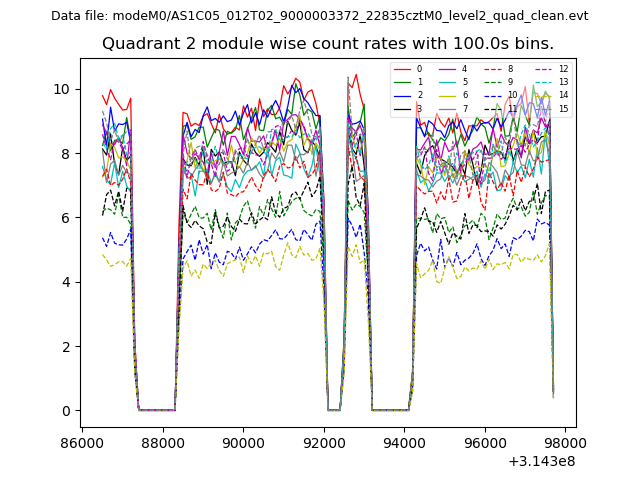
| Module-wise count rates for Quadrant B Data is divided into 100 sec bins |
 |
 |
| Module-wise count rates for Quadrant C Data is divided into 100 sec bins |
 |
 |
| Module-wise count rates for Quadrant D Data is divided into 100 sec bins |
 |
 |
| Parameter | Plot |
|---|---|
| CZT HV Monitor | 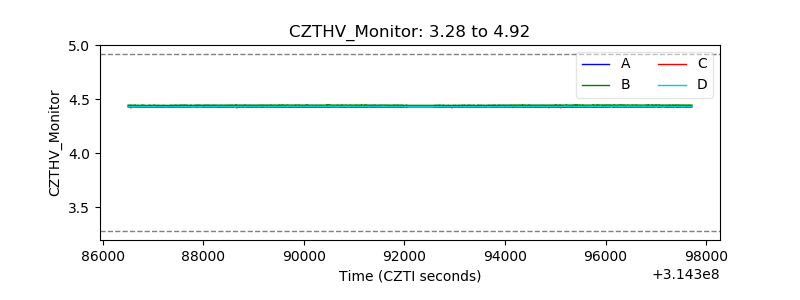 |
| D_VDD | 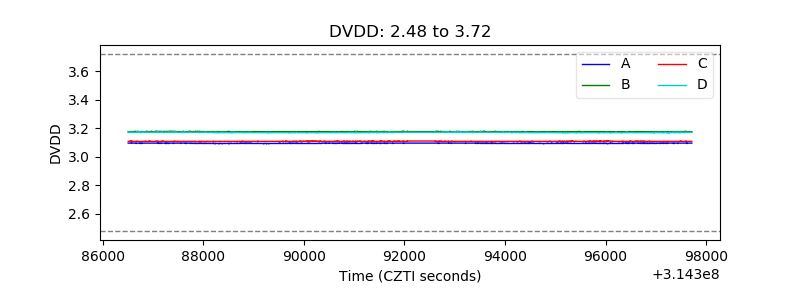 |
| Temperature 1 | 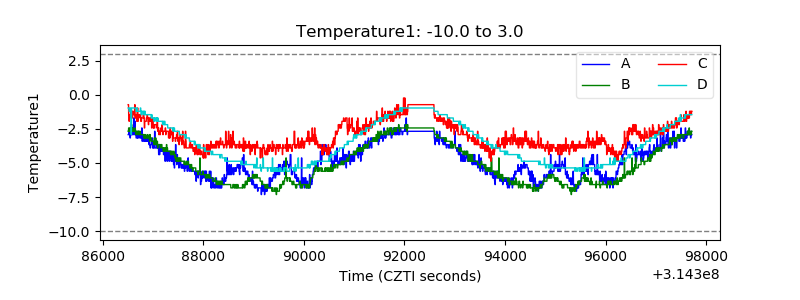 |
| Veto HV Monitor | 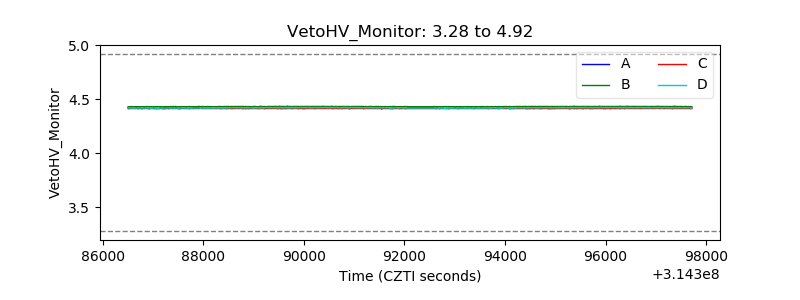 |
| Veto LLD | 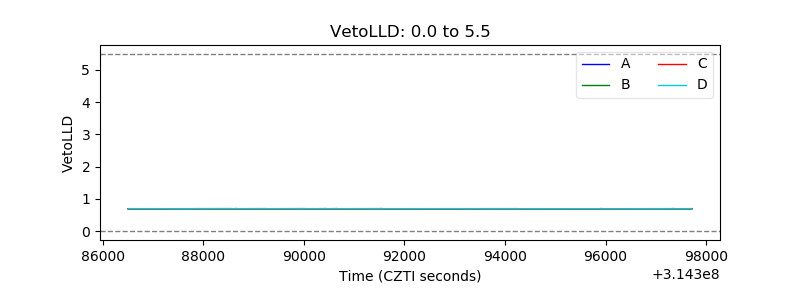 |
| Alpha Counter |  |
| _CPM_Rate | 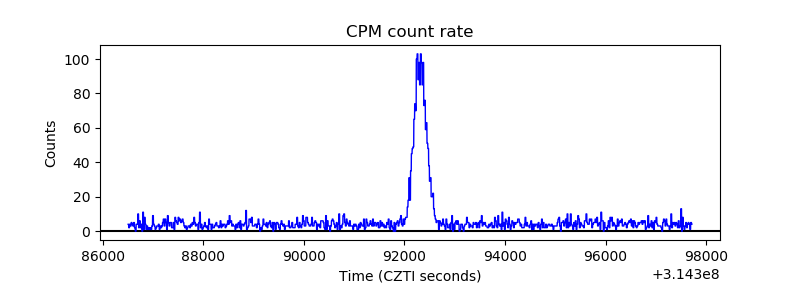 |
| CZT Counter | 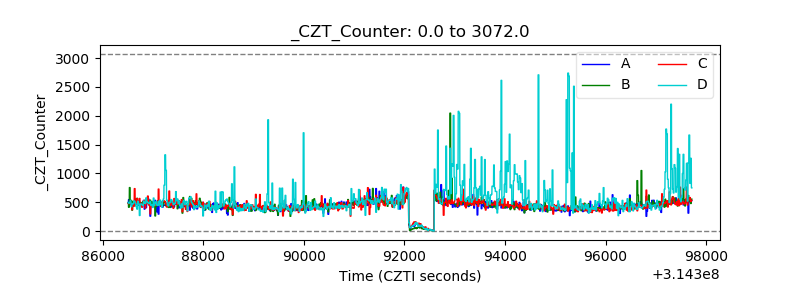 |
| +2.5 Volts monitor |  |
| +5 Volts monitor |  |
| _ROLL_ROT | 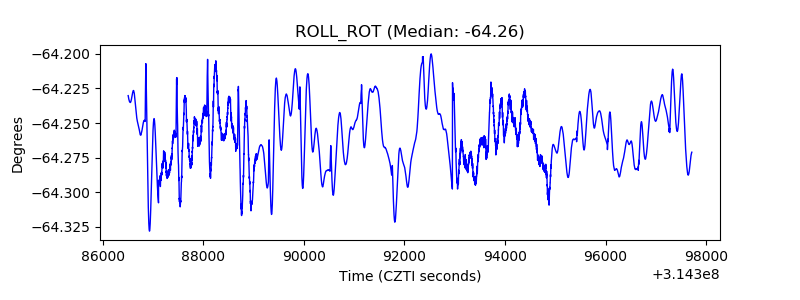 |
| _Roll_DEC |  |
| _Roll_RA | 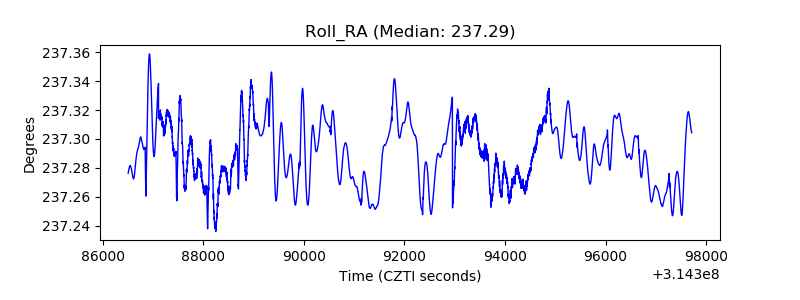 |
| Veto Counter | 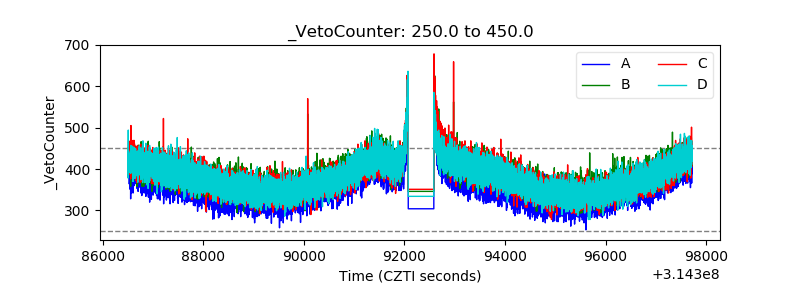 |