| Param | Original file | Final file |
|---|---|---|
| Filename | modeM0/AS1C05_001T01_9000003374cztM0_level2.fits | modeM0/AS1C05_001T01_9000003374cztM0_level2_quad_clean.evt |
| Size (bytes) | 686,289,600 | 813,536,640 |
| Size | 654.5 MB | 775.8 MB |
| Events in quadrant A | 4,285,900 | 5,262,784 |
| Events in quadrant B | 4,070,468 | 5,244,493 |
| Events in quadrant C | 4,170,370 | 4,981,365 |
| Events in quadrant D | 3,521,874 | 4,416,832 |
| Mode SS | |||
|---|---|---|---|
| Quadrant | BADHDUFLAG | Total packets | Discarded packets |
| A | 0 | 1410 | 0 |
| B | 0 | 1410 | 0 |
| C | 0 | 1410 | 0 |
| D | 0 | 1410 | 0 |
| Mode M0 | |||
|---|---|---|---|
| Quadrant | BADHDUFLAG | Total packets | Discarded packets |
| A | 0 | 149851 | 0 |
| B | 0 | 147847 | 0 |
| C | 0 | 143608 | 0 |
| D | 0 | 209397 | 0 |
| Mode M9 | |||
|---|---|---|---|
| Quadrant | BADHDUFLAG | Total packets | Discarded packets |
| A | 0 | 112 | 0 |
| B | 0 | 112 | 0 |
| C | 0 | 112 | 0 |
| D | 0 | 112 | 0 |
| Quadrant | Total seconds | Saturated seconds | Saturation percentage |
|---|---|---|---|
| A | 69025 | 742 | 1.074973% |
| B | 69020 | 933 | 1.351782% |
| C | 69028 | 1096 | 1.587761% |
| D | 69021 | 4942 | 7.160140% |
Noise dominated data is calculated using 1-second bins in cleaned event files. If a bin has >2000 counts, and if more than 50% of those come from <1% of pixels, then it is considered to be noise-dominated and hence unusable.
| Quadrant | # 1 sec bins | Bins with >0 counts | Bins with >2000 counts | High rate bins dominated by noise | Noise dominated (total time) | Noise dominated (detector-on time) | Marked lightcurve |
|---|---|---|---|---|---|---|---|
| A | 82223 | 69064 | 0 | 0 | 0.00% | 0.00% |  |
| B | 82223 | 69058 | 0 | 0 | 0.00% | 0.00% |  |
| C | 82223 | 69063 | 0 | 0 | 0.00% | 0.00% |  |
| D | 82223 | 69019 | 0 | 0 | 0.00% | 0.00% | 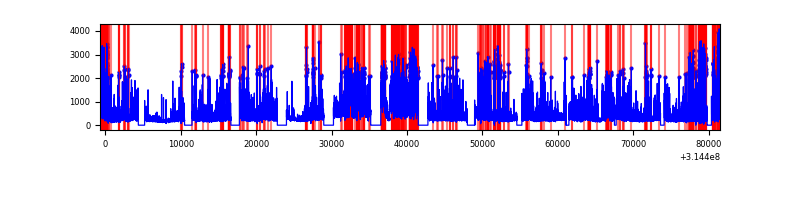 |
Top three noisy pixels from each quadrant. If the there are fewer than three noisy pixels in the level2.evt file, extra rows are filled as -1
| Pixel properties | Quadrant properties | ||||||
|---|---|---|---|---|---|---|---|
| Quadrant | DetID | PixID | Counts | Sigma | Mean | Median | Sigma |
| A | 0 | 29 | 4145 | 11.27 | 1117 | 1056 | 274.0 |
| A | 7 | 110 | 3488 | 8.88 | 1117 | 1056 | 274.0 |
| A | 9 | 19 | 3169 | 7.71 | 1117 | 1056 | 274.0 |
| B | 2 | 9 | 3168 | 10.05 | 1082 | 1037 | 212.0 |
| B | 5 | 128 | 2735 | 8.01 | 1082 | 1037 | 212.0 |
| B | 2 | 8 | 2688 | 7.79 | 1082 | 1037 | 212.0 |
| C | 3 | 234 | 3055 | 7.26 | 1101 | 1038 | 277.9 |
| C | 12 | 241 | 2933 | 6.82 | 1101 | 1038 | 277.9 |
| C | 3 | 235 | 2803 | 6.35 | 1101 | 1038 | 277.9 |
| D | 6 | 231 | 2555 | 6.09 | 1009 | 922 | 268.2 |
| D | 3 | 14 | 2535 | 6.01 | 1009 | 922 | 268.2 |
| D | 10 | 189 | 2529 | 5.99 | 1009 | 922 | 268.2 |
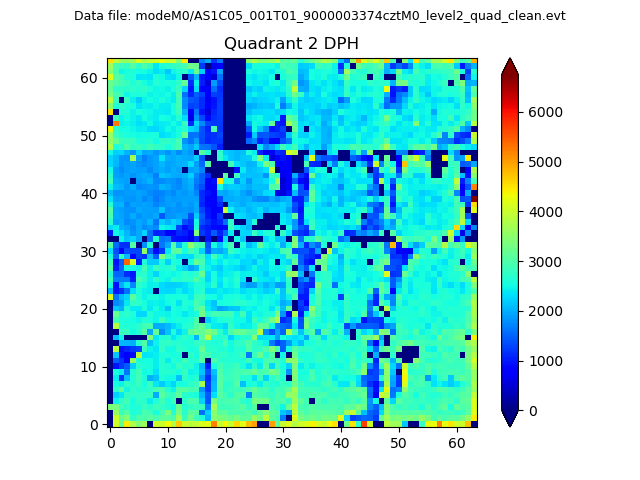
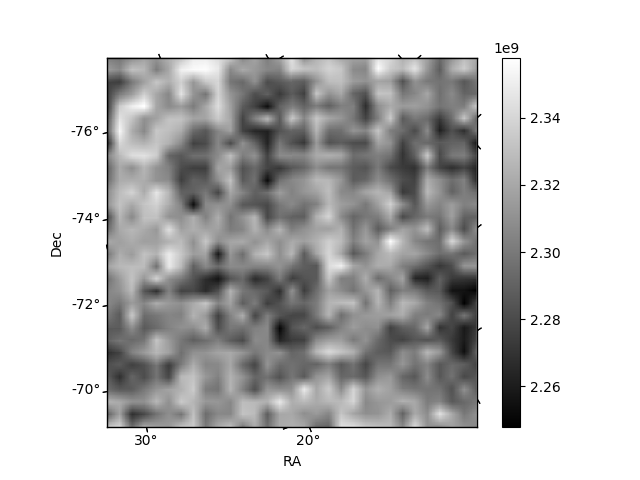
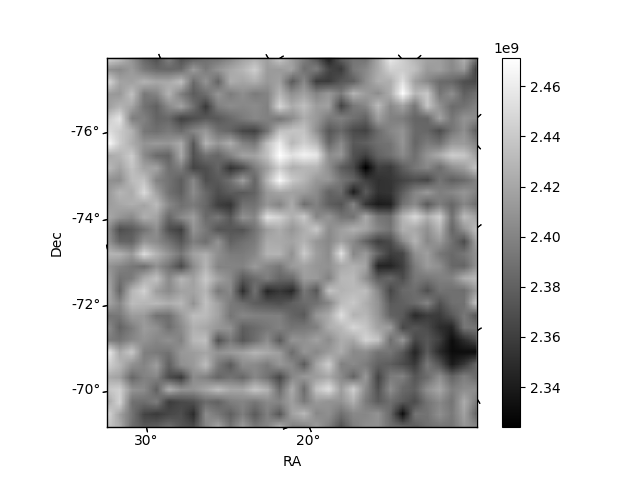
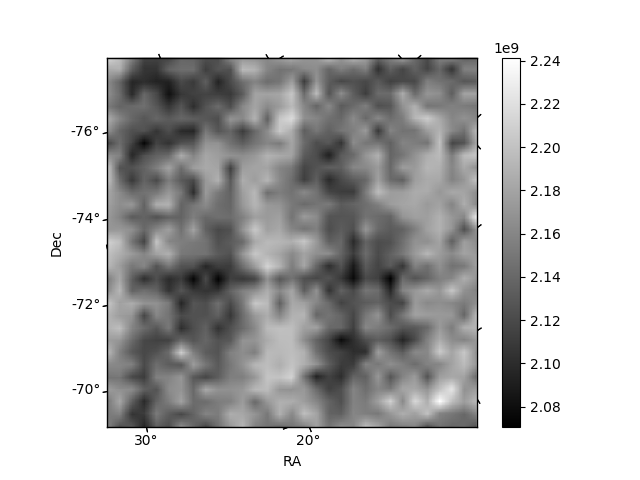
Histogram calculated using DETX and DETY for each event in the final _common_clean file
| Quadrant A | 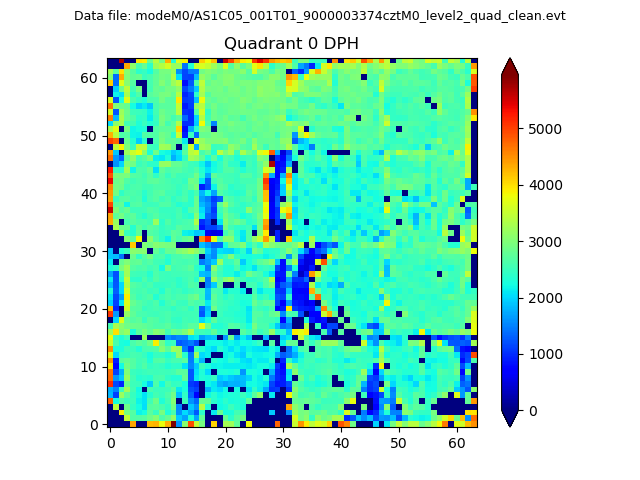 |
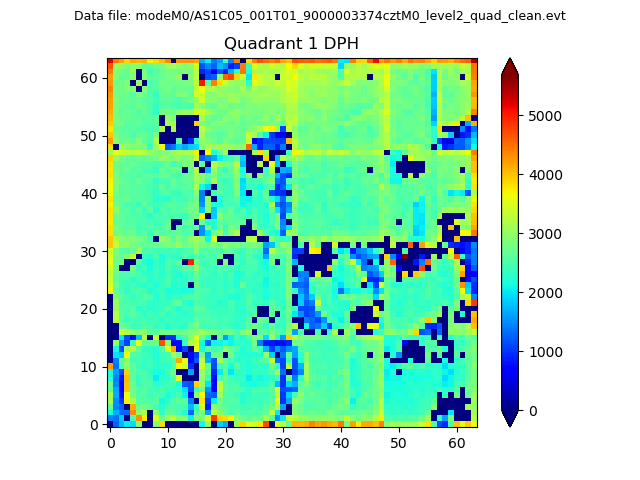 |
Quadrant B |
|---|---|---|---|
| Quadrant D | 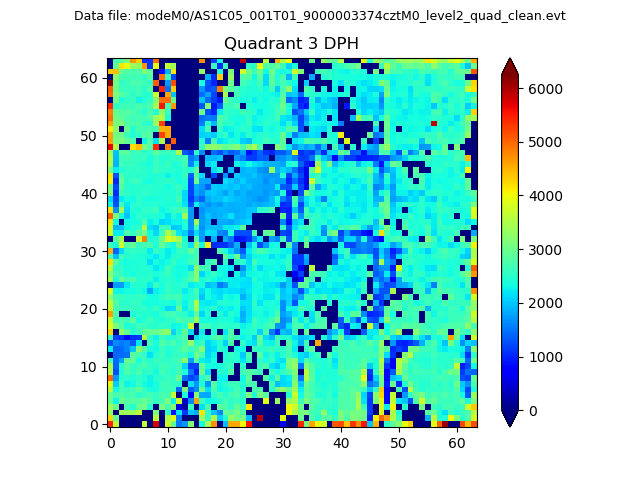 |
 |
Quadrant C |
| Plot type | Count rate plots | Images |
|---|---|---|
| Comparison with Poisson distribution Blue bars denote a histogram of data divided into 1 sec bins. Red curve is a Poisson curve with rate = median count rate of data. |
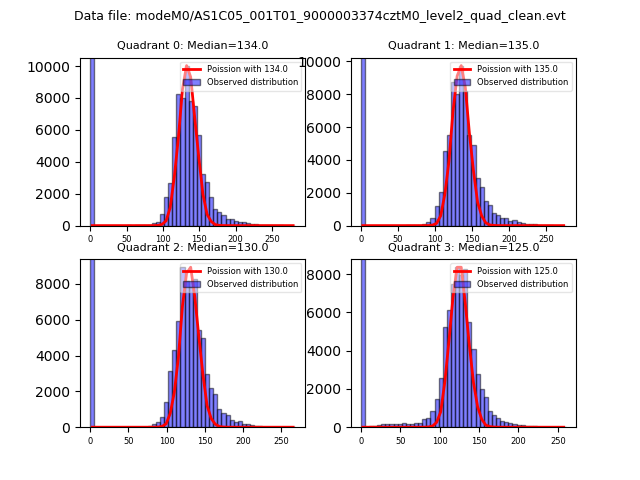 |
 |
| Quadrant-wise count rates Data is divided into 100 sec bins |
 |
|
| Module-wise count rates for Quadrant A Data is divided into 100 sec bins |
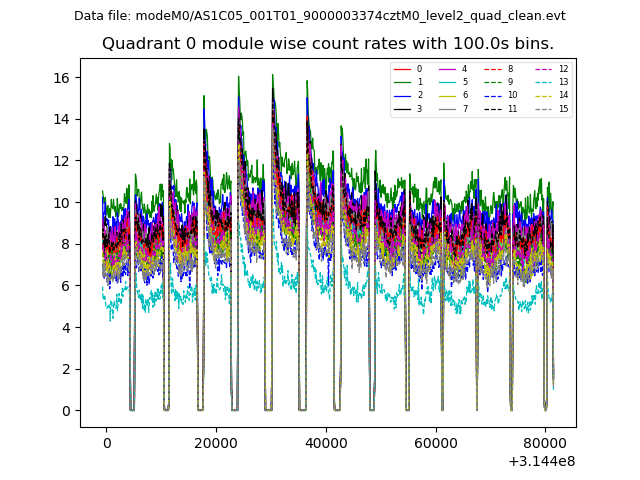 |
 |
| Module-wise count rates for Quadrant B Data is divided into 100 sec bins |
 |
 |
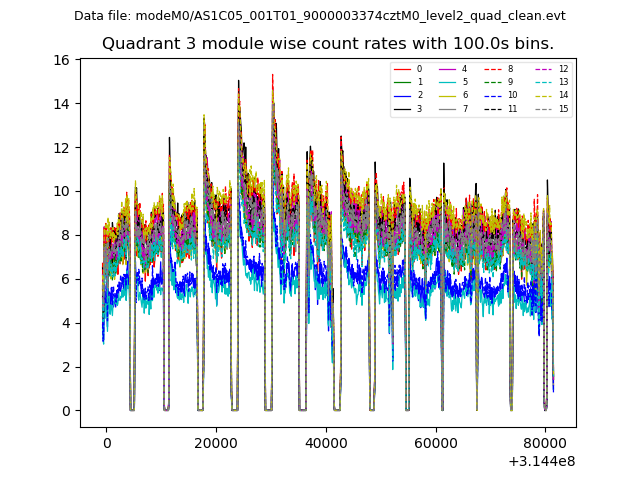
| Module-wise count rates for Quadrant C Data is divided into 100 sec bins |
 |
 |
| Module-wise count rates for Quadrant D Data is divided into 100 sec bins |
 |
 |
| Parameter | Plot |
|---|---|
| CZT HV Monitor |  |
| D_VDD |  |
| Temperature 1 |  |
| Veto HV Monitor | 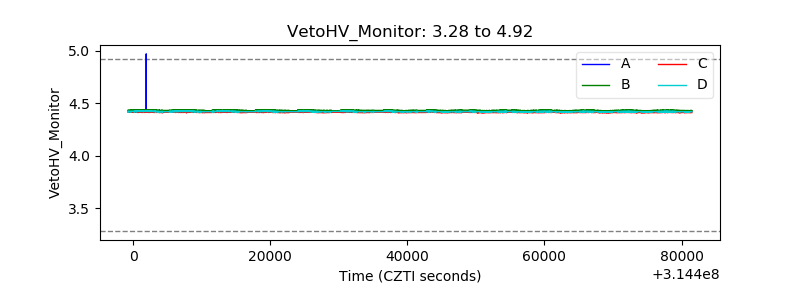 |
| Veto LLD | 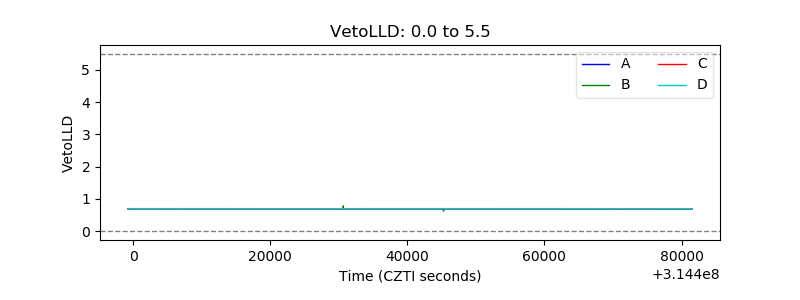 |
| Alpha Counter |  |
| _CPM_Rate | 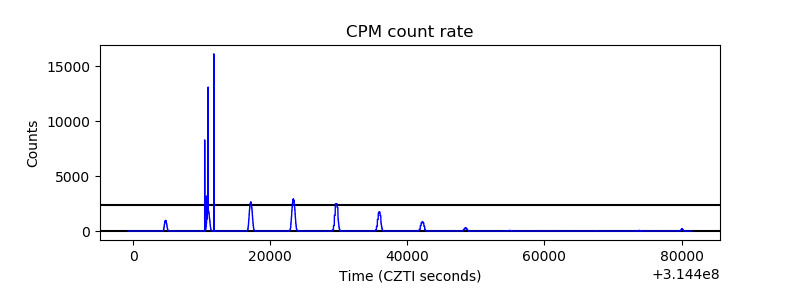 |
| CZT Counter |  |
| +2.5 Volts monitor |  |
| +5 Volts monitor | 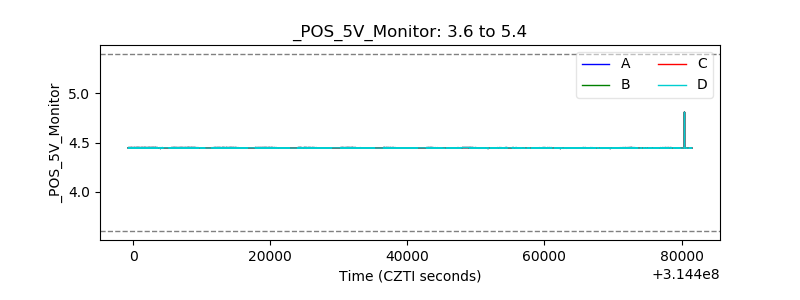 |
| _ROLL_ROT |  |
| _Roll_DEC | 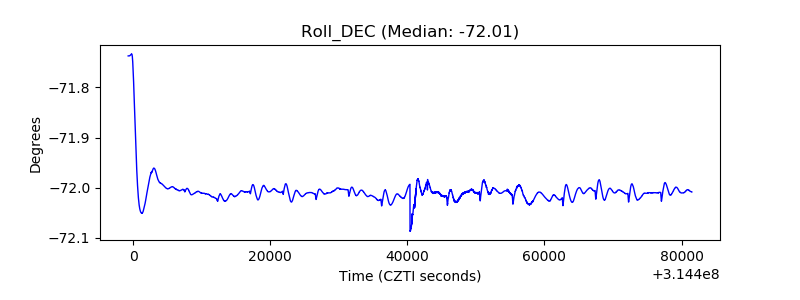 |
| _Roll_RA |  |
| Veto Counter |  |