| Param | Original file | Final file |
|---|---|---|
| Filename | modeM0/AS1C05_001T01_9000003374_22835cztM0_level2.evt | modeM0/AS1C05_001T01_9000003374_22835cztM0_level2_quad_clean.evt |
| Size (bytes) | 478,725,120 | 123,120,000 |
| Size | 456.5 MB | 117.4 MB |
| Events in quadrant A | 3,050,098 | 841,429 |
| Events in quadrant B | 3,126,951 | 852,051 |
| Events in quadrant C | 3,024,396 | 804,037 |
| Events in quadrant D | 4,843,101 | 765,861 |
| Mode SS | |||
|---|---|---|---|
| Quadrant | BADHDUFLAG | Total packets | Discarded packets |
| A | 0 | 136 | 0 |
| B | 0 | 136 | 0 |
| C | 0 | 136 | 0 |
| D | 0 | 136 | 0 |
| Mode M0 | |||
|---|---|---|---|
| Quadrant | BADHDUFLAG | Total packets | Discarded packets |
| A | 0 | 13506 | 1 |
| B | 0 | 13723 | 1 |
| C | 0 | 13443 | 1 |
| D | 0 | 18860 | 1 |
| Mode M9 | |||
|---|---|---|---|
| Quadrant | BADHDUFLAG | Total packets | Discarded packets |
| A | 0 | 9 | 0 |
| B | 0 | 9 | 0 |
| C | 0 | 9 | 0 |
| D | 0 | 9 | 0 |
| Quadrant | Total seconds | Saturated seconds | Saturation percentage |
|---|---|---|---|
| A | 6677 | 23 | 0.344466% |
| B | 6677 | 24 | 0.359443% |
| C | 6676 | 39 | 0.584182% |
| D | 6676 | 417 | 6.246255% |
Noise dominated data is calculated using 1-second bins in cleaned event files. If a bin has >2000 counts, and if more than 50% of those come from <1% of pixels, then it is considered to be noise-dominated and hence unusable.
| Quadrant | # 1 sec bins | Bins with >0 counts | Bins with >2000 counts | High rate bins dominated by noise | Noise dominated (total time) | Noise dominated (detector-on time) | Marked lightcurve |
|---|---|---|---|---|---|---|---|
| A | 7522 | 6678 | 0 | 0 | 0.00% | 0.00% | 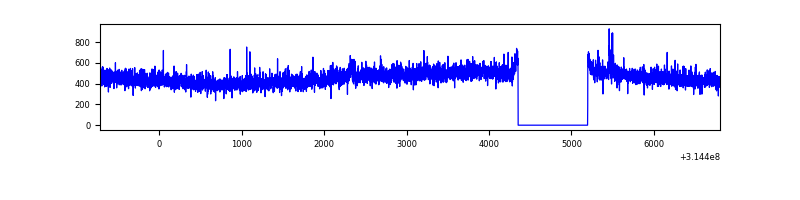 |
| B | 7522 | 6678 | 3 | 3 | 0.04% | 0.04% | 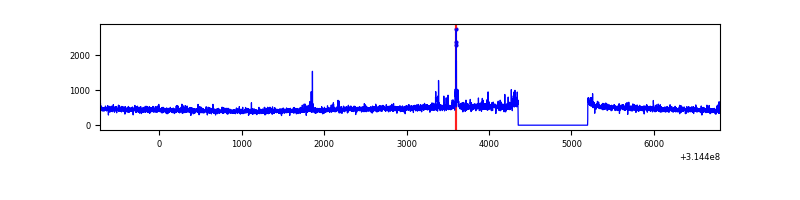 |
| C | 7521 | 6677 | 0 | 0 | 0.00% | 0.00% | 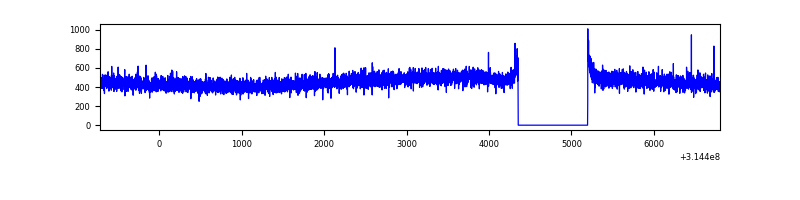 |
| D | 7521 | 6677 | 394 | 394 | 5.24% | 5.90% | 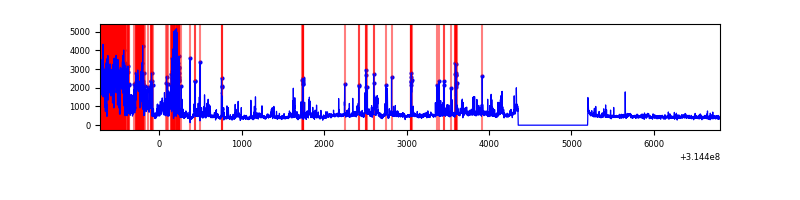 |
Top three noisy pixels from each quadrant. If the there are fewer than three noisy pixels in the level2.evt file, extra rows are filled as -1
| Pixel properties | Quadrant properties | ||||||
|---|---|---|---|---|---|---|---|
| Quadrant | DetID | PixID | Counts | Sigma | Mean | Median | Sigma |
| A | 11 | 47 | 45796 | 287.25 | 776 | 761 | 156.8 |
| A | 13 | 252 | 12219 | 73.08 | 776 | 761 | 156.8 |
| A | 13 | 254 | 11371 | 67.68 | 776 | 761 | 156.8 |
| B | 0 | 190 | 27722 | 180.65 | 777 | 755 | 149.3 |
| B | 0 | 230 | 18160 | 116.6 | 777 | 755 | 149.3 |
| B | 12 | 111 | 18145 | 116.5 | 777 | 755 | 149.3 |
| C | 14 | 238 | 118442 | 673.15 | 744 | 747 | 174.8 |
| C | 13 | 61 | 5123 | 25.03 | 744 | 747 | 174.8 |
| C | 0 | 239 | 3628 | 16.48 | 744 | 747 | 174.8 |
| D | 1 | 52 | 1593887 | 8916.62 | 733 | 712 | 178.7 |
| D | 12 | 227 | 147000 | 818.74 | 733 | 712 | 178.7 |
| D | 7 | 223 | 132828 | 739.42 | 733 | 712 | 178.7 |
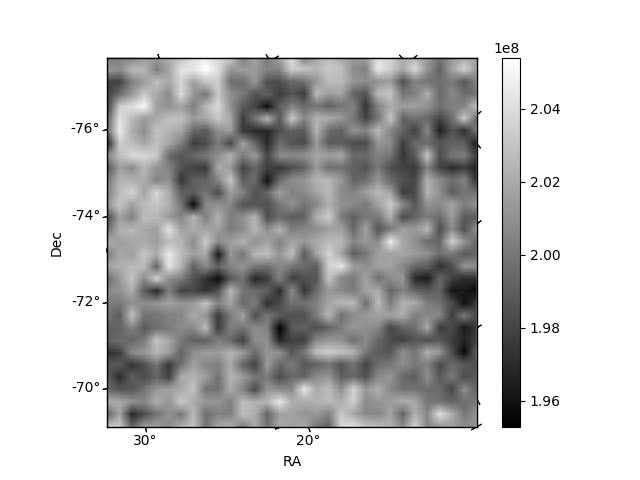
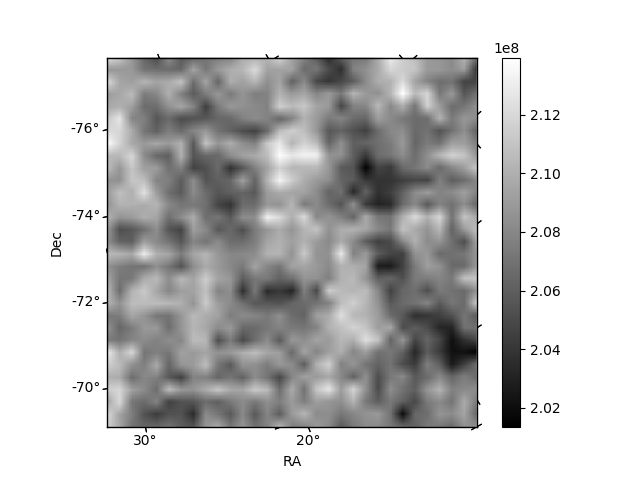
Histogram calculated using DETX and DETY for each event in the final _common_clean file
| Quadrant A |  |
 |
Quadrant B |
|---|---|---|---|
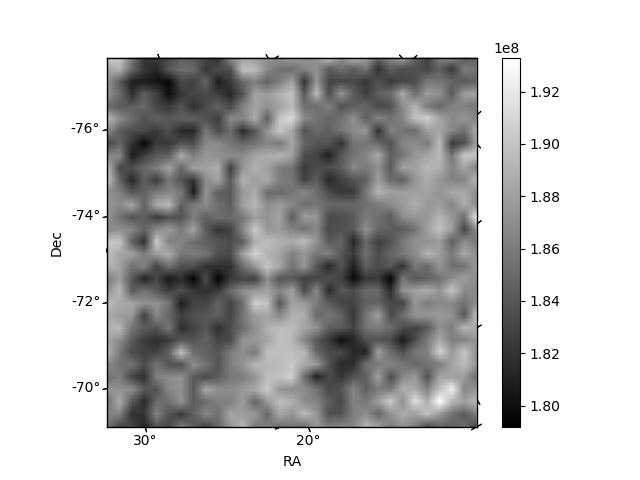
| Quadrant D |  |
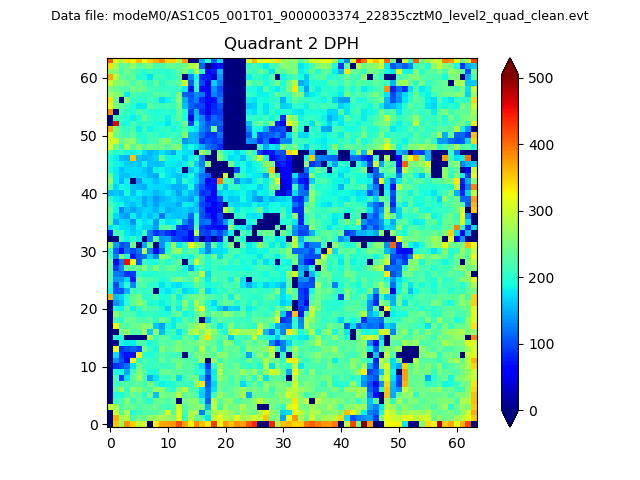 |
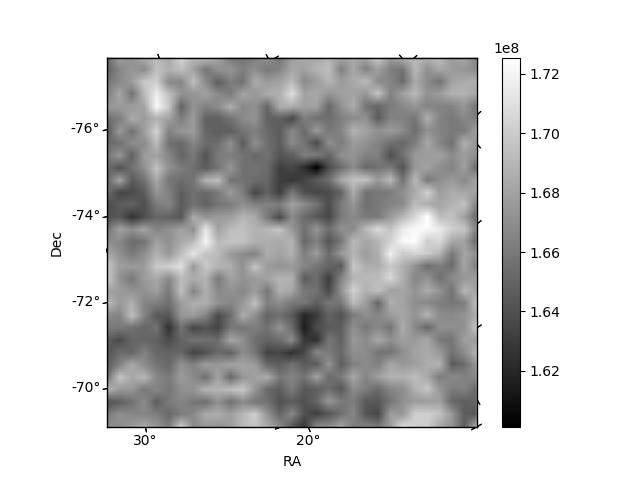
Quadrant C |
| Plot type | Count rate plots | Images |
|---|---|---|
| Comparison with Poisson distribution Blue bars denote a histogram of data divided into 1 sec bins. Red curve is a Poisson curve with rate = median count rate of data. |
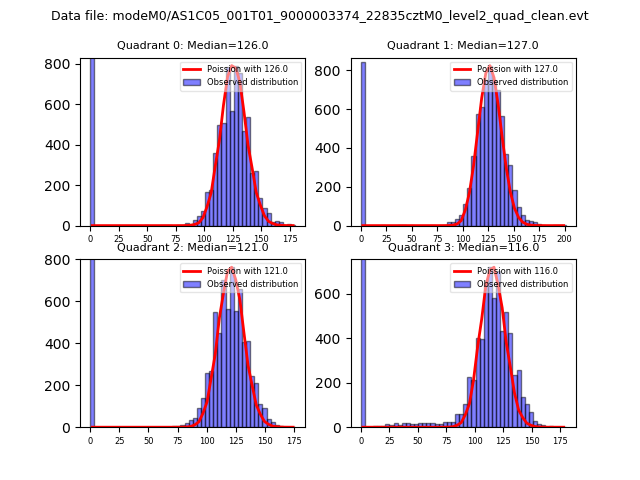 |
 |
| Quadrant-wise count rates Data is divided into 100 sec bins |
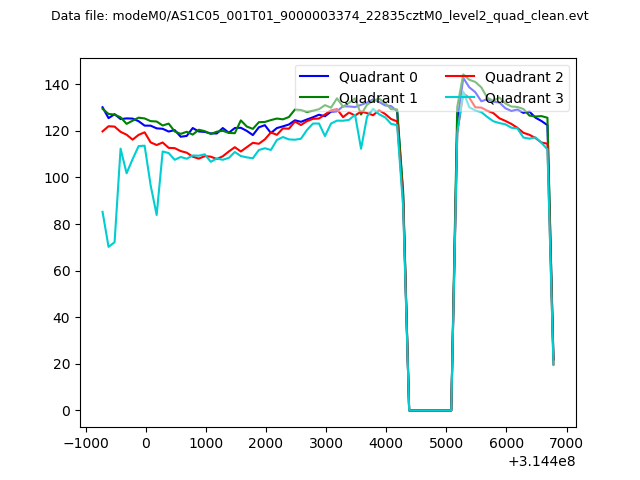 |
|
| Module-wise count rates for Quadrant A Data is divided into 100 sec bins |
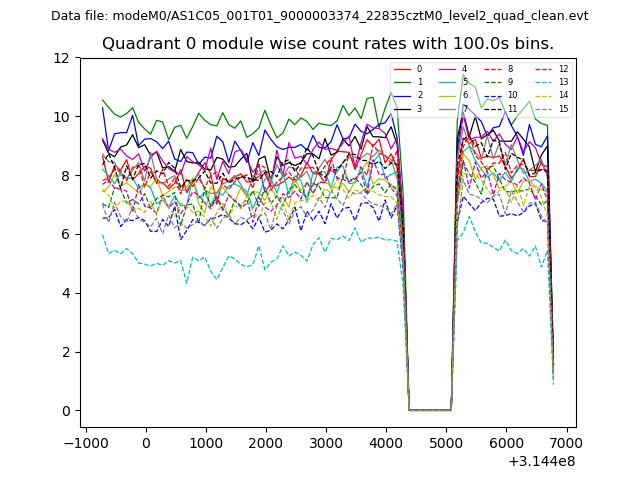 |
 |
| Module-wise count rates for Quadrant B Data is divided into 100 sec bins |
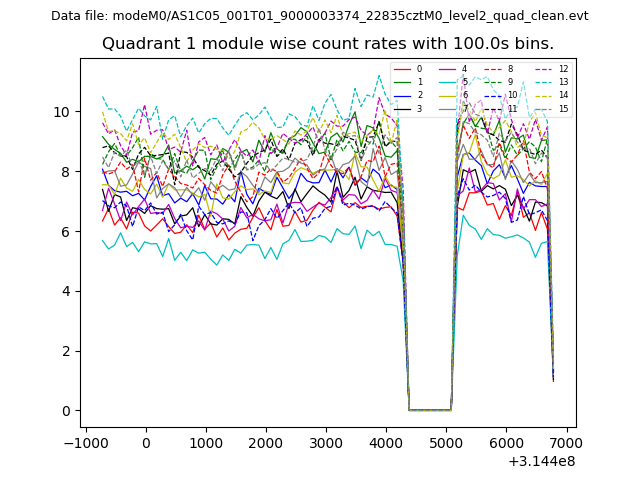 |
 |
| Module-wise count rates for Quadrant C Data is divided into 100 sec bins |
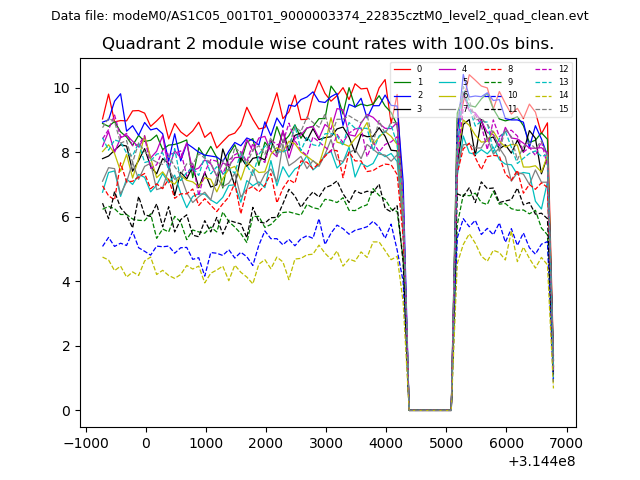 |
 |
| Module-wise count rates for Quadrant D Data is divided into 100 sec bins |
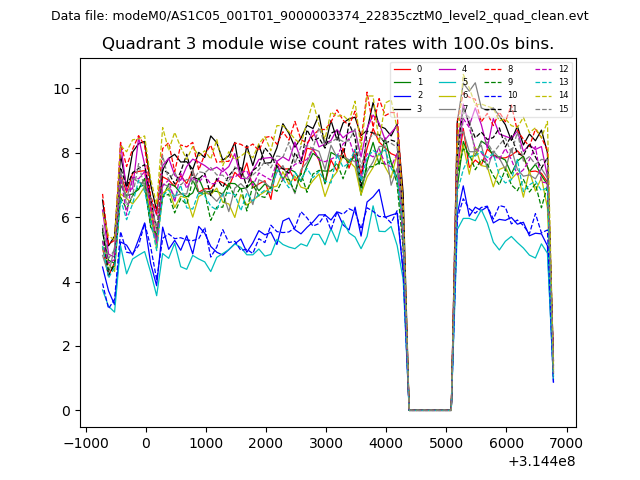 |
 |
| Parameter | Plot |
|---|---|
| CZT HV Monitor | 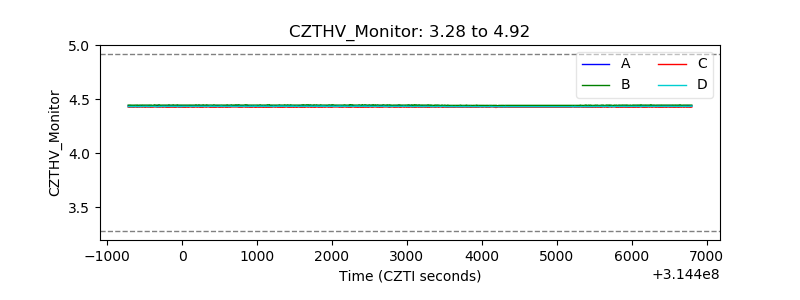 |
| D_VDD | 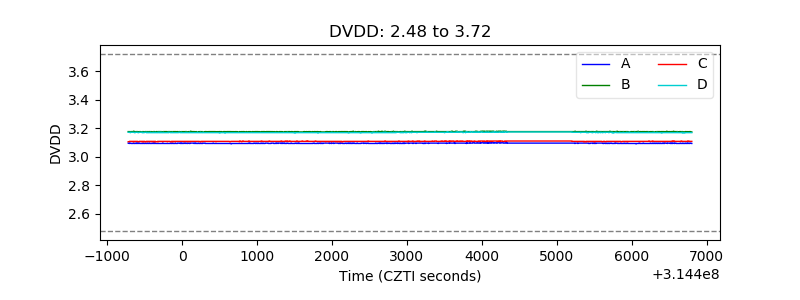 |
| Temperature 1 | 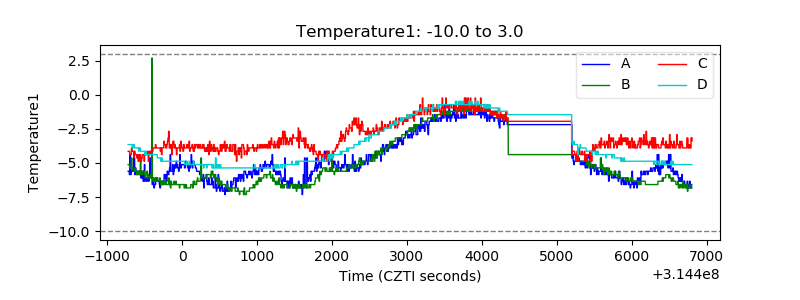 |
| Veto HV Monitor | 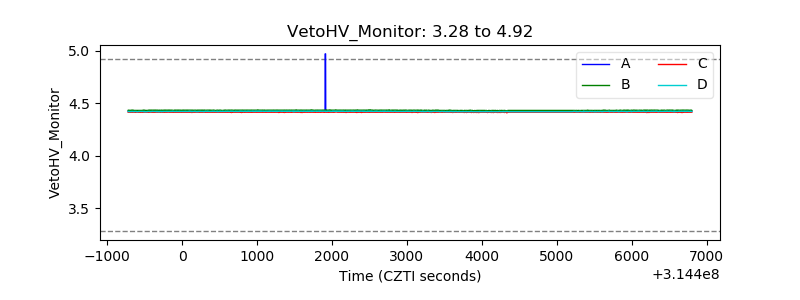 |
| Veto LLD | 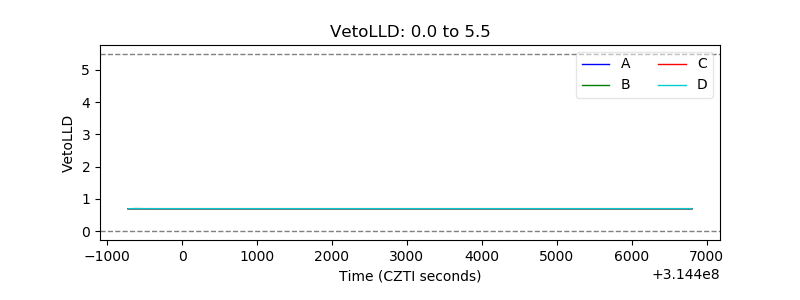 |
| Alpha Counter | 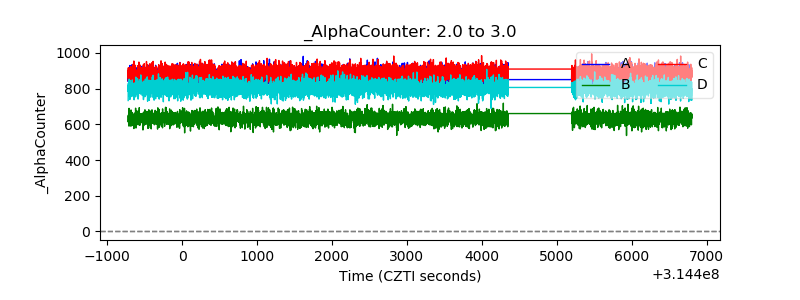 |
| _CPM_Rate | 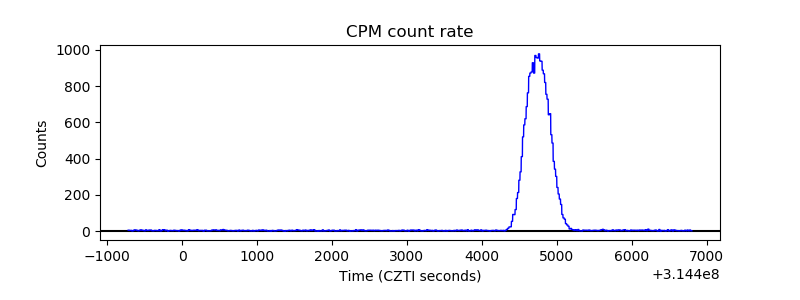 |
| CZT Counter | 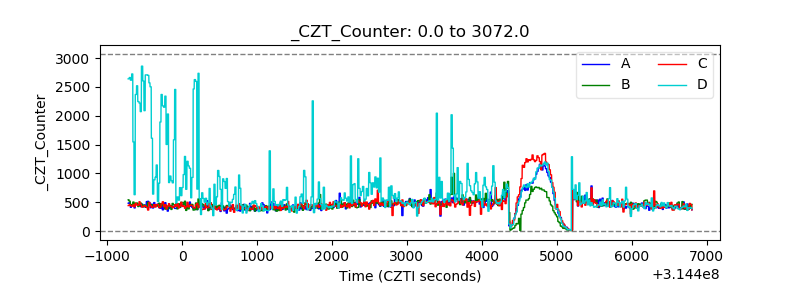 |
| +2.5 Volts monitor |  |
| +5 Volts monitor |  |
| _ROLL_ROT | 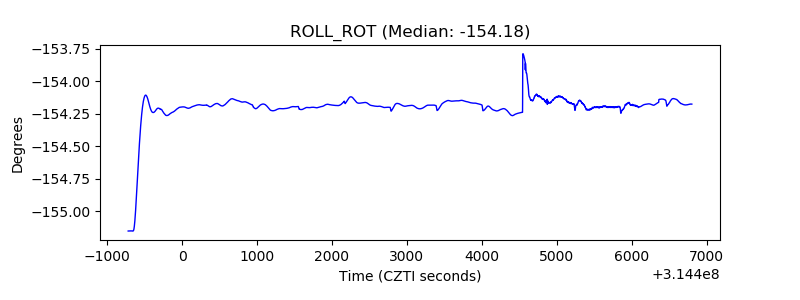 |
| _Roll_DEC | 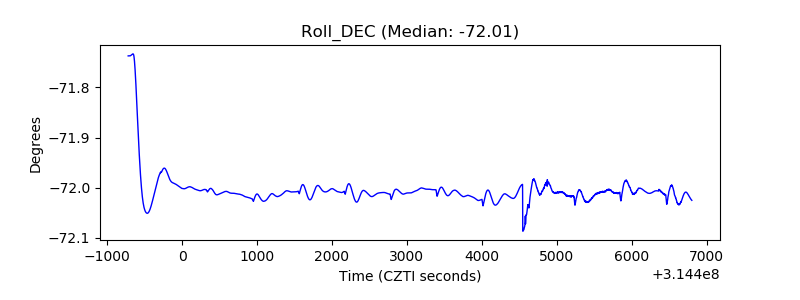 |
| _Roll_RA | 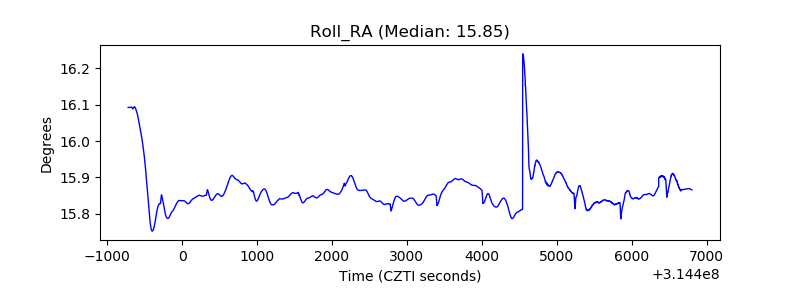 |
| Veto Counter | 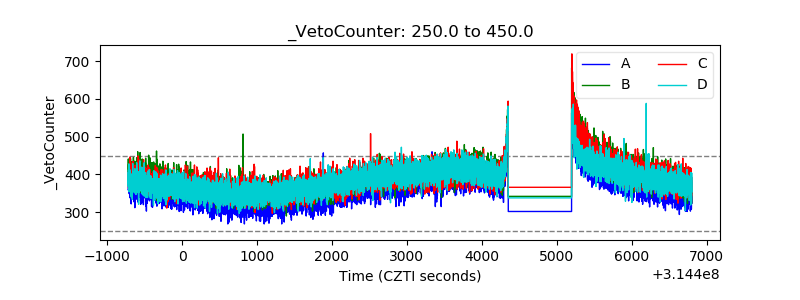 |