| Param | Original file | Final file |
|---|---|---|
| Filename | modeM0/AS1C05_001T01_9000003374_22838cztM0_level2.evt | modeM0/AS1C05_001T01_9000003374_22838cztM0_level2_quad_clean.evt |
| Size (bytes) | 740,041,920 | 210,245,760 |
| Size | 705.8 MB | 200.5 MB |
| Events in quadrant A | 5,100,975 | 1,433,652 |
| Events in quadrant B | 5,311,369 | 1,461,395 |
| Events in quadrant C | 5,096,728 | 1,390,262 |
| Events in quadrant D | 6,179,820 | 1,343,890 |
| Mode SS | |||
|---|---|---|---|
| Quadrant | BADHDUFLAG | Total packets | Discarded packets |
| A | 0 | 220 | 0 |
| B | 0 | 220 | 0 |
| C | 0 | 220 | 0 |
| D | 0 | 220 | 0 |
| Mode M0 | |||
|---|---|---|---|
| Quadrant | BADHDUFLAG | Total packets | Discarded packets |
| A | 0 | 22103 | 0 |
| B | 0 | 22602 | 0 |
| C | 0 | 21987 | 0 |
| D | 0 | 25519 | 0 |
| Mode M9 | |||
|---|---|---|---|
| Quadrant | BADHDUFLAG | Total packets | Discarded packets |
| A | 0 | 20 | 0 |
| B | 0 | 20 | 0 |
| C | 0 | 20 | 0 |
| D | 0 | 20 | 0 |
| Quadrant | Total seconds | Saturated seconds | Saturation percentage |
|---|---|---|---|
| A | 10666 | 65 | 0.609413% |
| B | 10668 | 92 | 0.862392% |
| C | 10668 | 114 | 1.068616% |
| D | 10668 | 192 | 1.799775% |
Noise dominated data is calculated using 1-second bins in cleaned event files. If a bin has >2000 counts, and if more than 50% of those come from <1% of pixels, then it is considered to be noise-dominated and hence unusable.
| Quadrant | # 1 sec bins | Bins with >0 counts | Bins with >2000 counts | High rate bins dominated by noise | Noise dominated (total time) | Noise dominated (detector-on time) | Marked lightcurve |
|---|---|---|---|---|---|---|---|
| A | 12782 | 10669 | 0 | 0 | 0.00% | 0.00% | 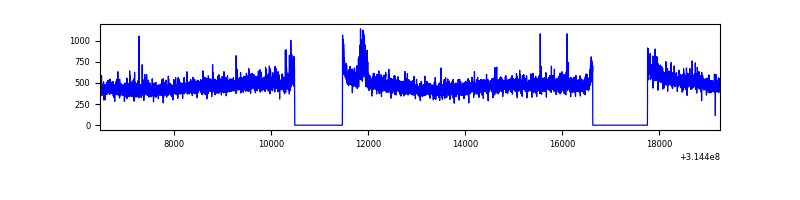 |
| B | 12783 | 10670 | 1 | 1 | 0.01% | 0.01% | 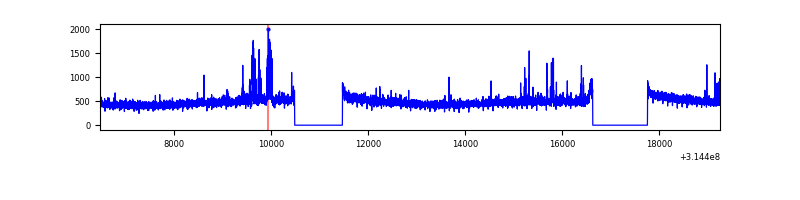 |
| C | 12783 | 10670 | 0 | 0 | 0.00% | 0.00% | 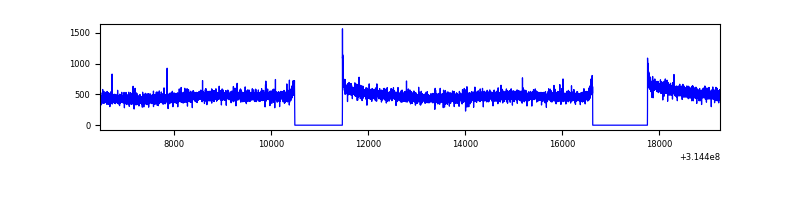 |
| D | 12783 | 10670 | 125 | 125 | 0.98% | 1.17% | 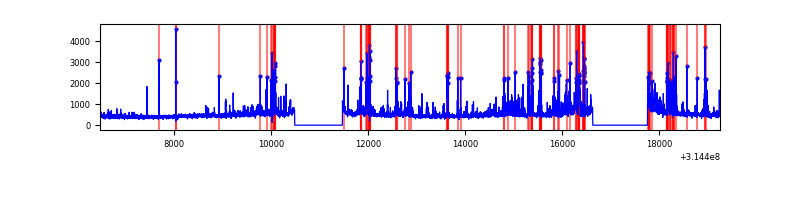 |
Top three noisy pixels from each quadrant. If the there are fewer than three noisy pixels in the level2.evt file, extra rows are filled as -1
| Pixel properties | Quadrant properties | ||||||
|---|---|---|---|---|---|---|---|
| Quadrant | DetID | PixID | Counts | Sigma | Mean | Median | Sigma |
| A | 11 | 47 | 102782 | 392.95 | 1295 | 1268 | 258.3 |
| A | 13 | 254 | 18608 | 67.12 | 1295 | 1268 | 258.3 |
| A | 0 | 226 | 11154 | 38.27 | 1295 | 1268 | 258.3 |
| B | 0 | 190 | 190419 | 782.88 | 1293 | 1261 | 241.6 |
| B | 12 | 111 | 28676 | 113.46 | 1293 | 1261 | 241.6 |
| B | 11 | 111 | 24937 | 97.99 | 1293 | 1261 | 241.6 |
| C | 14 | 238 | 201483 | 693.81 | 1253 | 1264 | 288.6 |
| C | 0 | 239 | 9345 | 28.0 | 1253 | 1264 | 288.6 |
| C | 13 | 61 | 8816 | 26.17 | 1253 | 1264 | 288.6 |
| D | 1 | 52 | 993935 | 3289.78 | 1260 | 1224 | 301.8 |
| D | 12 | 227 | 120540 | 395.41 | 1260 | 1224 | 301.8 |
| D | 2 | 152 | 91841 | 300.3 | 1260 | 1224 | 301.8 |
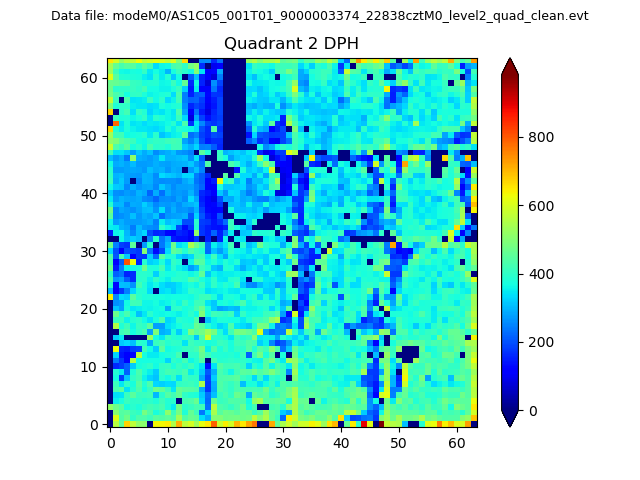
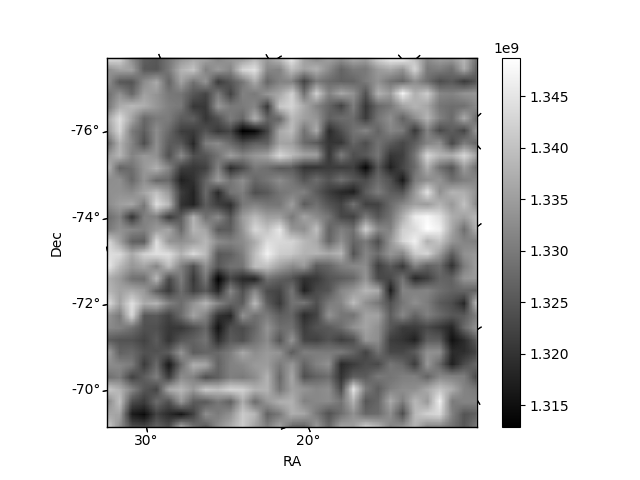
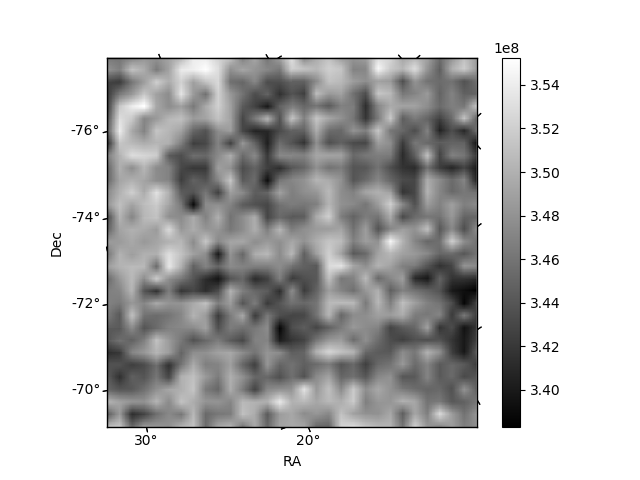
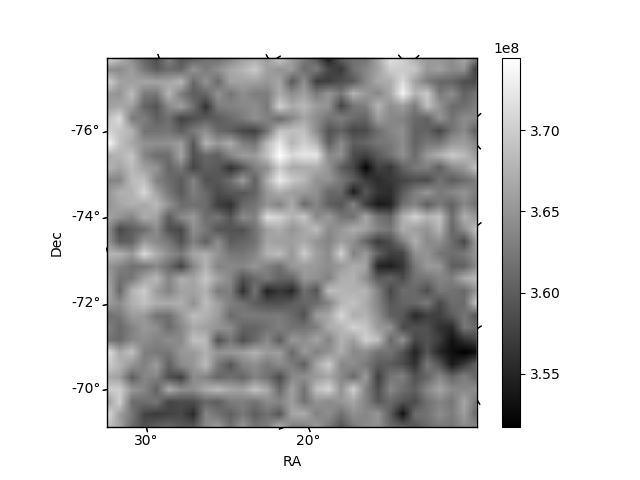
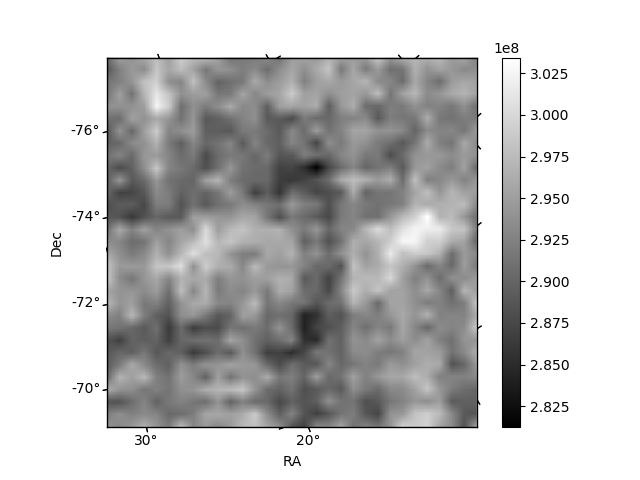
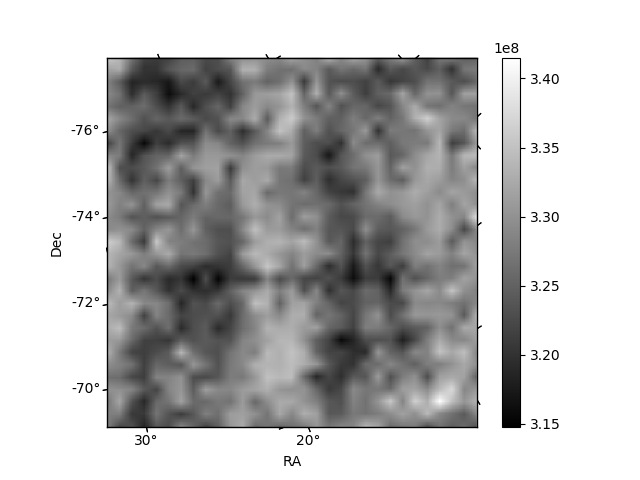
Histogram calculated using DETX and DETY for each event in the final _common_clean file
| Quadrant A | 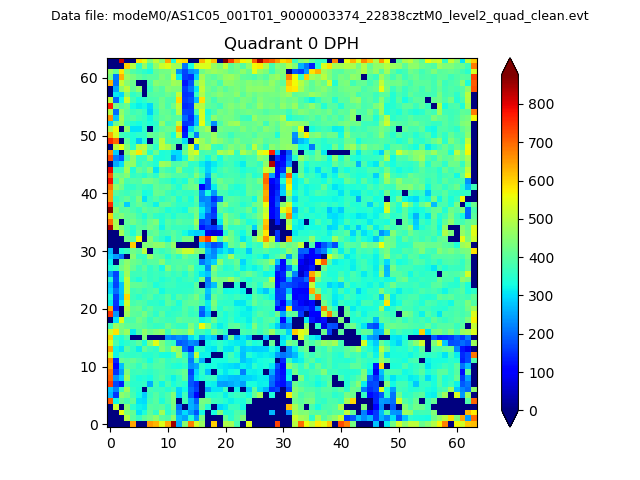 |
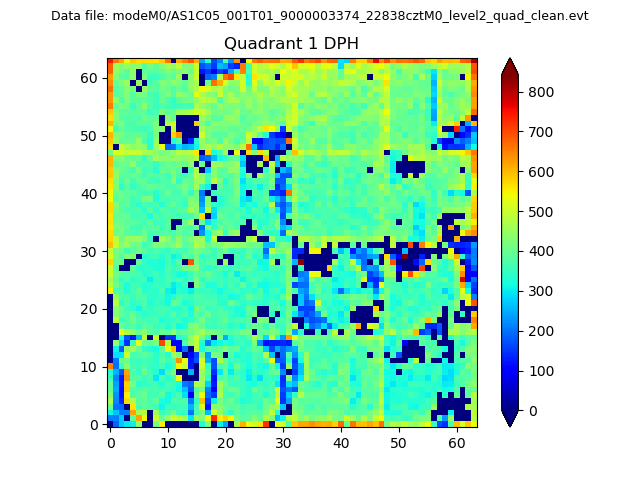 |
Quadrant B |
|---|---|---|---|
| Quadrant D | 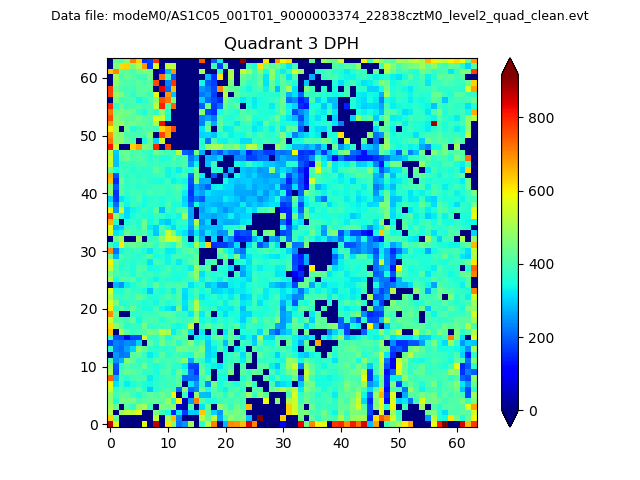 |
 |
Quadrant C |
| Plot type | Count rate plots | Images |
|---|---|---|
| Comparison with Poisson distribution Blue bars denote a histogram of data divided into 1 sec bins. Red curve is a Poisson curve with rate = median count rate of data. |
 |
 |
| Quadrant-wise count rates Data is divided into 100 sec bins |
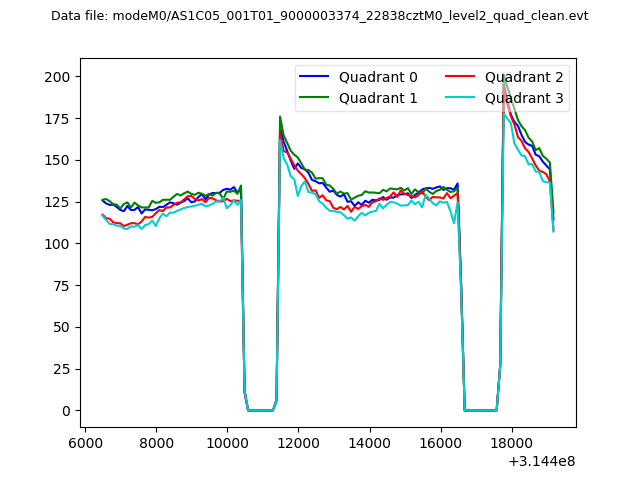 |
|
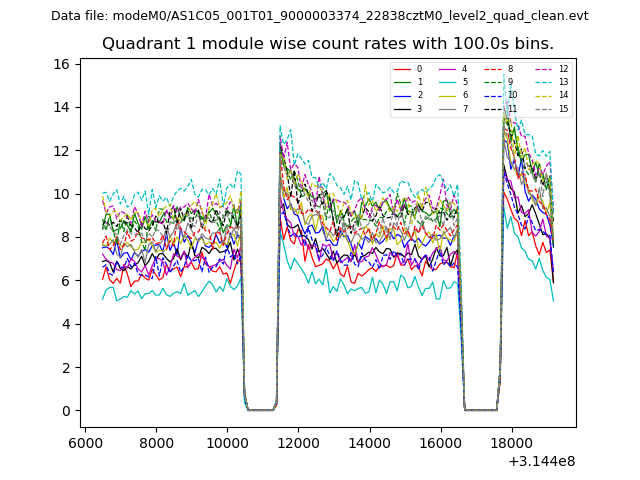
| Module-wise count rates for Quadrant A Data is divided into 100 sec bins |
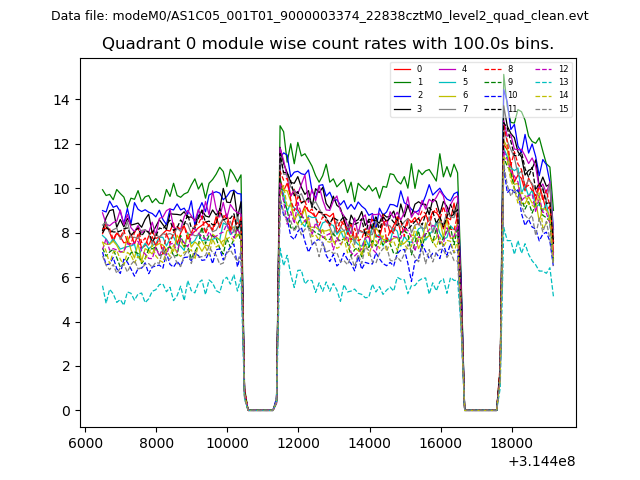 |
 |
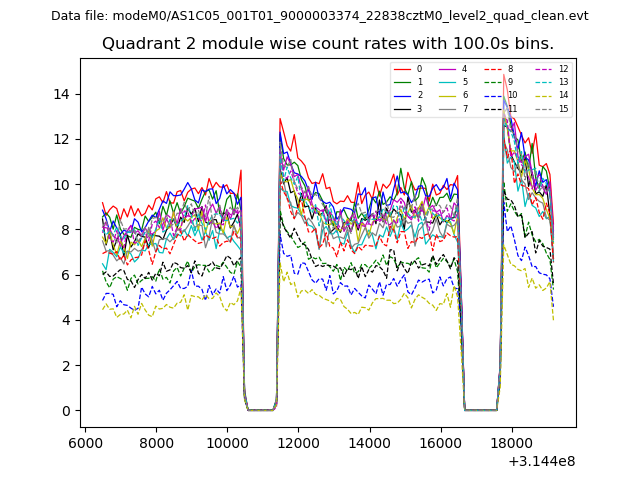
| Module-wise count rates for Quadrant B Data is divided into 100 sec bins |
 |
 |
| Module-wise count rates for Quadrant C Data is divided into 100 sec bins |
 |
 |
| Module-wise count rates for Quadrant D Data is divided into 100 sec bins |
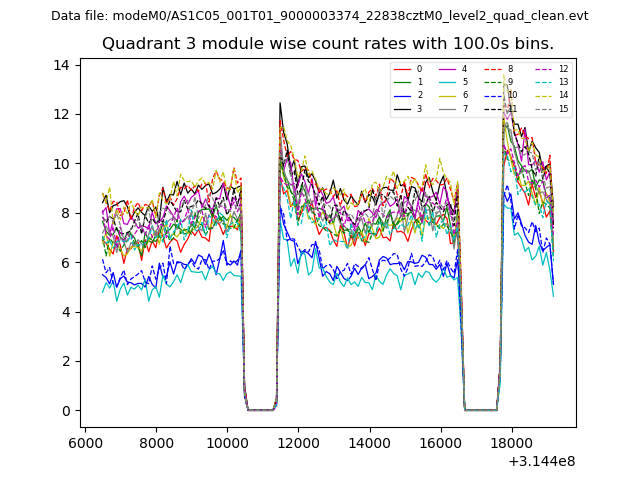 |
 |
| Parameter | Plot |
|---|---|
| CZT HV Monitor | 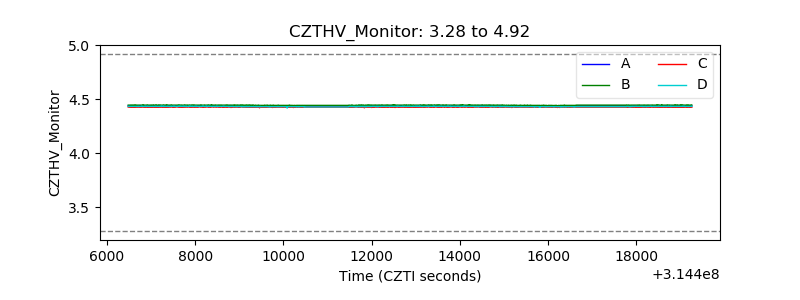 |
| D_VDD | 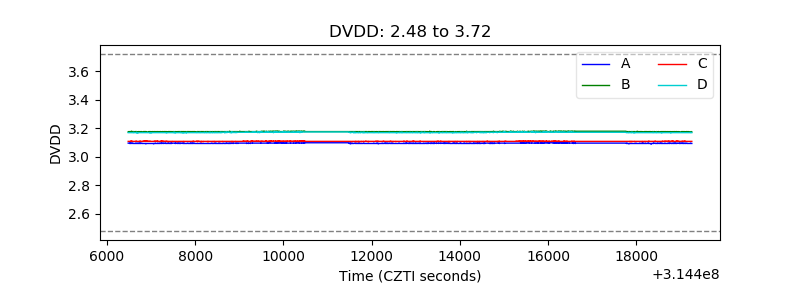 |
| Temperature 1 | 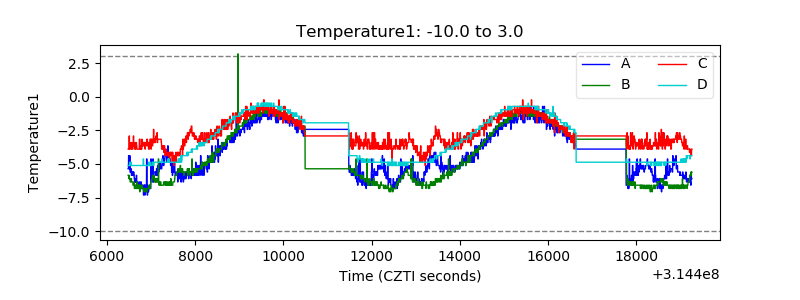 |
| Veto HV Monitor | 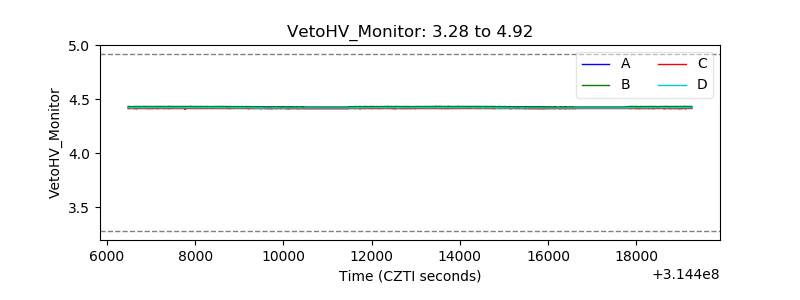 |
| Veto LLD | 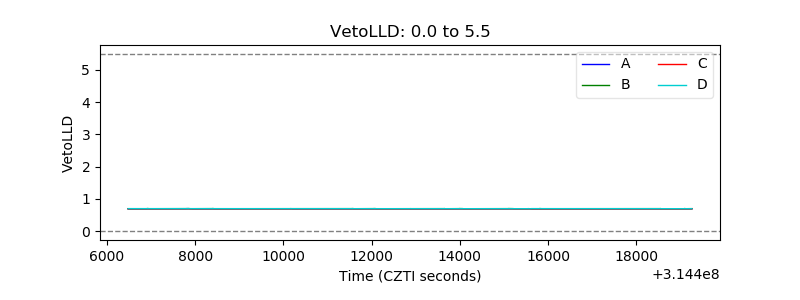 |
| Alpha Counter | 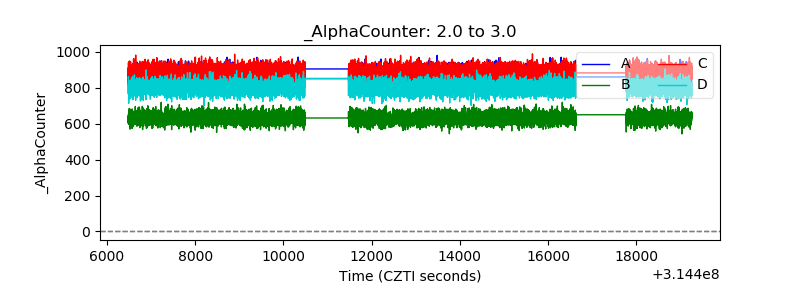 |
| _CPM_Rate | 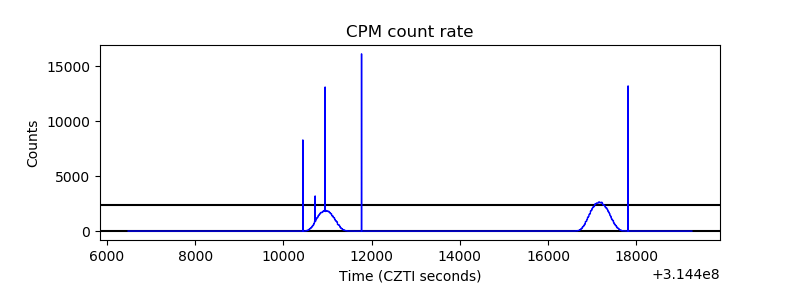 |
| CZT Counter | 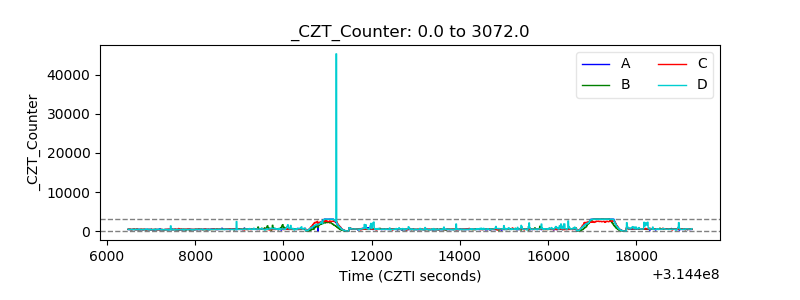 |
| +2.5 Volts monitor |  |
| +5 Volts monitor |  |
| _ROLL_ROT | 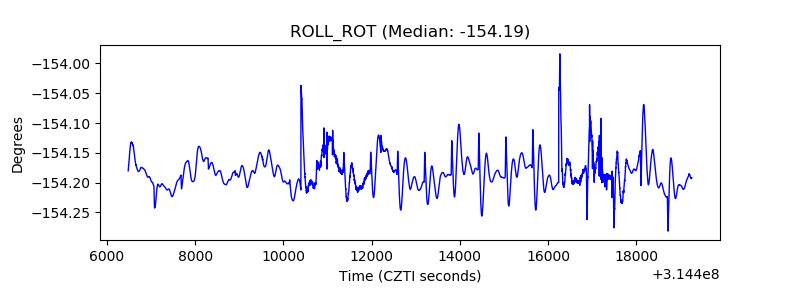 |
| _Roll_DEC | 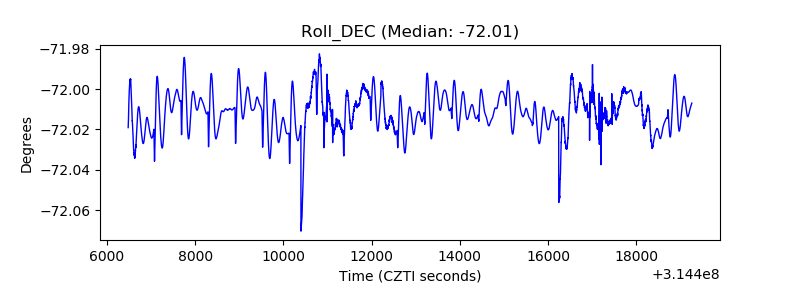 |
| _Roll_RA | 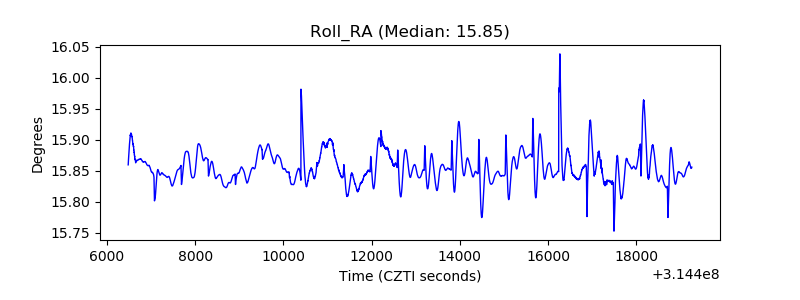 |
| Veto Counter | 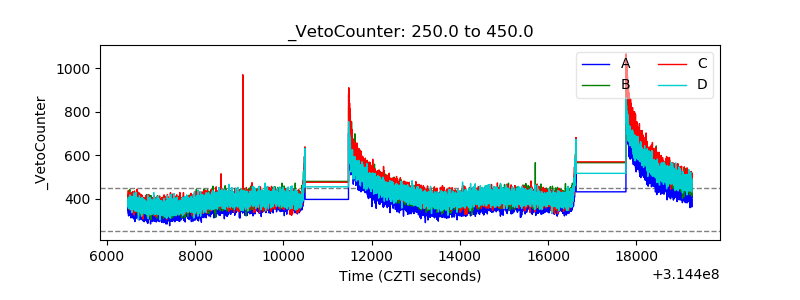 |