| Param | Original file | Final file |
|---|---|---|
| Filename | modeM0/AS1C05_001T01_9000003374_22840cztM0_level2.evt | modeM0/AS1C05_001T01_9000003374_22840cztM0_level2_quad_clean.evt |
| Size (bytes) | 487,442,880 | 141,350,400 |
| Size | 464.9 MB | 134.8 MB |
| Events in quadrant A | 3,342,139 | 979,713 |
| Events in quadrant B | 3,530,498 | 996,911 |
| Events in quadrant C | 3,307,548 | 955,560 |
| Events in quadrant D | 4,167,335 | 922,376 |
| Mode SS | |||
|---|---|---|---|
| Quadrant | BADHDUFLAG | Total packets | Discarded packets |
| A | 0 | 124 | 0 |
| B | 0 | 124 | 0 |
| C | 0 | 124 | 0 |
| D | 0 | 124 | 0 |
| Mode M0 | |||
|---|---|---|---|
| Quadrant | BADHDUFLAG | Total packets | Discarded packets |
| A | 0 | 13684 | 0 |
| B | 0 | 14360 | 0 |
| C | 0 | 13719 | 0 |
| D | 0 | 16319 | 0 |
| Mode M9 | |||
|---|---|---|---|
| Quadrant | BADHDUFLAG | Total packets | Discarded packets |
| A | 0 | 13 | 0 |
| B | 0 | 13 | 0 |
| C | 0 | 13 | 0 |
| D | 0 | 13 | 0 |
| Quadrant | Total seconds | Saturated seconds | Saturation percentage |
|---|---|---|---|
| A | 6115 | 67 | 1.095666% |
| B | 6115 | 106 | 1.733442% |
| C | 6116 | 129 | 2.109222% |
| D | 6116 | 123 | 2.011118% |
Noise dominated data is calculated using 1-second bins in cleaned event files. If a bin has >2000 counts, and if more than 50% of those come from <1% of pixels, then it is considered to be noise-dominated and hence unusable.
| Quadrant | # 1 sec bins | Bins with >0 counts | Bins with >2000 counts | High rate bins dominated by noise | Noise dominated (total time) | Noise dominated (detector-on time) | Marked lightcurve |
|---|---|---|---|---|---|---|---|
| A | 7400 | 6116 | 0 | 0 | 0.00% | 0.00% | 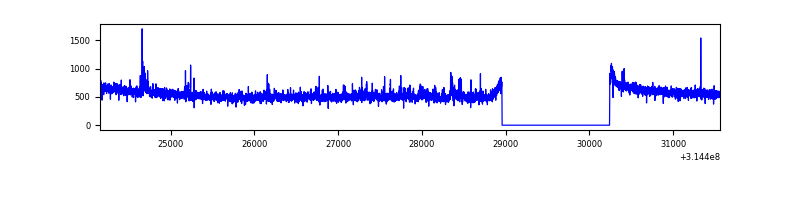 |
| B | 7400 | 6116 | 6 | 6 | 0.08% | 0.10% | 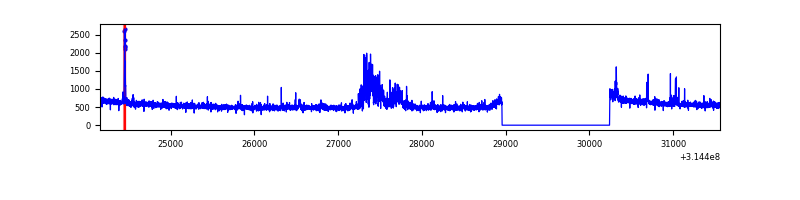 |
| C | 7401 | 6117 | 0 | 0 | 0.00% | 0.00% | 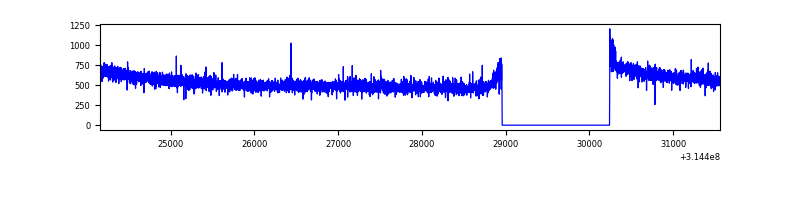 |
| D | 7401 | 6117 | 61 | 61 | 0.82% | 1.00% | 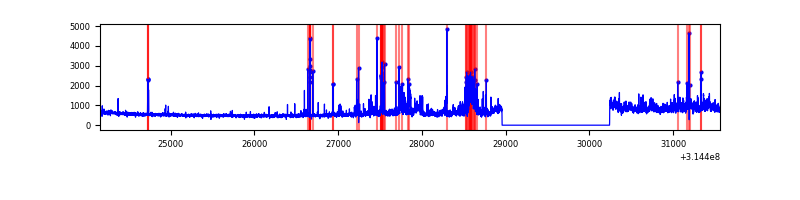 |
Top three noisy pixels from each quadrant. If the there are fewer than three noisy pixels in the level2.evt file, extra rows are filled as -1
| Pixel properties | Quadrant properties | ||||||
|---|---|---|---|---|---|---|---|
| Quadrant | DetID | PixID | Counts | Sigma | Mean | Median | Sigma |
| A | 11 | 47 | 106960 | 646.63 | 837 | 824 | 164.1 |
| A | 13 | 254 | 10635 | 59.77 | 837 | 824 | 164.1 |
| A | 0 | 226 | 7340 | 39.7 | 837 | 824 | 164.1 |
| B | 0 | 190 | 191310 | 1264.14 | 832 | 814 | 150.7 |
| B | 5 | 172 | 26076 | 167.64 | 832 | 814 | 150.7 |
| B | 3 | 64 | 23886 | 153.11 | 832 | 814 | 150.7 |
| C | 14 | 238 | 131759 | 708.85 | 812 | 818 | 184.7 |
| C | 0 | 10 | 6237 | 29.34 | 812 | 818 | 184.7 |
| C | 13 | 61 | 5668 | 26.26 | 812 | 818 | 184.7 |
| D | 7 | 238 | 621888 | 3188.12 | 818 | 797 | 194.8 |
| D | 1 | 52 | 306482 | 1569.11 | 818 | 797 | 194.8 |
| D | 12 | 233 | 38163 | 191.8 | 818 | 797 | 194.8 |
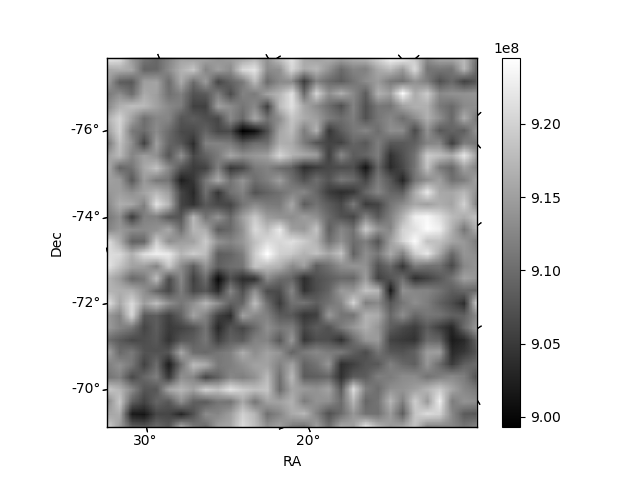
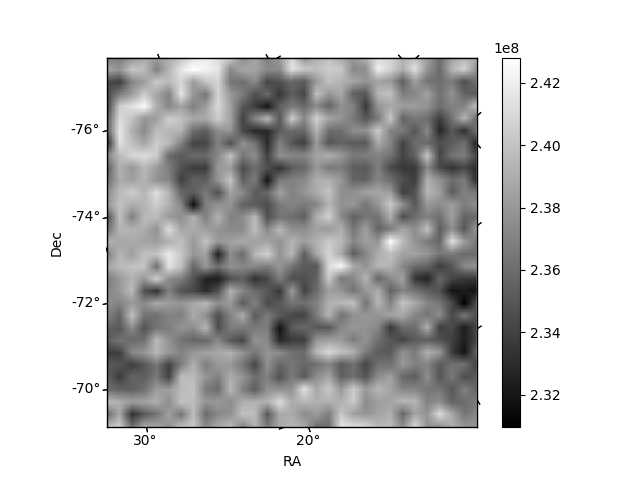
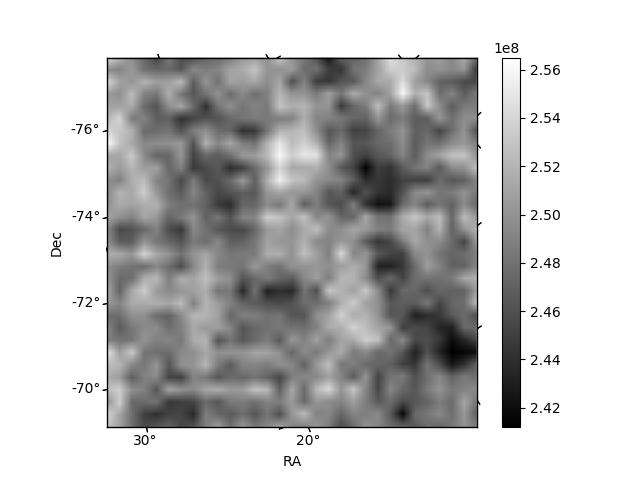
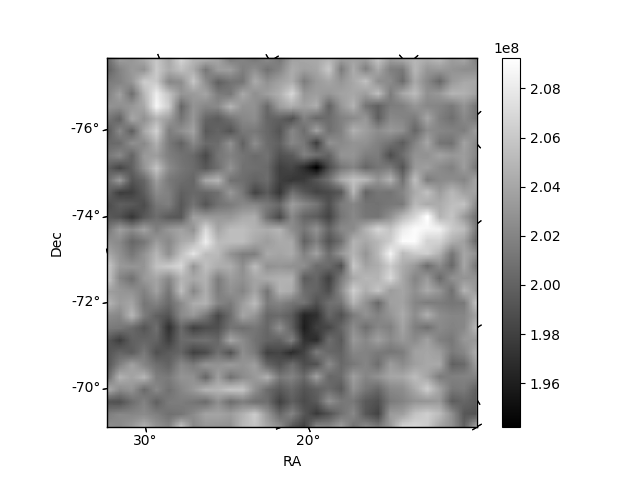
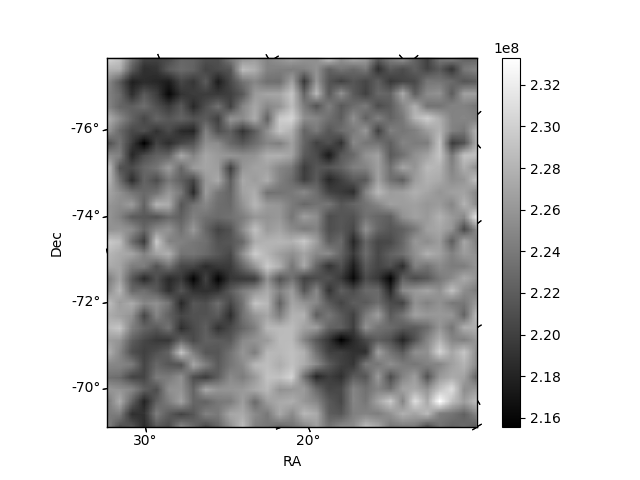
Histogram calculated using DETX and DETY for each event in the final _common_clean file
| Quadrant A | 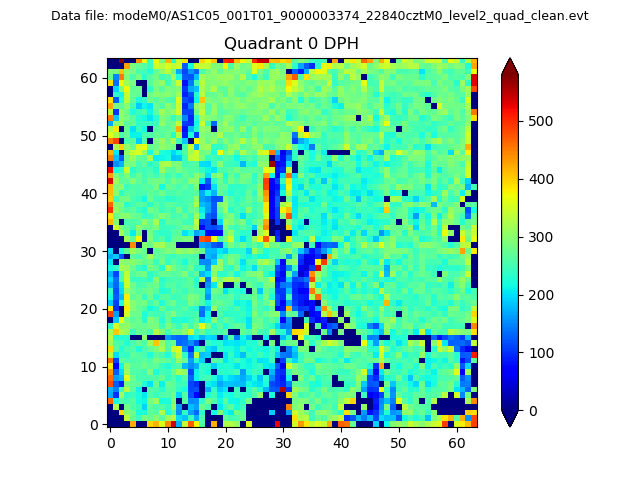 |
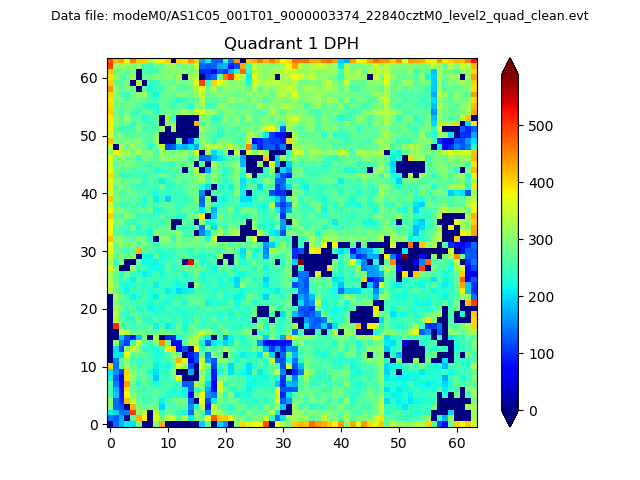 |
Quadrant B |
|---|---|---|---|
| Quadrant D |  |
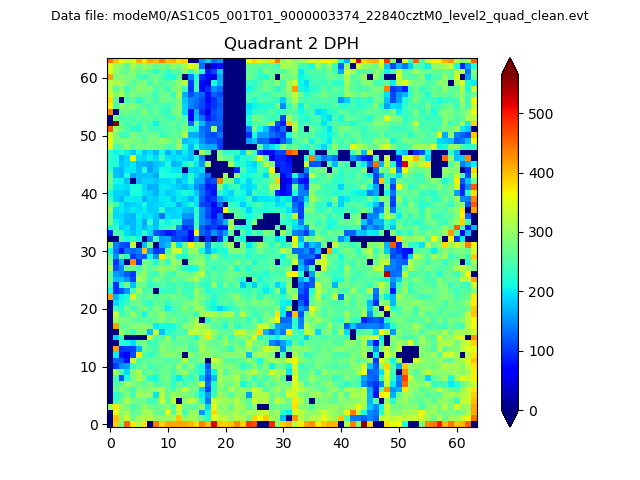 |
Quadrant C |
| Plot type | Count rate plots | Images |
|---|---|---|
| Comparison with Poisson distribution Blue bars denote a histogram of data divided into 1 sec bins. Red curve is a Poisson curve with rate = median count rate of data. |
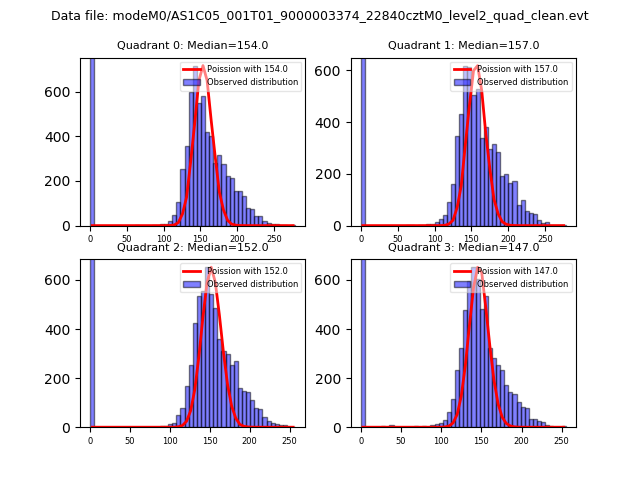 |
 |
| Quadrant-wise count rates Data is divided into 100 sec bins |
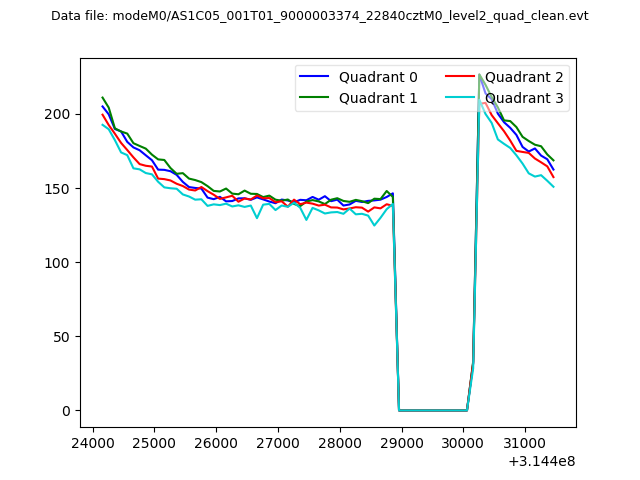 |
|
| Module-wise count rates for Quadrant A Data is divided into 100 sec bins |
 |
 |
| Module-wise count rates for Quadrant B Data is divided into 100 sec bins |
 |
 |
| Module-wise count rates for Quadrant C Data is divided into 100 sec bins |
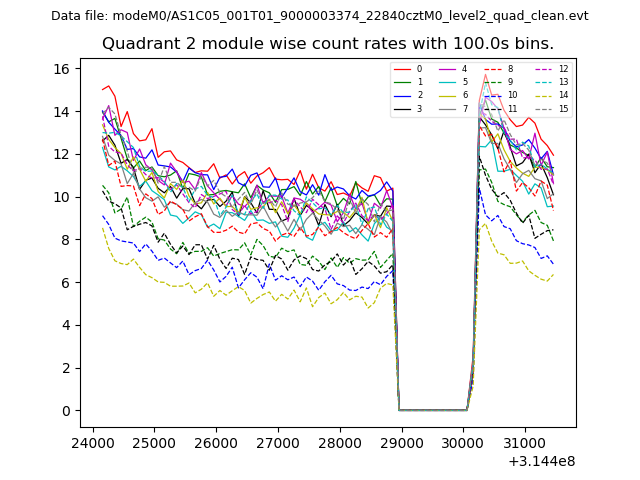 |
 |
| Module-wise count rates for Quadrant D Data is divided into 100 sec bins |
 |
 |
| Parameter | Plot |
|---|---|
| CZT HV Monitor | 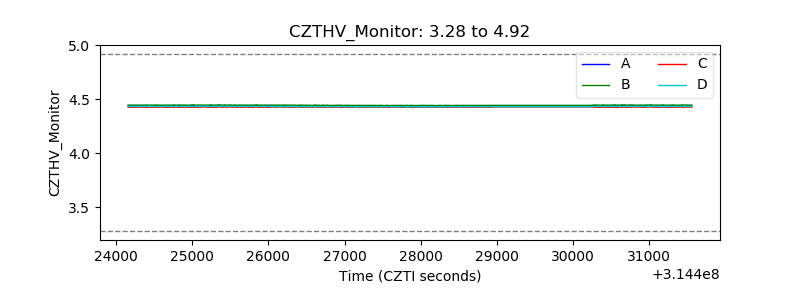 |
| D_VDD | 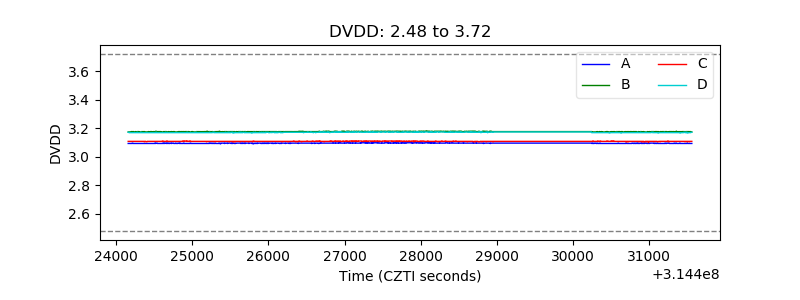 |
| Temperature 1 | 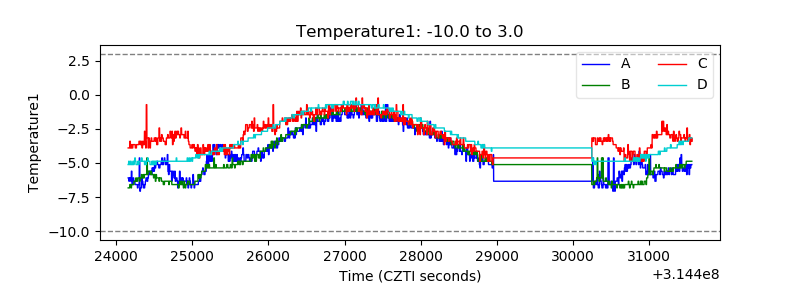 |
| Veto HV Monitor | 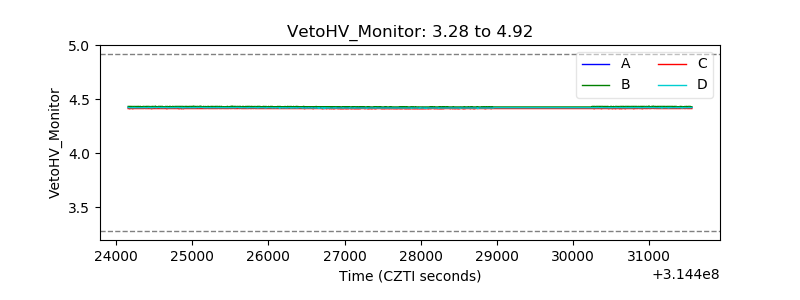 |
| Veto LLD | 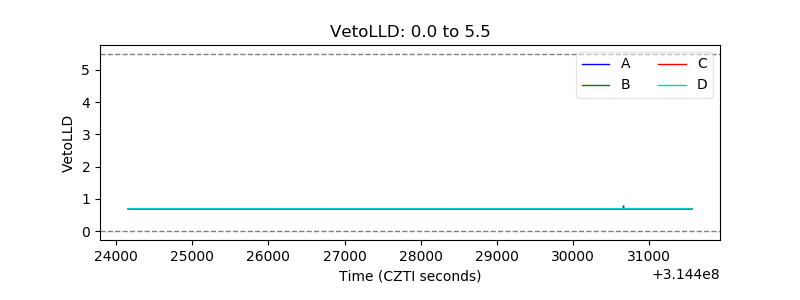 |
| Alpha Counter | 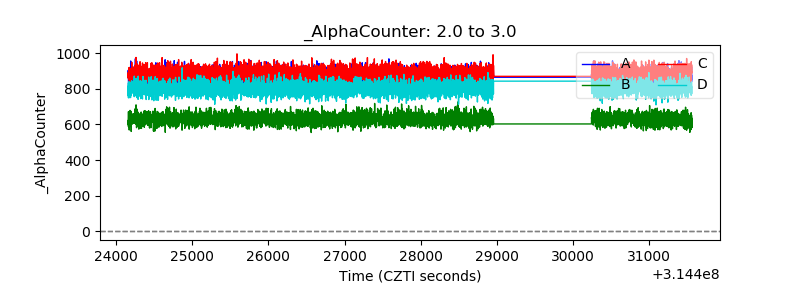 |
| _CPM_Rate | 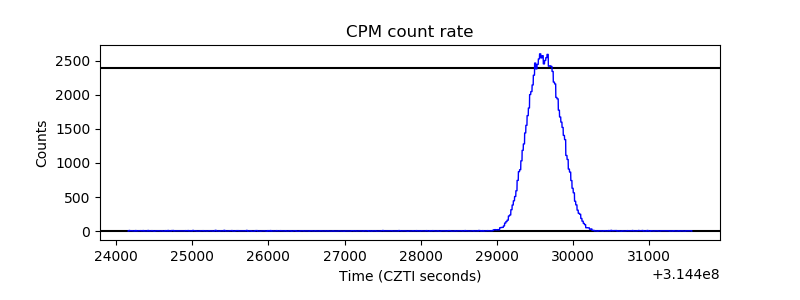 |
| CZT Counter | 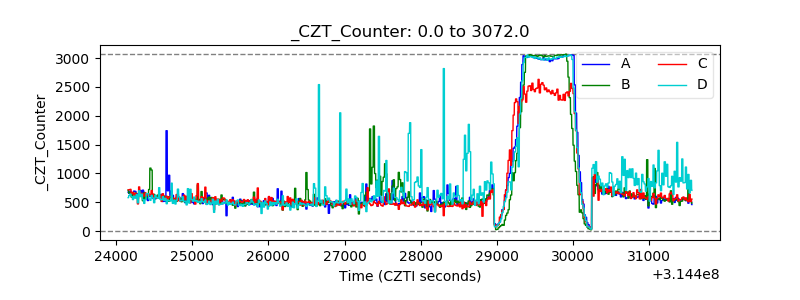 |
| +2.5 Volts monitor |  |
| +5 Volts monitor |  |
| _ROLL_ROT | 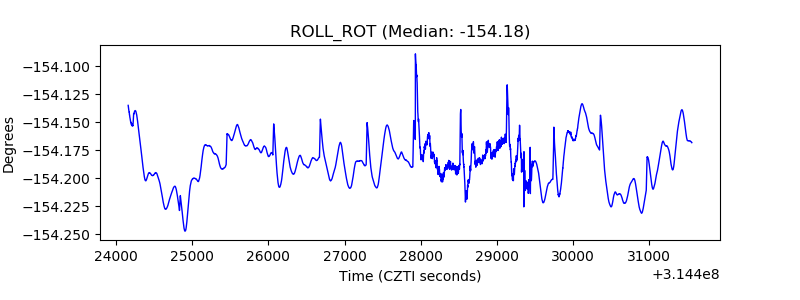 |
| _Roll_DEC | 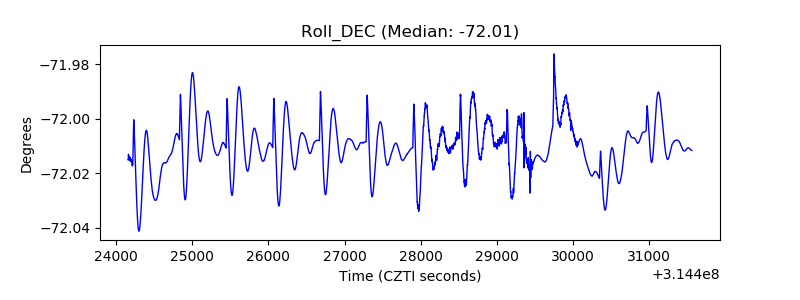 |
| _Roll_RA | 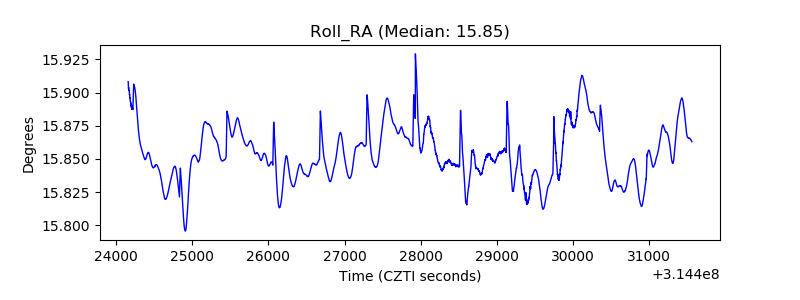 |
| Veto Counter | 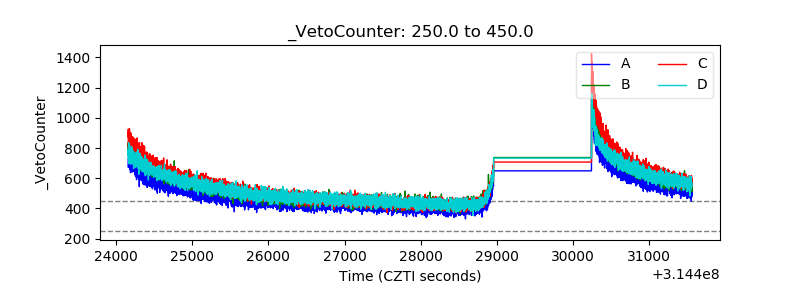 |