| Param | Original file | Final file |
|---|---|---|
| Filename | modeM0/AS1C05_001T01_9000003374_22843cztM0_level2.evt | modeM0/AS1C05_001T01_9000003374_22843cztM0_level2_quad_clean.evt |
| Size (bytes) | 501,258,240 | 135,792,000 |
| Size | 478.0 MB | 129.5 MB |
| Events in quadrant A | 3,405,153 | 935,252 |
| Events in quadrant B | 3,444,109 | 941,875 |
| Events in quadrant C | 3,219,331 | 905,262 |
| Events in quadrant D | 4,664,647 | 870,910 |
| Mode SS | |||
|---|---|---|---|
| Quadrant | BADHDUFLAG | Total packets | Discarded packets |
| A | 0 | 136 | 0 |
| B | 0 | 136 | 0 |
| C | 0 | 136 | 0 |
| D | 0 | 136 | 0 |
| Mode M0 | |||
|---|---|---|---|
| Quadrant | BADHDUFLAG | Total packets | Discarded packets |
| A | 0 | 14199 | 0 |
| B | 0 | 14127 | 0 |
| C | 0 | 13655 | 0 |
| D | 0 | 18230 | 0 |
| Mode M9 | |||
|---|---|---|---|
| Quadrant | BADHDUFLAG | Total packets | Discarded packets |
| A | 0 | 10 | 0 |
| B | 0 | 10 | 0 |
| C | 0 | 10 | 0 |
| D | 0 | 10 | 0 |
| Quadrant | Total seconds | Saturated seconds | Saturation percentage |
|---|---|---|---|
| A | 6587 | 137 | 2.079854% |
| B | 6587 | 152 | 2.307576% |
| C | 6588 | 168 | 2.550091% |
| D | 6588 | 331 | 5.024287% |
Noise dominated data is calculated using 1-second bins in cleaned event files. If a bin has >2000 counts, and if more than 50% of those come from <1% of pixels, then it is considered to be noise-dominated and hence unusable.
| Quadrant | # 1 sec bins | Bins with >0 counts | Bins with >2000 counts | High rate bins dominated by noise | Noise dominated (total time) | Noise dominated (detector-on time) | Marked lightcurve |
|---|---|---|---|---|---|---|---|
| A | 7562 | 6589 | 0 | 0 | 0.00% | 0.00% | 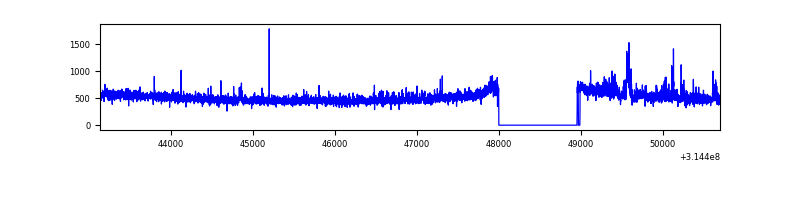 |
| B | 7562 | 6589 | 3 | 3 | 0.04% | 0.05% | 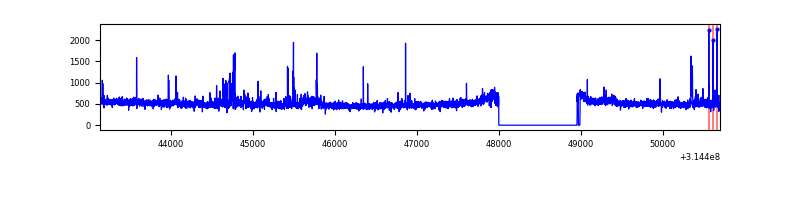 |
| C | 7563 | 6590 | 0 | 0 | 0.00% | 0.00% | 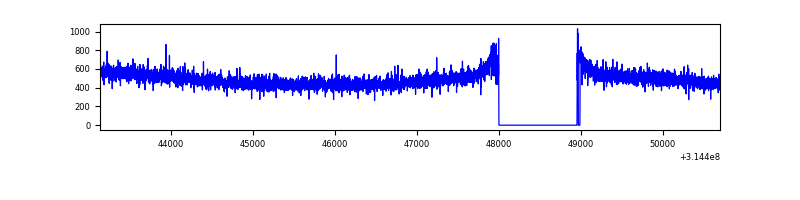 |
| D | 7563 | 6590 | 152 | 152 | 2.01% | 2.31% | 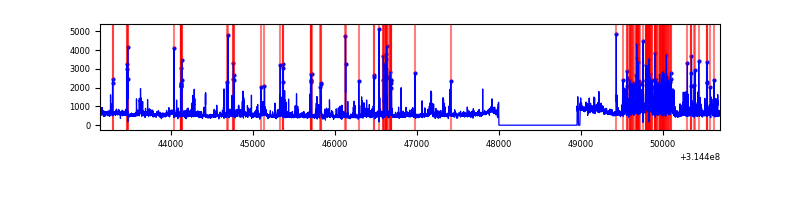 |
Top three noisy pixels from each quadrant. If the there are fewer than three noisy pixels in the level2.evt file, extra rows are filled as -1
| Pixel properties | Quadrant properties | ||||||
|---|---|---|---|---|---|---|---|
| Quadrant | DetID | PixID | Counts | Sigma | Mean | Median | Sigma |
| A | 11 | 47 | 119666 | 716.41 | 832 | 816 | 165.9 |
| A | 13 | 252 | 74461 | 443.92 | 832 | 816 | 165.9 |
| A | 13 | 254 | 12067 | 67.82 | 832 | 816 | 165.9 |
| B | 0 | 190 | 100455 | 654.23 | 823 | 803 | 152.3 |
| B | 4 | 21 | 30681 | 196.15 | 823 | 803 | 152.3 |
| B | 0 | 189 | 28808 | 183.86 | 823 | 803 | 152.3 |
| C | 14 | 238 | 129114 | 710.66 | 791 | 795 | 180.6 |
| C | 13 | 61 | 5606 | 26.64 | 791 | 795 | 180.6 |
| C | 0 | 10 | 3318 | 13.97 | 791 | 795 | 180.6 |
| D | 1 | 239 | 636243 | 3266.4 | 802 | 778 | 194.5 |
| D | 7 | 238 | 366325 | 1878.97 | 802 | 778 | 194.5 |
| D | 1 | 52 | 313334 | 1606.59 | 802 | 778 | 194.5 |
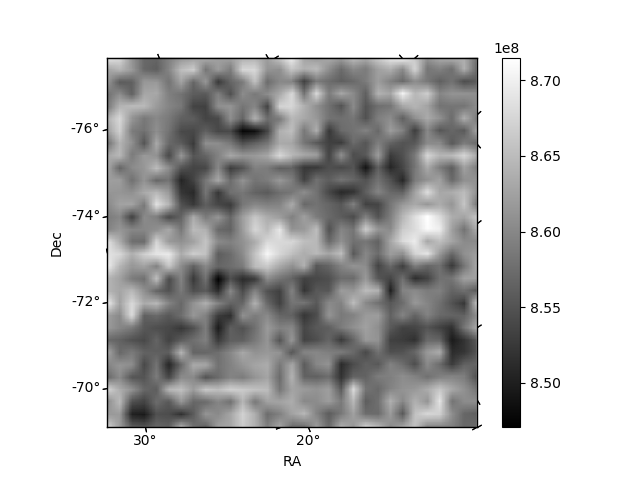
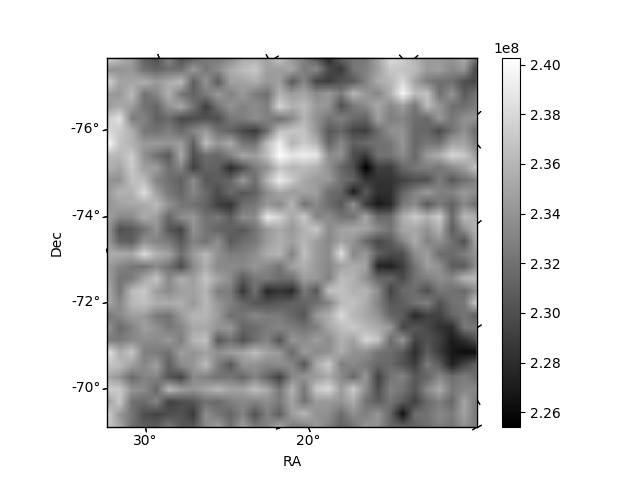
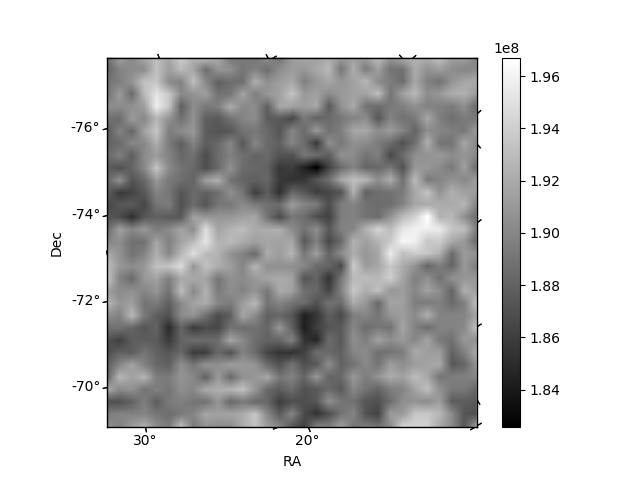
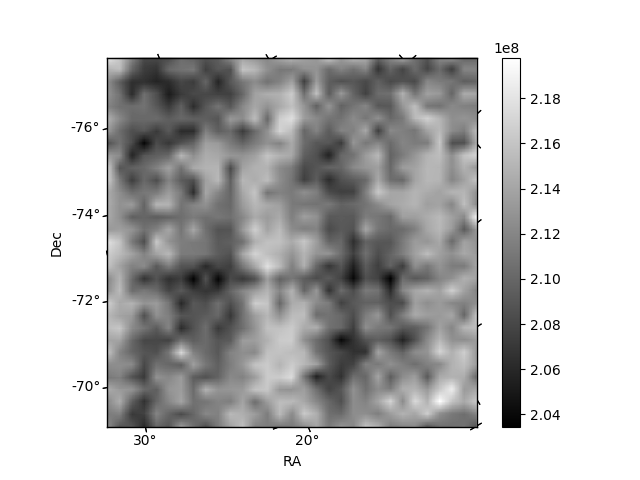
Histogram calculated using DETX and DETY for each event in the final _common_clean file
| Quadrant A | 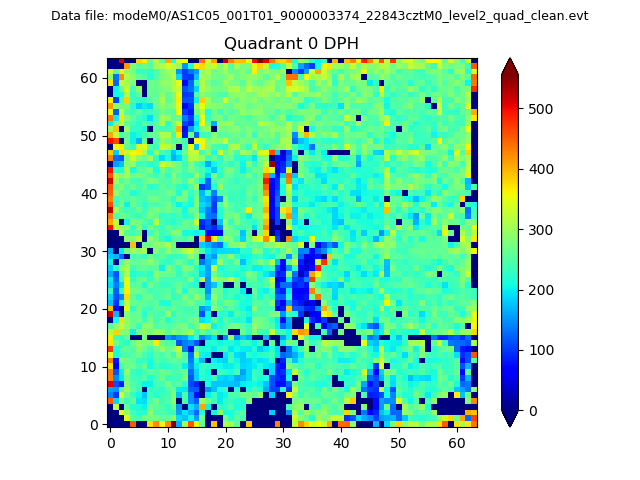 |
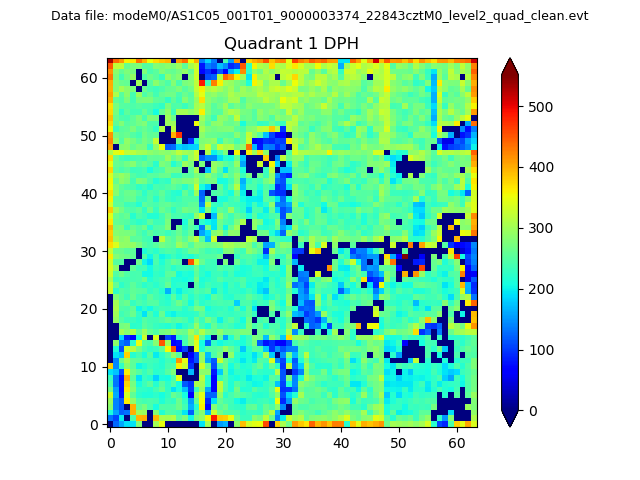 |
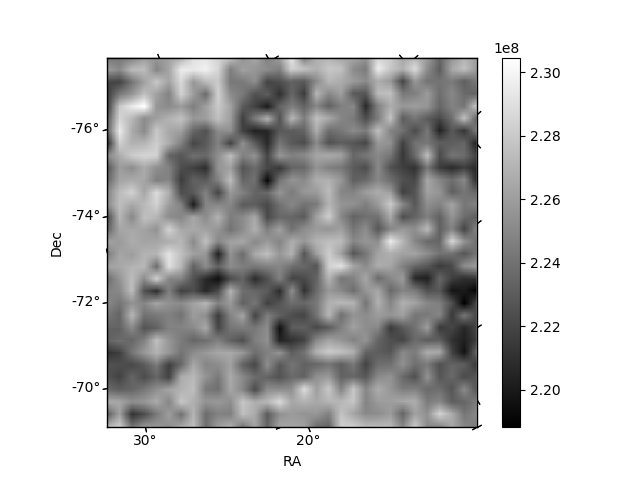
Quadrant B |
|---|---|---|---|
| Quadrant D |  |
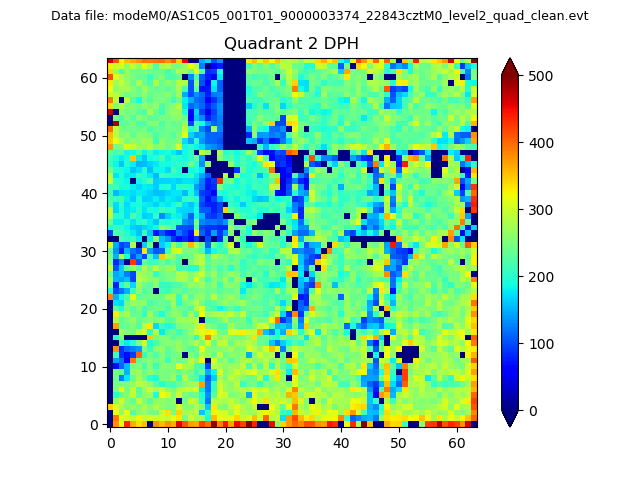 |
Quadrant C |
| Plot type | Count rate plots | Images |
|---|---|---|
| Comparison with Poisson distribution Blue bars denote a histogram of data divided into 1 sec bins. Red curve is a Poisson curve with rate = median count rate of data. |
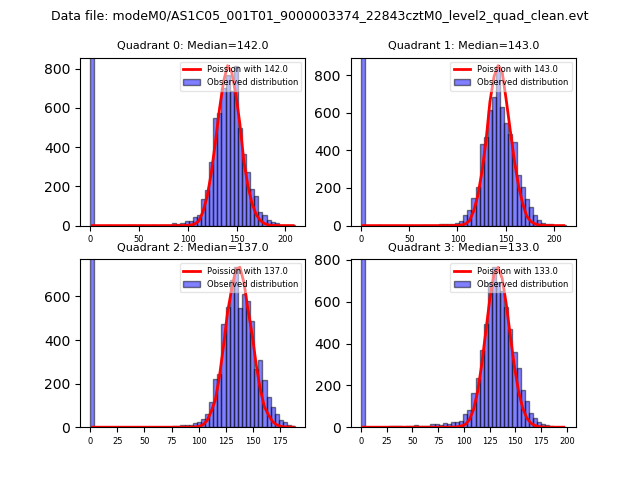 |
 |
| Quadrant-wise count rates Data is divided into 100 sec bins |
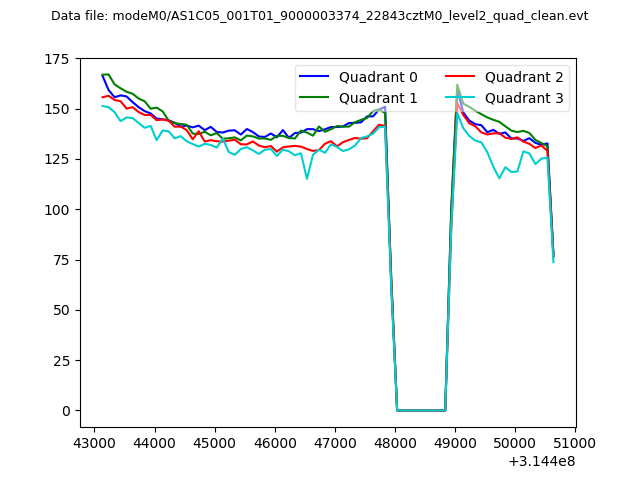 |
|
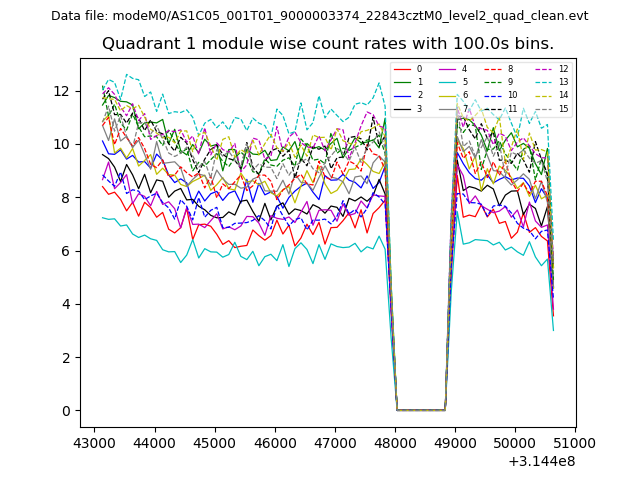
| Module-wise count rates for Quadrant A Data is divided into 100 sec bins |
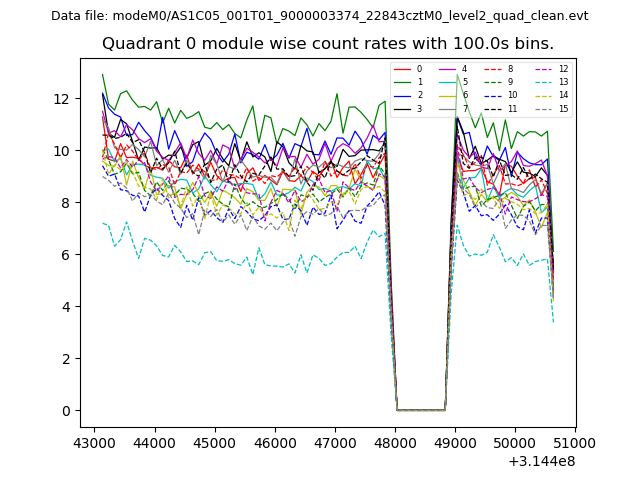 |
 |
| Module-wise count rates for Quadrant B Data is divided into 100 sec bins |
 |
 |
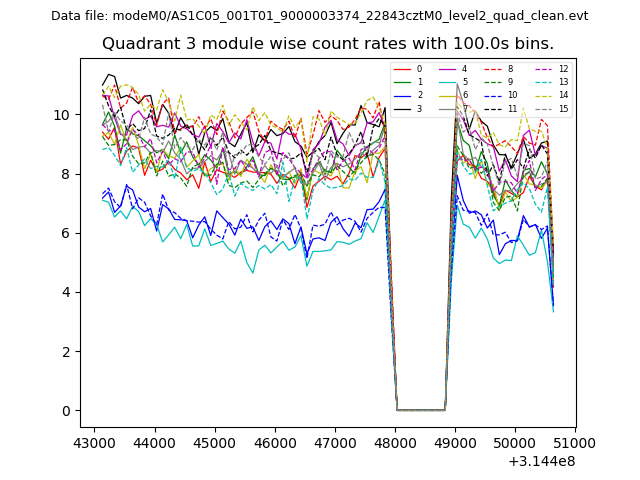
| Module-wise count rates for Quadrant C Data is divided into 100 sec bins |
 |
 |
| Module-wise count rates for Quadrant D Data is divided into 100 sec bins |
 |
 |
| Parameter | Plot |
|---|---|
| CZT HV Monitor |  |
| D_VDD | 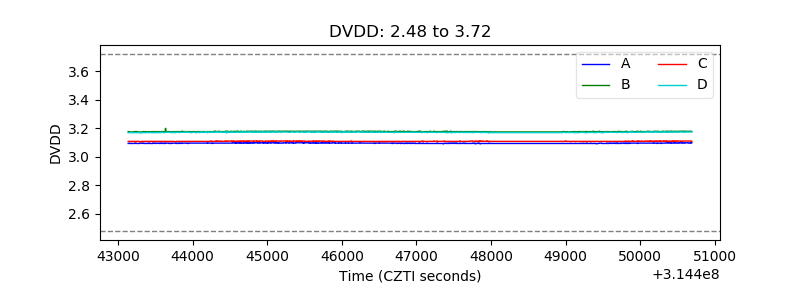 |
| Temperature 1 | 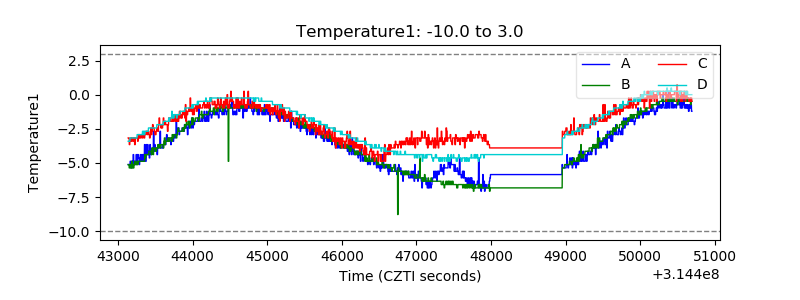 |
| Veto HV Monitor | 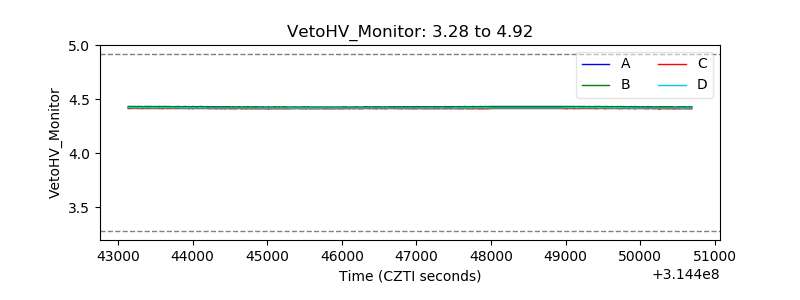 |
| Veto LLD |  |
| Alpha Counter | 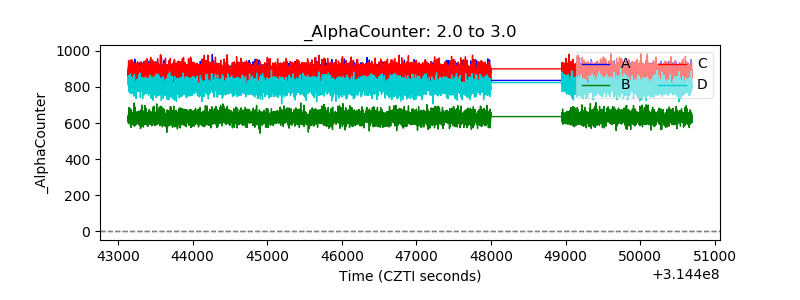 |
| _CPM_Rate | 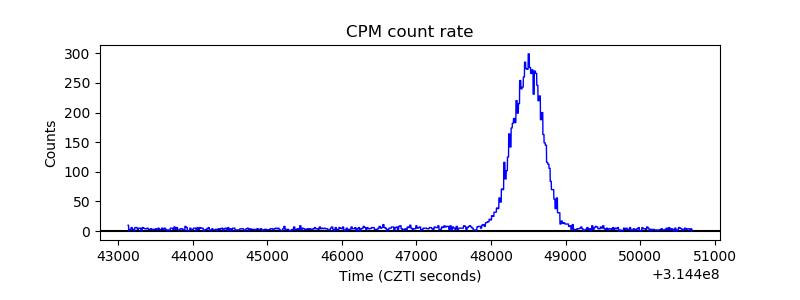 |
| CZT Counter | 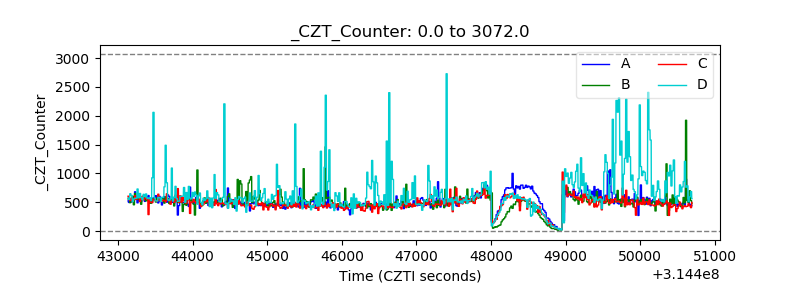 |
| +2.5 Volts monitor |  |
| +5 Volts monitor |  |
| _ROLL_ROT |  |
| _Roll_DEC | 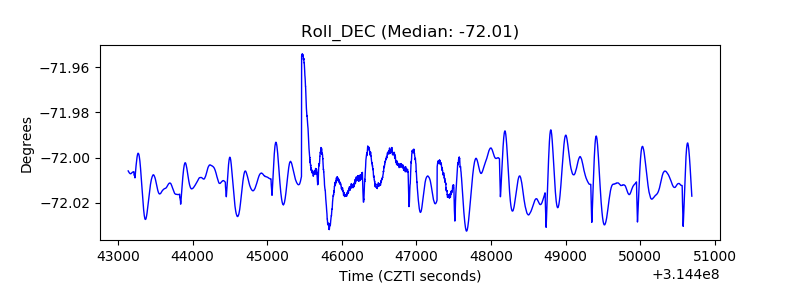 |
| _Roll_RA | 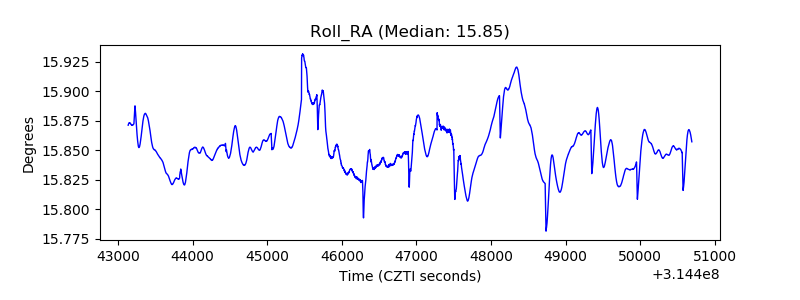 |
| Veto Counter |  |