| Param | Original file | Final file |
|---|---|---|
| Filename | modeM0/AS1C05_001T01_9000003374_22844cztM0_level2.evt | modeM0/AS1C05_001T01_9000003374_22844cztM0_level2_quad_clean.evt |
| Size (bytes) | 506,874,240 | 126,354,240 |
| Size | 483.4 MB | 120.5 MB |
| Events in quadrant A | 3,826,893 | 863,076 |
| Events in quadrant B | 3,213,349 | 875,827 |
| Events in quadrant C | 3,039,741 | 837,816 |
| Events in quadrant D | 4,828,024 | 795,289 |
| Mode SS | |||
|---|---|---|---|
| Quadrant | BADHDUFLAG | Total packets | Discarded packets |
| A | 0 | 132 | 0 |
| B | 0 | 132 | 0 |
| C | 0 | 132 | 0 |
| D | 0 | 132 | 0 |
| Mode M0 | |||
|---|---|---|---|
| Quadrant | BADHDUFLAG | Total packets | Discarded packets |
| A | 0 | 15562 | 0 |
| B | 0 | 13661 | 0 |
| C | 0 | 13361 | 0 |
| D | 0 | 18716 | 0 |
| Mode M9 | |||
|---|---|---|---|
| Quadrant | BADHDUFLAG | Total packets | Discarded packets |
| A | 0 | 7 | 0 |
| B | 0 | 7 | 0 |
| C | 0 | 7 | 0 |
| D | 0 | 7 | 0 |
| Quadrant | Total seconds | Saturated seconds | Saturation percentage |
|---|---|---|---|
| A | 6526 | 93 | 1.425069% |
| B | 6526 | 93 | 1.425069% |
| C | 6526 | 107 | 1.639595% |
| D | 6527 | 435 | 6.664624% |
Noise dominated data is calculated using 1-second bins in cleaned event files. If a bin has >2000 counts, and if more than 50% of those come from <1% of pixels, then it is considered to be noise-dominated and hence unusable.
| Quadrant | # 1 sec bins | Bins with >0 counts | Bins with >2000 counts | High rate bins dominated by noise | Noise dominated (total time) | Noise dominated (detector-on time) | Marked lightcurve |
|---|---|---|---|---|---|---|---|
| A | 7196 | 6527 | 7 | 7 | 0.10% | 0.11% | 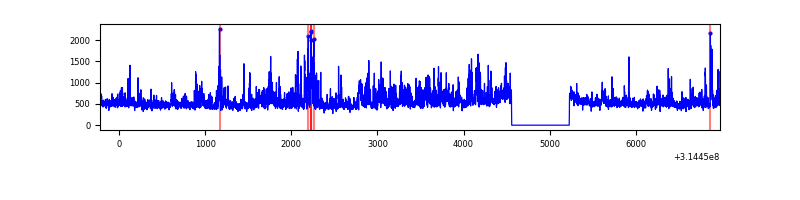 |
| B | 7196 | 6527 | 3 | 3 | 0.04% | 0.05% | 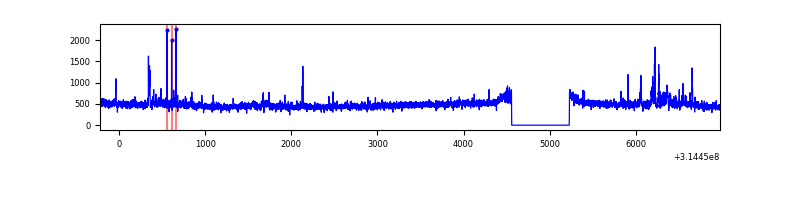 |
| C | 7196 | 6527 | 1 | 1 | 0.01% | 0.02% | 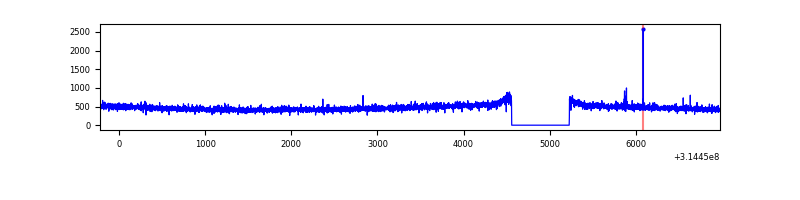 |
| D | 7197 | 6528 | 322 | 322 | 4.47% | 4.93% | 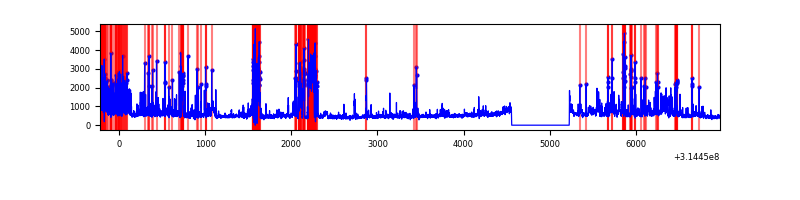 |
Top three noisy pixels from each quadrant. If the there are fewer than three noisy pixels in the level2.evt file, extra rows are filled as -1
| Pixel properties | Quadrant properties | ||||||
|---|---|---|---|---|---|---|---|
| Quadrant | DetID | PixID | Counts | Sigma | Mean | Median | Sigma |
| A | 11 | 47 | 792657 | 4997.67 | 786 | 769 | 158.5 |
| A | 13 | 254 | 12037 | 71.11 | 786 | 769 | 158.5 |
| A | 0 | 226 | 6827 | 38.23 | 786 | 769 | 158.5 |
| B | 0 | 190 | 89570 | 608.41 | 781 | 762 | 146.0 |
| B | 0 | 228 | 23440 | 155.36 | 781 | 762 | 146.0 |
| B | 4 | 21 | 17572 | 115.16 | 781 | 762 | 146.0 |
| C | 14 | 238 | 119991 | 691.56 | 747 | 750 | 172.4 |
| C | 0 | 207 | 6853 | 35.4 | 747 | 750 | 172.4 |
| C | 13 | 61 | 5227 | 25.97 | 747 | 750 | 172.4 |
| D | 1 | 239 | 992407 | 5463.0 | 745 | 721 | 181.5 |
| D | 13 | 249 | 418543 | 2301.7 | 745 | 721 | 181.5 |
| D | 7 | 238 | 220595 | 1211.24 | 745 | 721 | 181.5 |
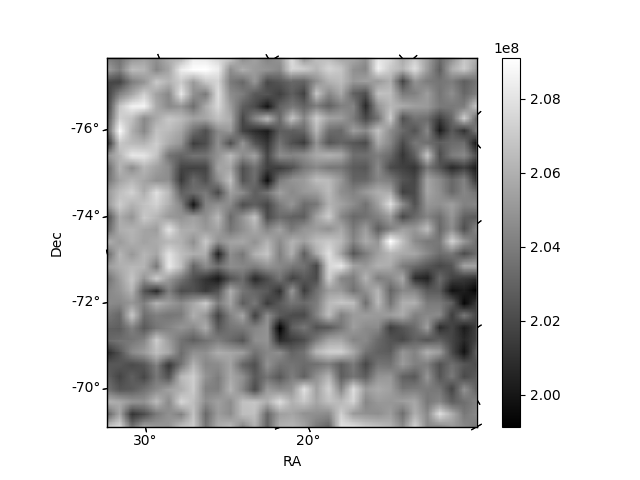
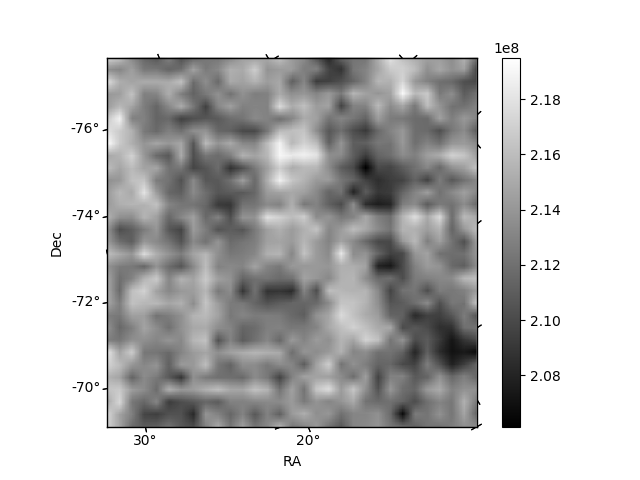
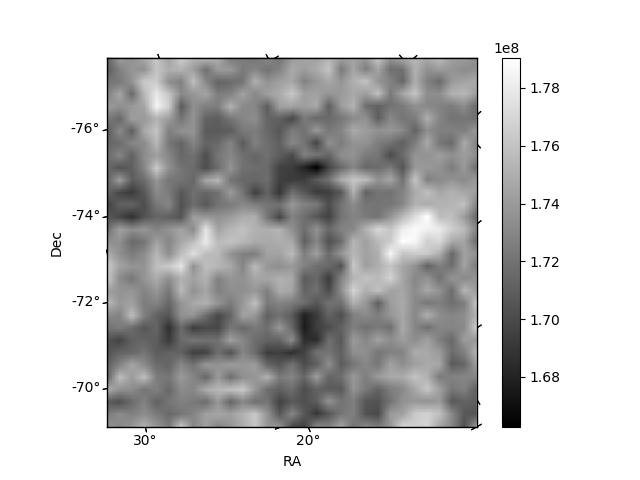
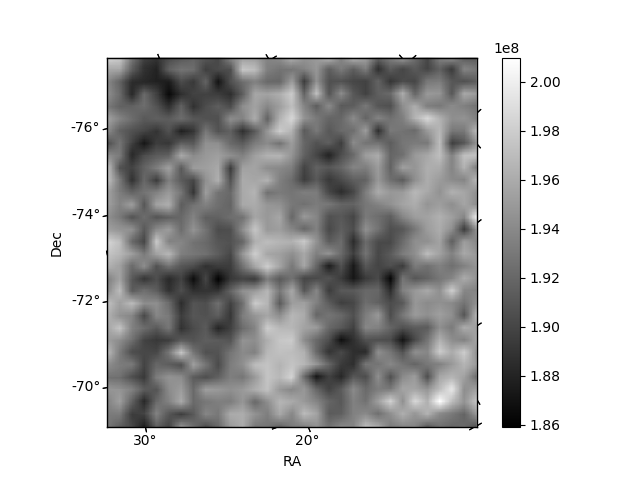
Histogram calculated using DETX and DETY for each event in the final _common_clean file
| Quadrant A | 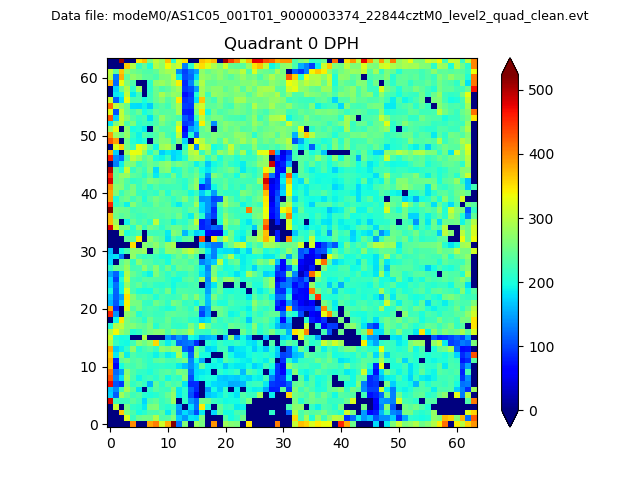 |
 |
Quadrant B |
|---|---|---|---|
| Quadrant D |  |
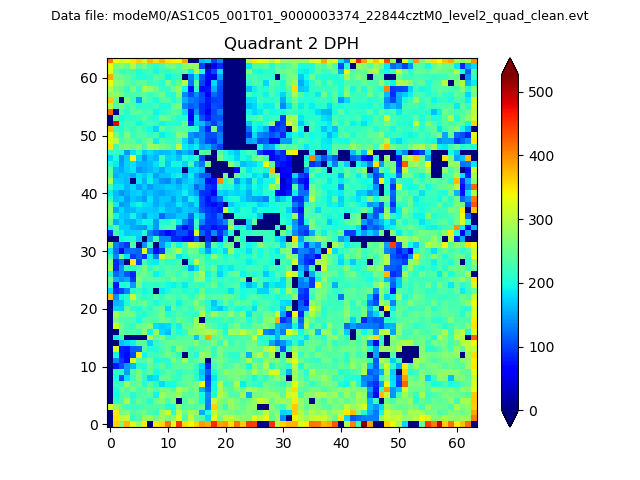 |
Quadrant C |
| Plot type | Count rate plots | Images |
|---|---|---|
| Comparison with Poisson distribution Blue bars denote a histogram of data divided into 1 sec bins. Red curve is a Poisson curve with rate = median count rate of data. |
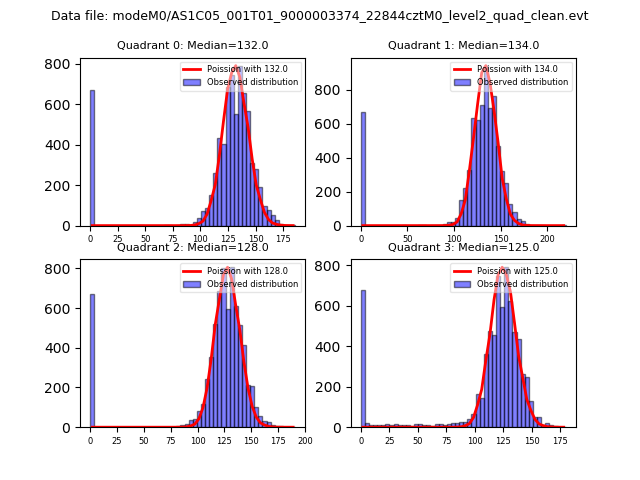 |
 |
| Quadrant-wise count rates Data is divided into 100 sec bins |
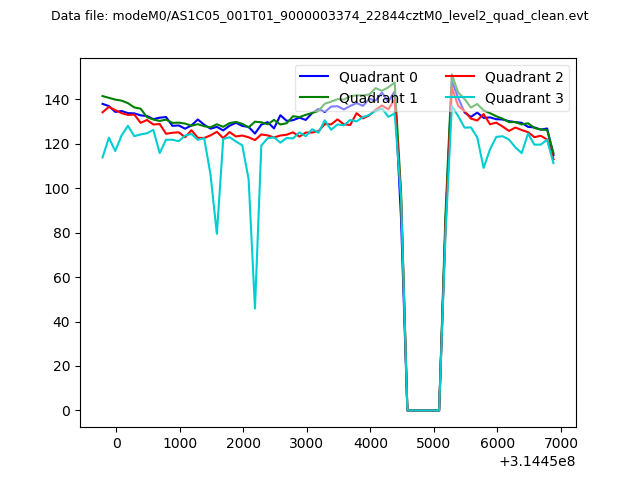 |
|
| Module-wise count rates for Quadrant A Data is divided into 100 sec bins |
 |
 |
| Module-wise count rates for Quadrant B Data is divided into 100 sec bins |
 |
 |
| Module-wise count rates for Quadrant C Data is divided into 100 sec bins |
 |
 |
| Module-wise count rates for Quadrant D Data is divided into 100 sec bins |
 |
 |
| Parameter | Plot |
|---|---|
| CZT HV Monitor |  |
| D_VDD | 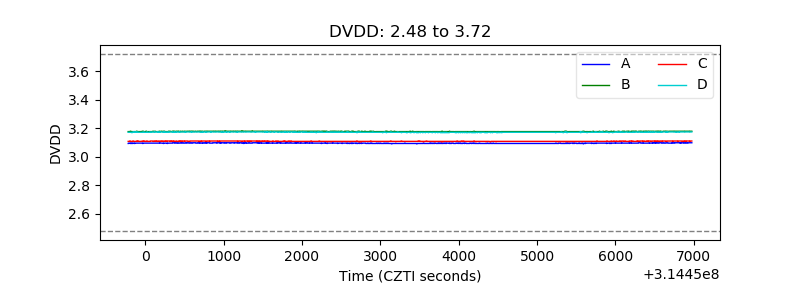 |
| Temperature 1 | 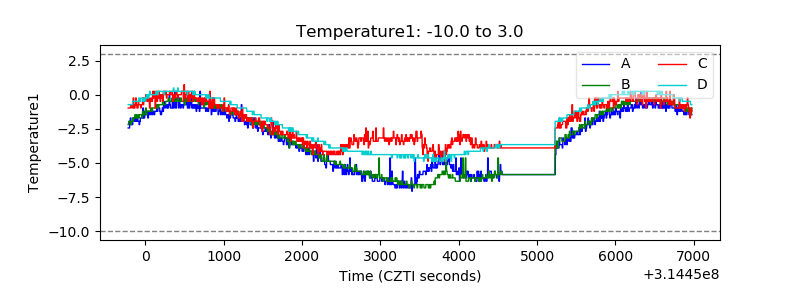 |
| Veto HV Monitor | 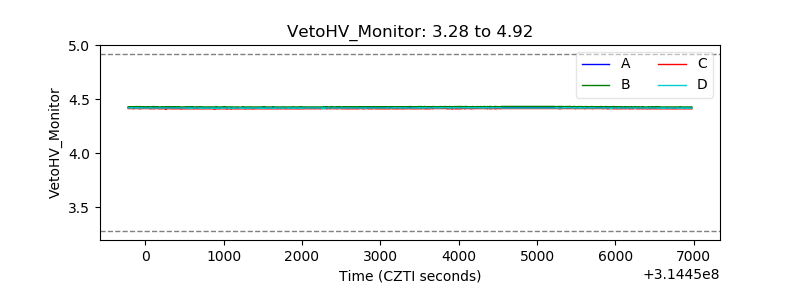 |
| Veto LLD | 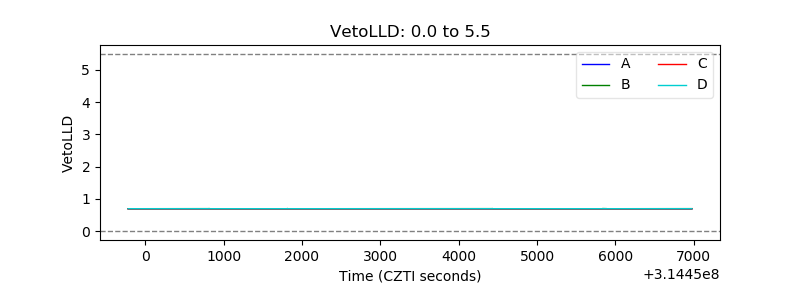 |
| Alpha Counter | 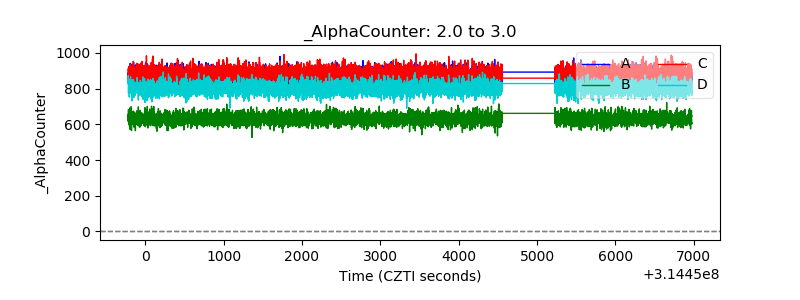 |
| _CPM_Rate | 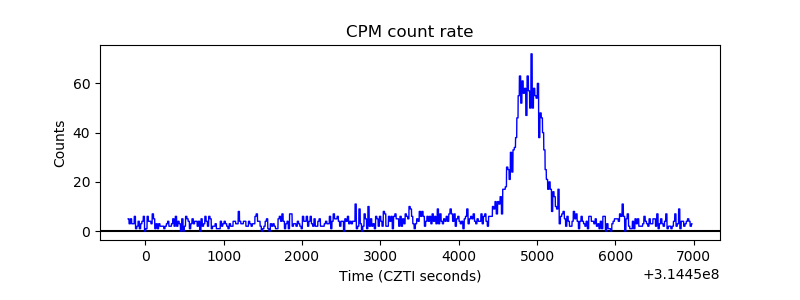 |
| CZT Counter | 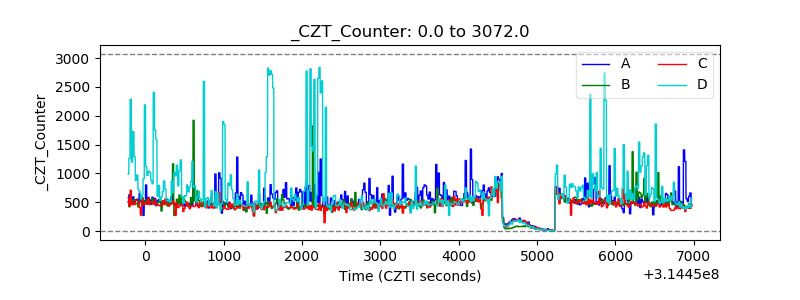 |
| +2.5 Volts monitor |  |
| +5 Volts monitor | 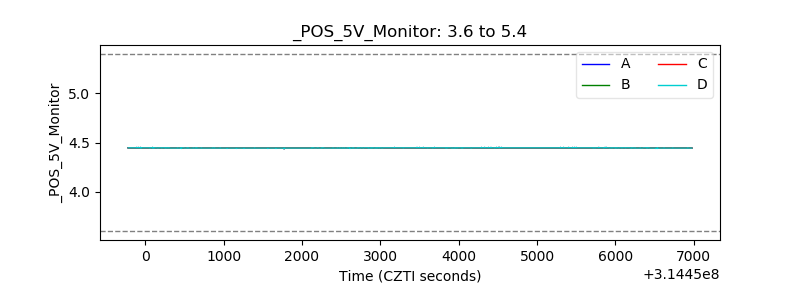 |
| _ROLL_ROT | 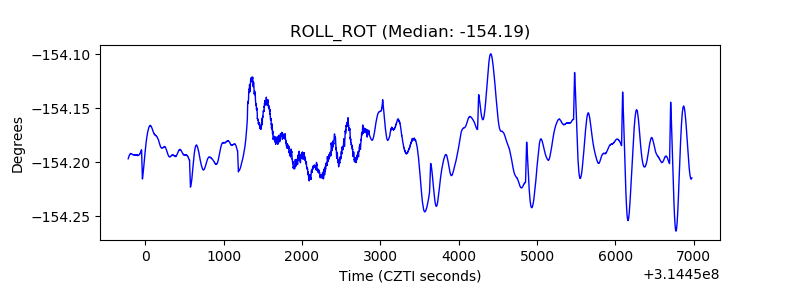 |
| _Roll_DEC | 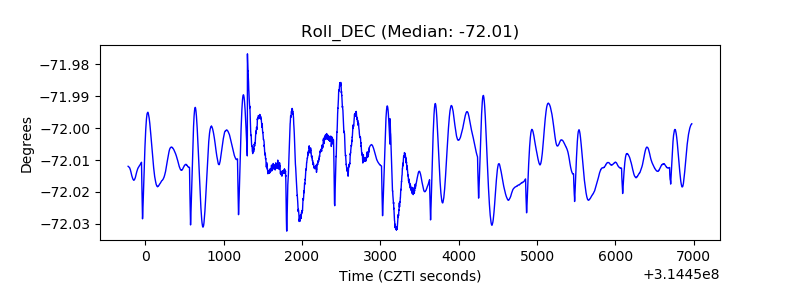 |
| _Roll_RA | 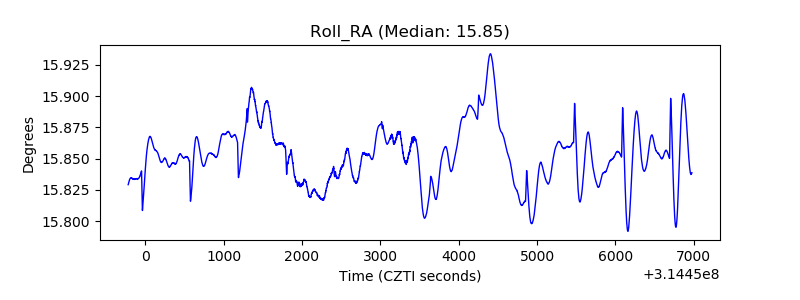 |
| Veto Counter | 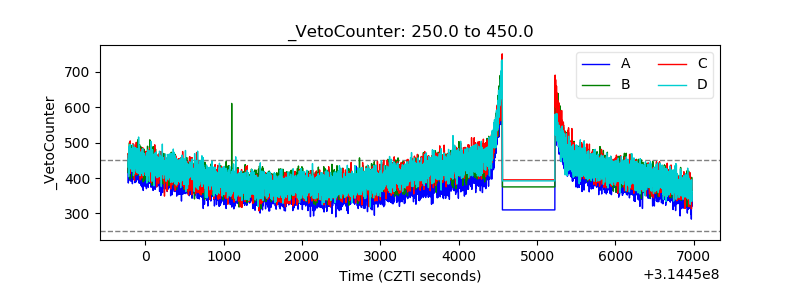 |