| Param | Original file | Final file |
|---|---|---|
| Filename | modeM0/AS1C05_001T01_9000003374_22849cztM0_level2.evt | modeM0/AS1C05_001T01_9000003374_22849cztM0_level2_quad_clean.evt |
| Size (bytes) | 907,758,720 | 220,947,840 |
| Size | 865.7 MB | 210.7 MB |
| Events in quadrant A | 6,077,435 | 1,517,444 |
| Events in quadrant B | 6,040,984 | 1,526,864 |
| Events in quadrant C | 5,514,054 | 1,450,846 |
| Events in quadrant D | 9,046,831 | 1,366,757 |
| Mode SS | |||
|---|---|---|---|
| Quadrant | BADHDUFLAG | Total packets | Discarded packets |
| A | 0 | 246 | 0 |
| B | 0 | 246 | 0 |
| C | 0 | 246 | 0 |
| D | 0 | 246 | 0 |
| Mode M0 | |||
|---|---|---|---|
| Quadrant | BADHDUFLAG | Total packets | Discarded packets |
| A | 0 | 26243 | 0 |
| B | 0 | 25767 | 0 |
| C | 0 | 24463 | 0 |
| D | 0 | 35152 | 0 |
| Mode M9 | |||
|---|---|---|---|
| Quadrant | BADHDUFLAG | Total packets | Discarded packets |
| A | 0 | 10 | 0 |
| B | 0 | 10 | 0 |
| C | 0 | 10 | 0 |
| D | 0 | 10 | 0 |
| Quadrant | Total seconds | Saturated seconds | Saturation percentage |
|---|---|---|---|
| A | 12001 | 48 | 0.399967% |
| B | 12002 | 103 | 0.858190% |
| C | 12002 | 112 | 0.933178% |
| D | 12002 | 944 | 7.865356% |
Noise dominated data is calculated using 1-second bins in cleaned event files. If a bin has >2000 counts, and if more than 50% of those come from <1% of pixels, then it is considered to be noise-dominated and hence unusable.
| Quadrant | # 1 sec bins | Bins with >0 counts | Bins with >2000 counts | High rate bins dominated by noise | Noise dominated (total time) | Noise dominated (detector-on time) | Marked lightcurve |
|---|---|---|---|---|---|---|---|
| A | 13066 | 12003 | 0 | 0 | 0.00% | 0.00% | 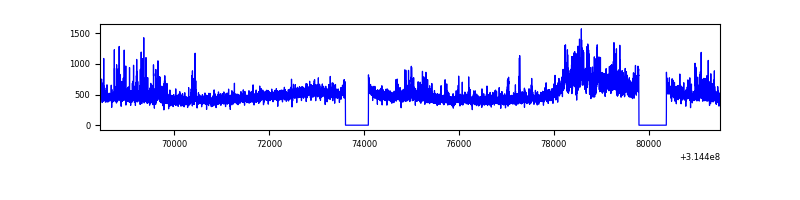 |
| B | 13067 | 12004 | 10 | 10 | 0.08% | 0.08% |  |
| C | 13067 | 12004 | 3 | 3 | 0.02% | 0.02% | 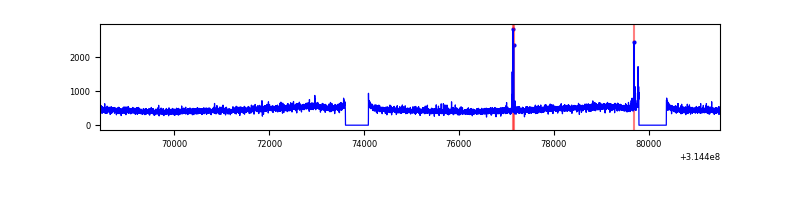 |
| D | 13067 | 12003 | 740 | 740 | 5.66% | 6.17% | 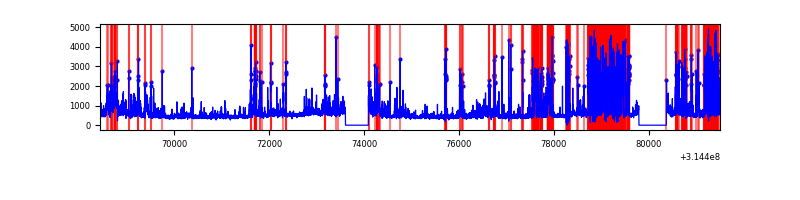 |
Top three noisy pixels from each quadrant. If the there are fewer than three noisy pixels in the level2.evt file, extra rows are filled as -1
| Pixel properties | Quadrant properties | ||||||
|---|---|---|---|---|---|---|---|
| Quadrant | DetID | PixID | Counts | Sigma | Mean | Median | Sigma |
| A | 11 | 47 | 497218 | 1736.94 | 1411 | 1381 | 285.5 |
| A | 13 | 252 | 111996 | 387.49 | 1411 | 1381 | 285.5 |
| A | 3 | 1 | 25460 | 84.35 | 1411 | 1381 | 285.5 |
| B | 0 | 190 | 349919 | 1320.56 | 1408 | 1373 | 263.9 |
| B | 0 | 189 | 54956 | 203.01 | 1408 | 1373 | 263.9 |
| B | 4 | 21 | 46101 | 169.46 | 1408 | 1373 | 263.9 |
| C | 14 | 238 | 213120 | 673.61 | 1343 | 1351 | 314.4 |
| C | 7 | 247 | 42972 | 132.39 | 1343 | 1351 | 314.4 |
| C | 2 | 16 | 12022 | 33.94 | 1343 | 1351 | 314.4 |
| D | 1 | 52 | 2511495 | 7763.41 | 1316 | 1278 | 323.3 |
| D | 1 | 239 | 532536 | 1643.03 | 1316 | 1278 | 323.3 |
| D | 2 | 152 | 369118 | 1137.63 | 1316 | 1278 | 323.3 |
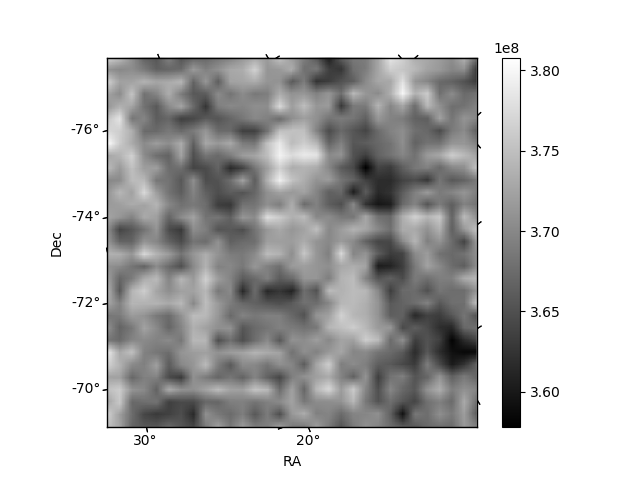
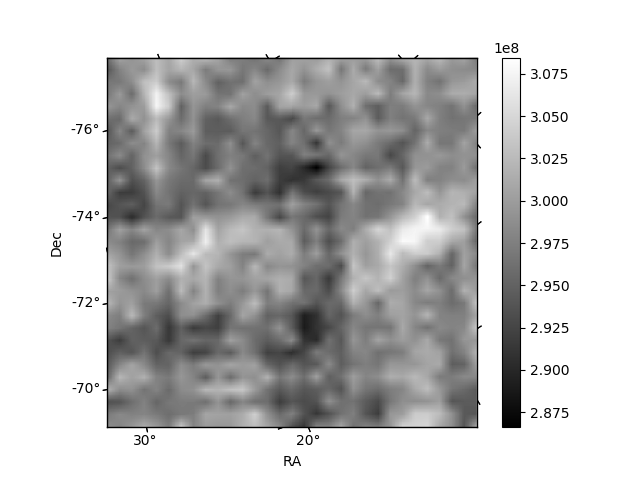
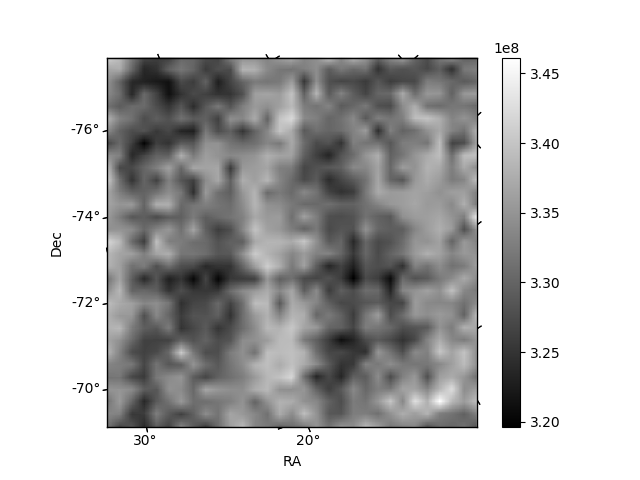
Histogram calculated using DETX and DETY for each event in the final _common_clean file
| Quadrant A | 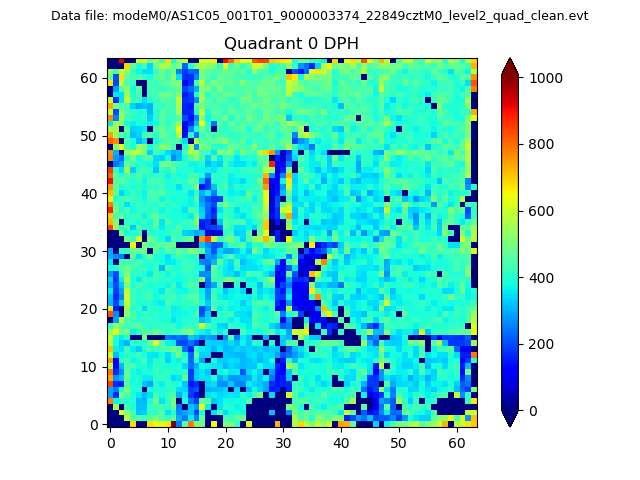 |
 |
Quadrant B |
|---|---|---|---|
| Quadrant D |  |
 |
Quadrant C |
| Plot type | Count rate plots | Images |
|---|---|---|
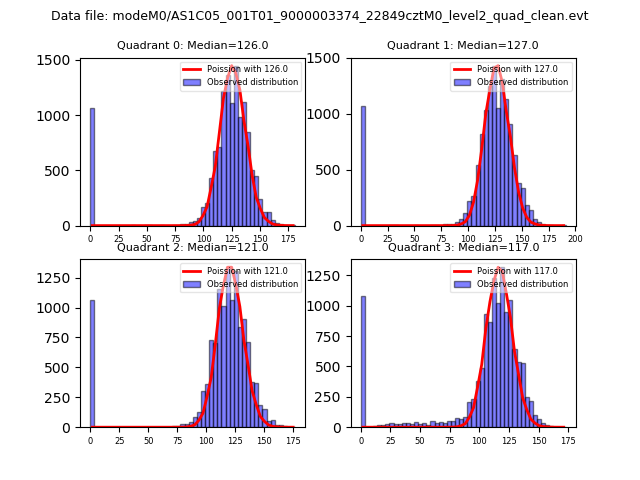
| Comparison with Poisson distribution Blue bars denote a histogram of data divided into 1 sec bins. Red curve is a Poisson curve with rate = median count rate of data. |
 |
 |
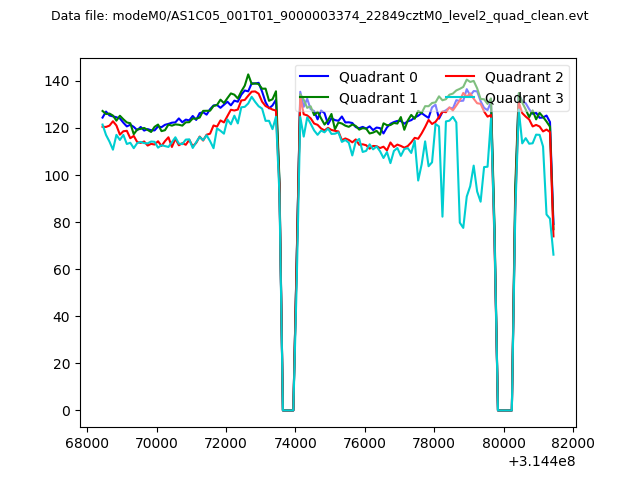
| Quadrant-wise count rates Data is divided into 100 sec bins |
 |
|
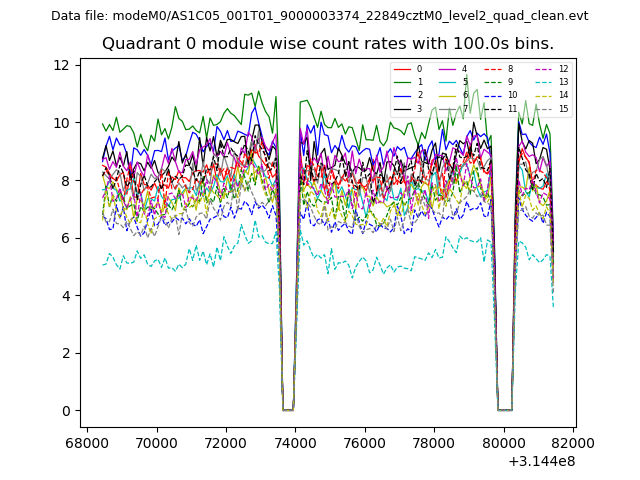
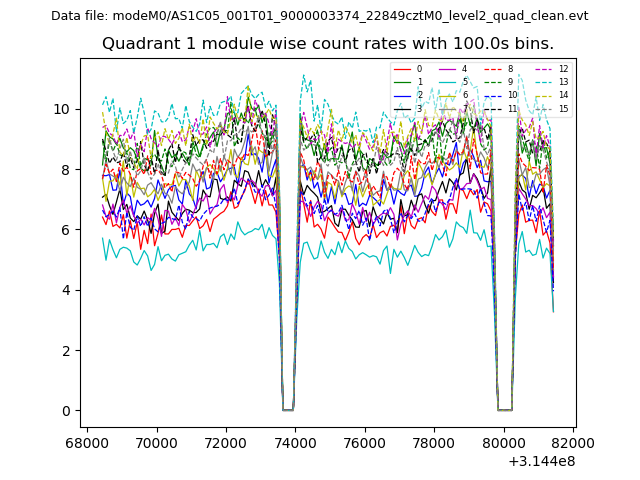
| Module-wise count rates for Quadrant A Data is divided into 100 sec bins |
 |
 |
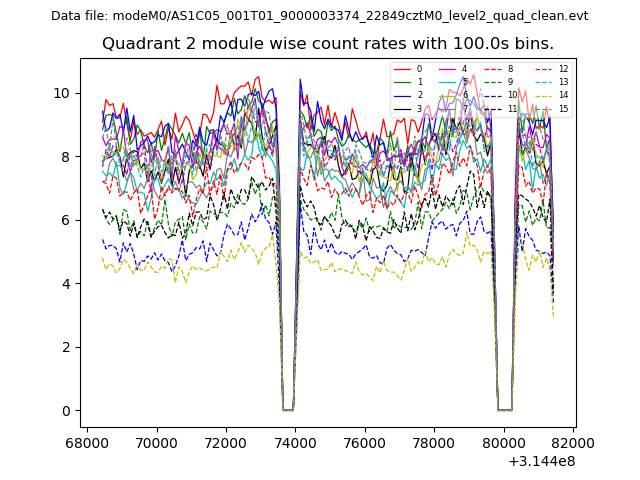
| Module-wise count rates for Quadrant B Data is divided into 100 sec bins |
 |
 |
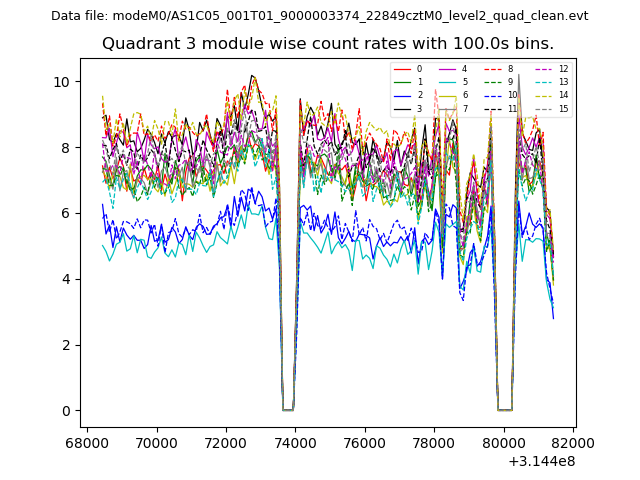
| Module-wise count rates for Quadrant C Data is divided into 100 sec bins |
 |
 |
| Module-wise count rates for Quadrant D Data is divided into 100 sec bins |
 |
 |
| Parameter | Plot |
|---|---|
| CZT HV Monitor | 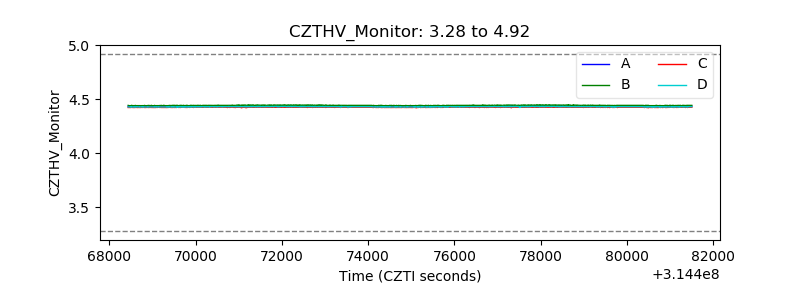 |
| D_VDD | 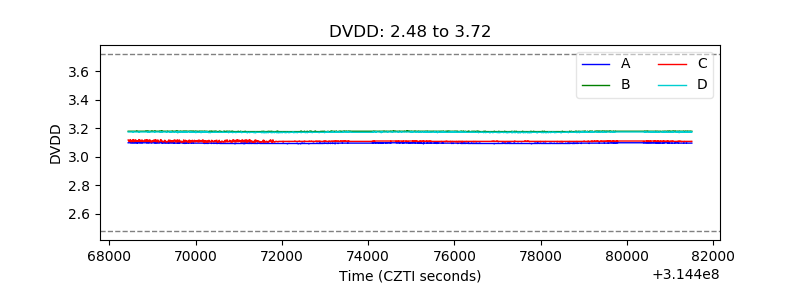 |
| Temperature 1 | 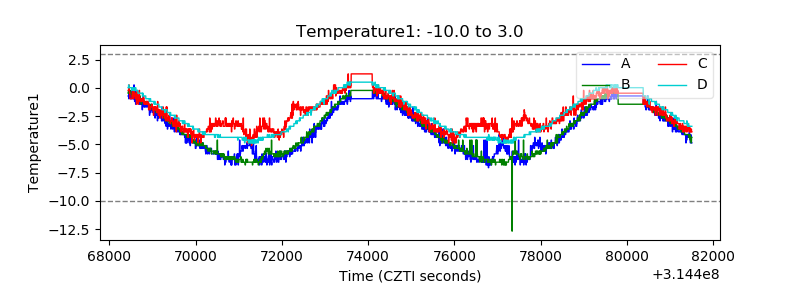 |
| Veto HV Monitor | 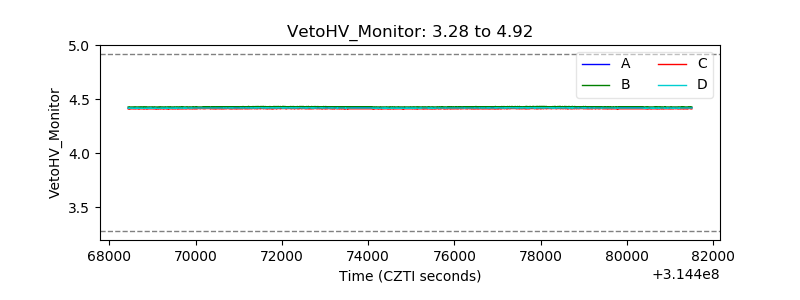 |
| Veto LLD | 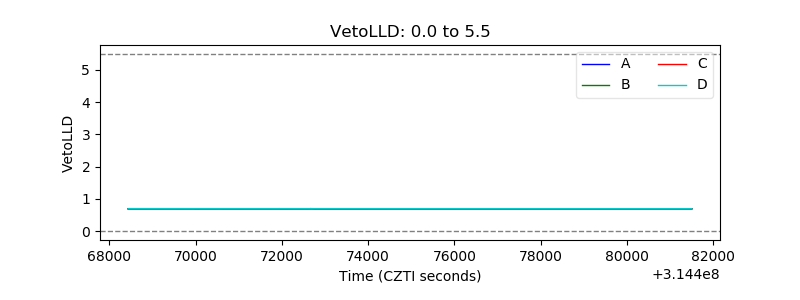 |
| Alpha Counter | 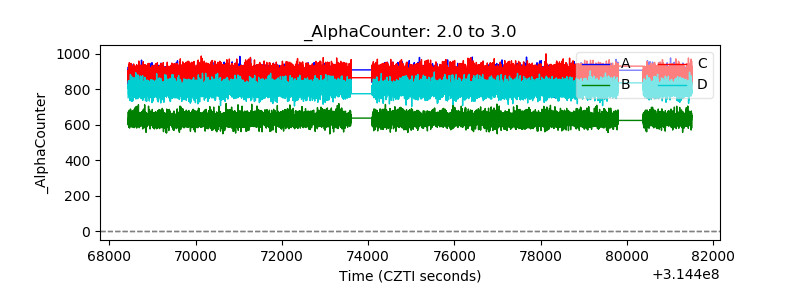 |
| _CPM_Rate | 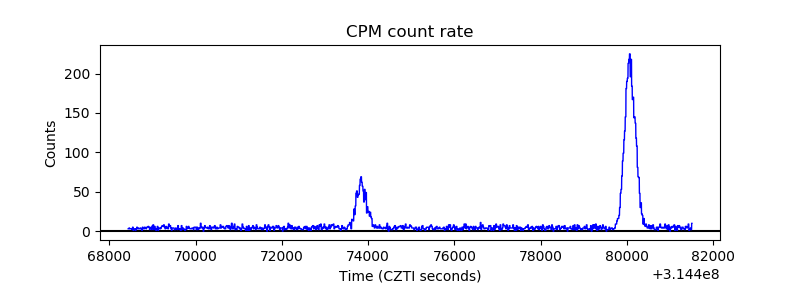 |
| CZT Counter |  |
| +2.5 Volts monitor |  |
| +5 Volts monitor | 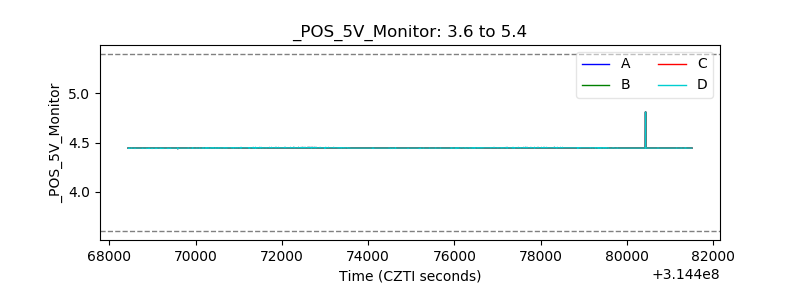 |
| _ROLL_ROT | 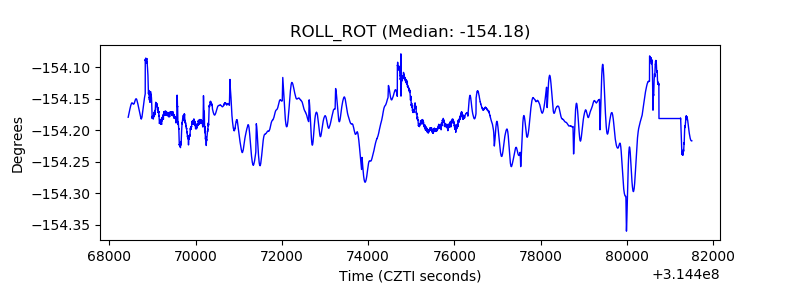 |
| _Roll_DEC | 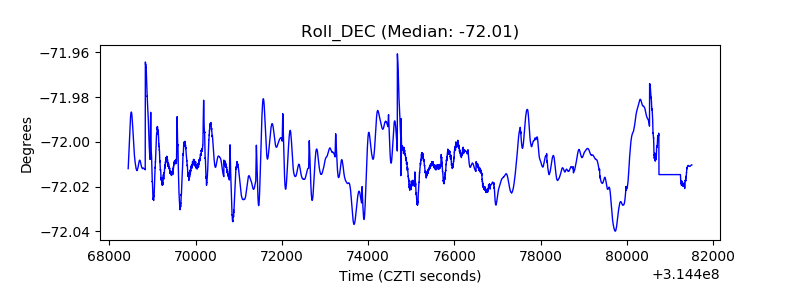 |
| _Roll_RA |  |
| Veto Counter | 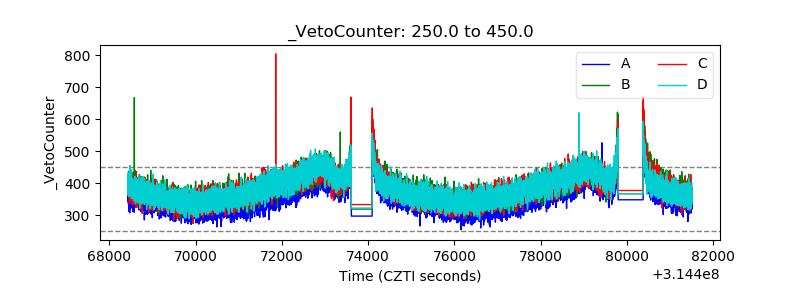 |