| Param | Original file | Final file |
|---|---|---|
| Filename | modeM0/AS1C05_001T01_9000003374_22850cztM0_level2.evt | modeM0/AS1C05_001T01_9000003374_22850cztM0_level2_quad_clean.evt |
| Size (bytes) | 1,334,943,360 | 322,151,040 |
| Size | 1.2 GB | 307.2 MB |
| Events in quadrant A | 8,825,346 | 2,210,923 |
| Events in quadrant B | 8,691,938 | 2,223,846 |
| Events in quadrant C | 8,028,338 | 2,118,853 |
| Events in quadrant D | 13,707,817 | 2,004,584 |
| Mode SS | |||
|---|---|---|---|
| Quadrant | BADHDUFLAG | Total packets | Discarded packets |
| A | 0 | 356 | 0 |
| B | 0 | 356 | 0 |
| C | 0 | 356 | 0 |
| D | 0 | 356 | 0 |
| Mode M0 | |||
|---|---|---|---|
| Quadrant | BADHDUFLAG | Total packets | Discarded packets |
| A | 0 | 37866 | 0 |
| B | 0 | 37174 | 0 |
| C | 0 | 35591 | 0 |
| D | 0 | 52763 | 0 |
| Mode M9 | |||
|---|---|---|---|
| Quadrant | BADHDUFLAG | Total packets | Discarded packets |
| A | 0 | 12 | 0 |
| B | 0 | 12 | 0 |
| C | 0 | 12 | 0 |
| D | 0 | 12 | 0 |
| Quadrant | Total seconds | Saturated seconds | Saturation percentage |
|---|---|---|---|
| A | 17394 | 117 | 0.672646% |
| B | 17395 | 194 | 1.115263% |
| C | 17395 | 187 | 1.075022% |
| D | 17395 | 1366 | 7.852831% |
Noise dominated data is calculated using 1-second bins in cleaned event files. If a bin has >2000 counts, and if more than 50% of those come from <1% of pixels, then it is considered to be noise-dominated and hence unusable.
| Quadrant | # 1 sec bins | Bins with >0 counts | Bins with >2000 counts | High rate bins dominated by noise | Noise dominated (total time) | Noise dominated (detector-on time) | Marked lightcurve |
|---|---|---|---|---|---|---|---|
| A | 18699 | 17397 | 0 | 0 | 0.00% | 0.00% | 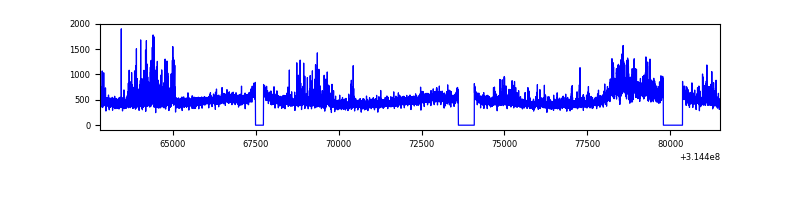 |
| B | 18700 | 17398 | 11 | 11 | 0.06% | 0.06% | 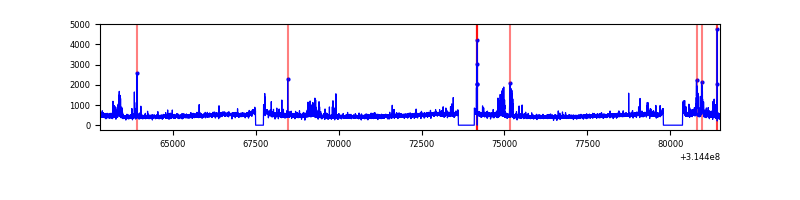 |
| C | 18700 | 17398 | 3 | 3 | 0.02% | 0.02% | 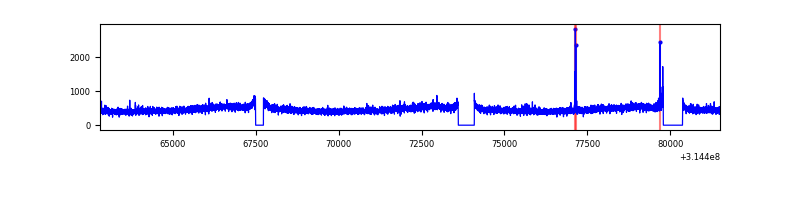 |
| D | 18700 | 17397 | 1019 | 1019 | 5.45% | 5.86% | 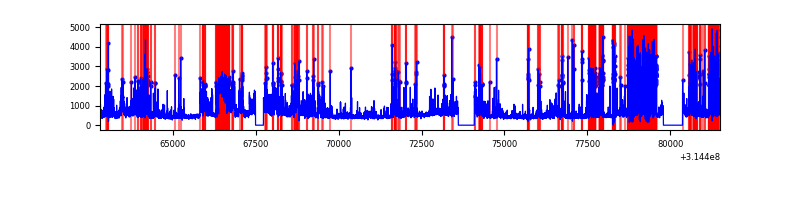 |
Top three noisy pixels from each quadrant. If the there are fewer than three noisy pixels in the level2.evt file, extra rows are filled as -1
| Pixel properties | Quadrant properties | ||||||
|---|---|---|---|---|---|---|---|
| Quadrant | DetID | PixID | Counts | Sigma | Mean | Median | Sigma |
| A | 11 | 47 | 754365 | 1820.14 | 2055 | 2013 | 413.3 |
| A | 13 | 252 | 112923 | 268.32 | 2055 | 2013 | 413.3 |
| A | 13 | 254 | 32821 | 74.53 | 2055 | 2013 | 413.3 |
| B | 0 | 190 | 424000 | 1101.53 | 2052 | 2000 | 383.1 |
| B | 0 | 189 | 59565 | 150.26 | 2052 | 2000 | 383.1 |
| B | 4 | 21 | 57798 | 145.65 | 2052 | 2000 | 383.1 |
| C | 14 | 238 | 310840 | 675.86 | 1962 | 1972 | 457.0 |
| C | 7 | 247 | 44412 | 92.87 | 1962 | 1972 | 457.0 |
| C | 2 | 16 | 17214 | 33.35 | 1962 | 1972 | 457.0 |
| D | 1 | 52 | 3624002 | 7686.12 | 1934 | 1877 | 471.3 |
| D | 1 | 239 | 1443301 | 3058.69 | 1934 | 1877 | 471.3 |
| D | 2 | 152 | 397885 | 840.33 | 1934 | 1877 | 471.3 |
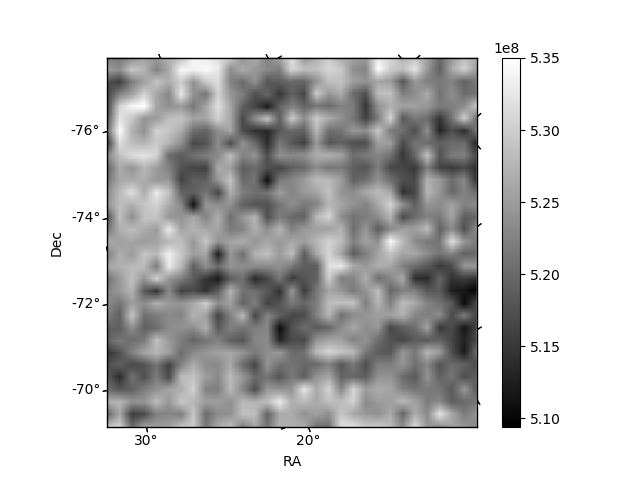
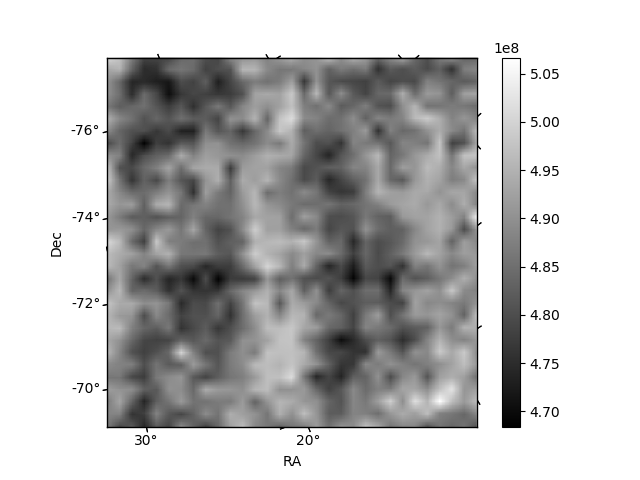
Histogram calculated using DETX and DETY for each event in the final _common_clean file
| Quadrant A | 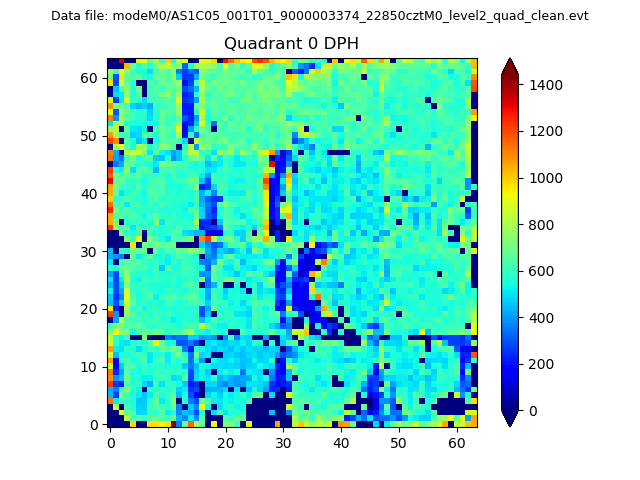 |
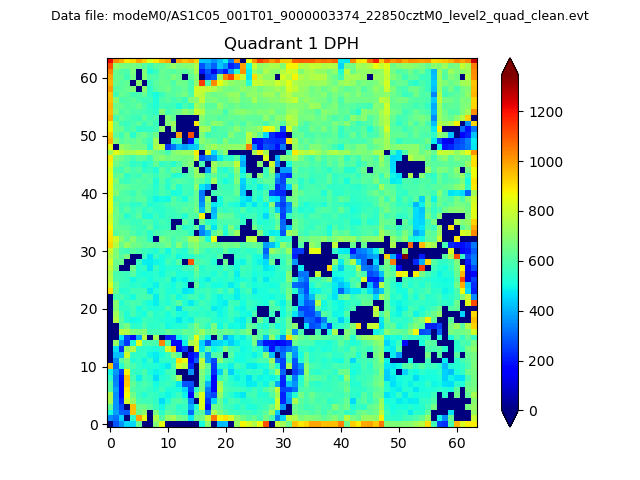 |
Quadrant B |
|---|---|---|---|
| Quadrant D | 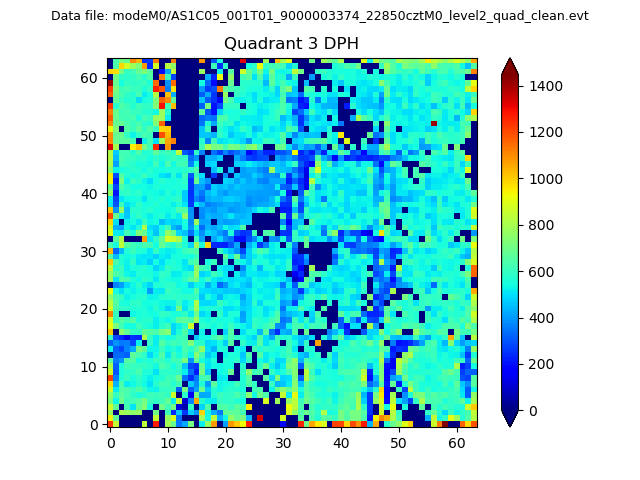 |
 |
Quadrant C |
| Plot type | Count rate plots | Images |
|---|---|---|
| Comparison with Poisson distribution Blue bars denote a histogram of data divided into 1 sec bins. Red curve is a Poisson curve with rate = median count rate of data. |
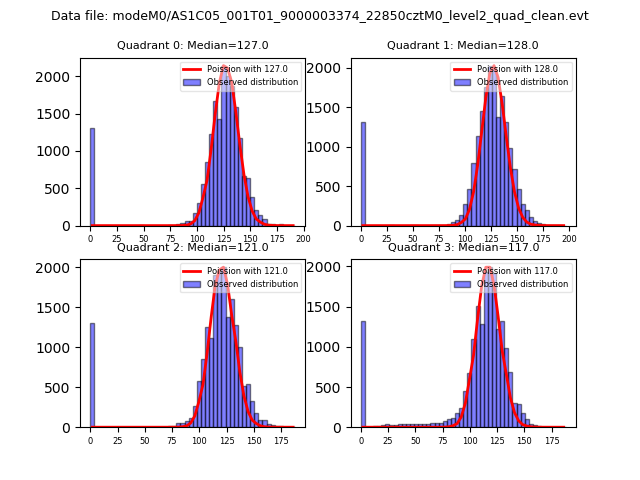 |
 |
| Quadrant-wise count rates Data is divided into 100 sec bins |
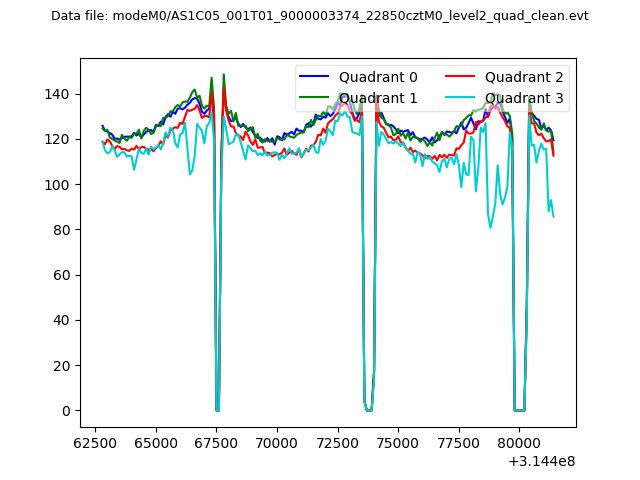 |
|
| Module-wise count rates for Quadrant A Data is divided into 100 sec bins |
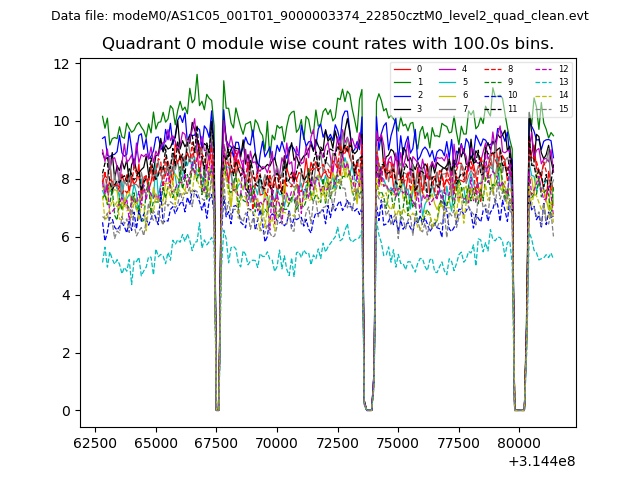 |
 |
| Module-wise count rates for Quadrant B Data is divided into 100 sec bins |
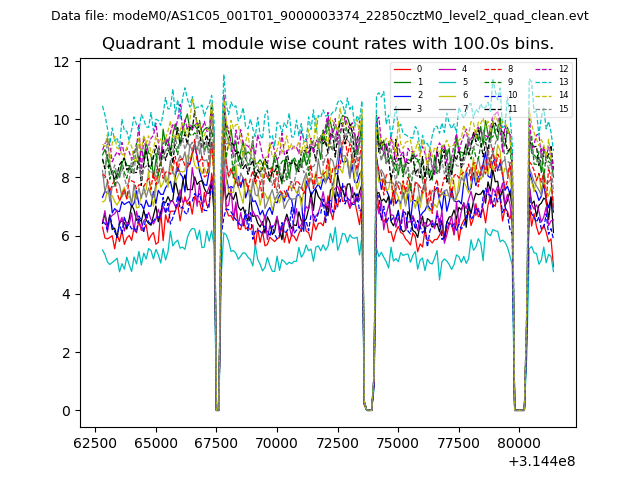 |
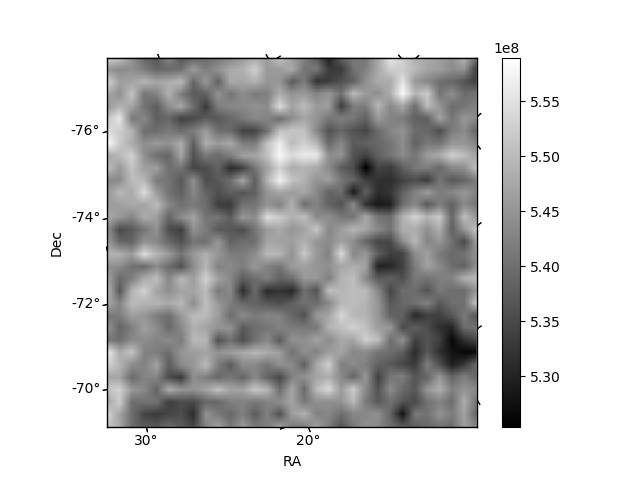 |
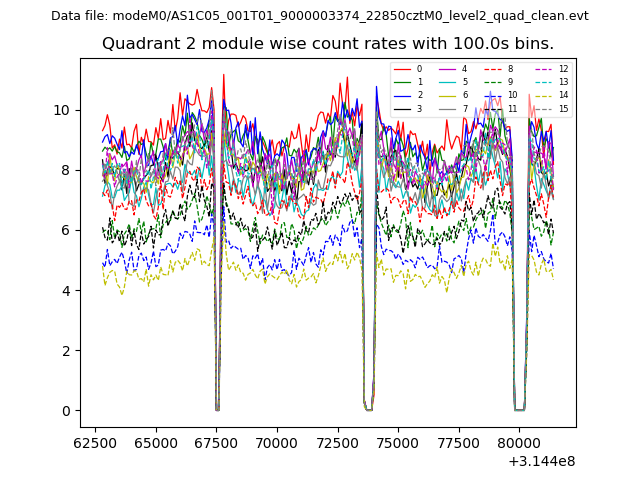
| Module-wise count rates for Quadrant C Data is divided into 100 sec bins |
 |
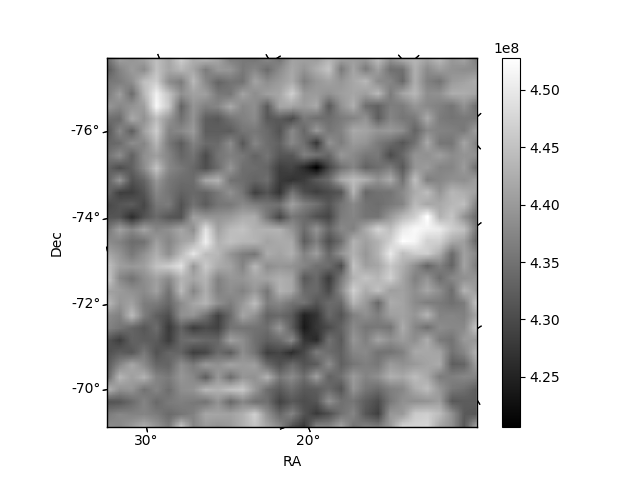 |
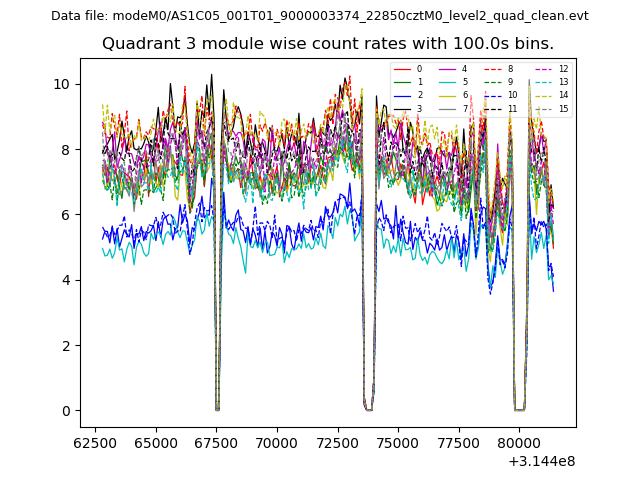
| Module-wise count rates for Quadrant D Data is divided into 100 sec bins |
 |
 |
| Parameter | Plot |
|---|---|
| CZT HV Monitor | 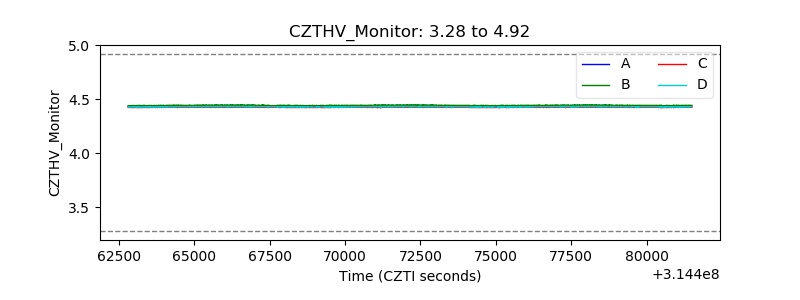 |
| D_VDD | 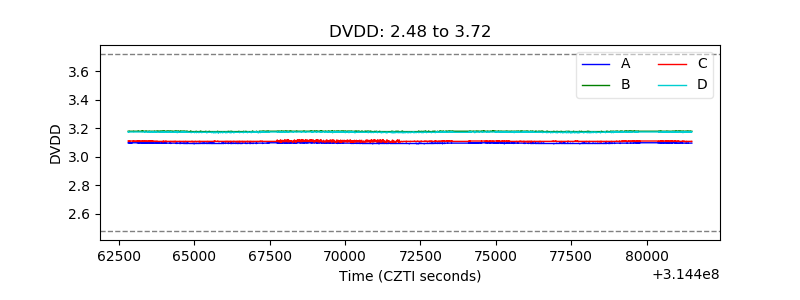 |
| Temperature 1 | 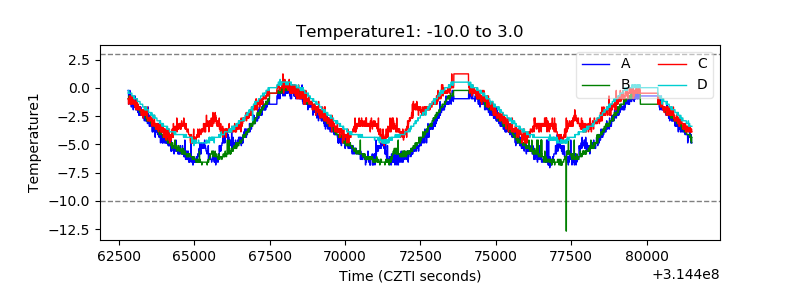 |
| Veto HV Monitor | 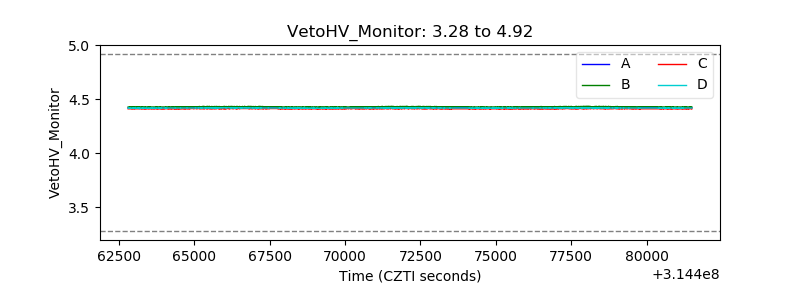 |
| Veto LLD | 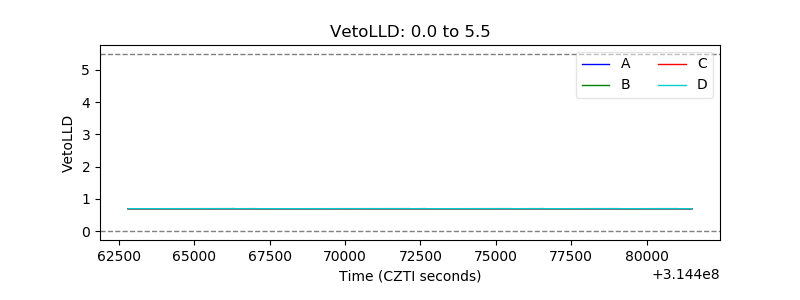 |
| Alpha Counter | 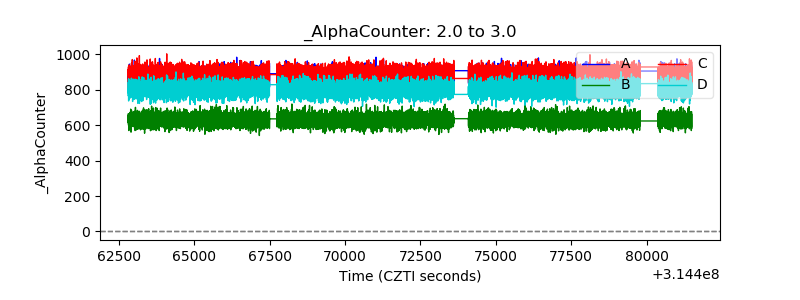 |
| _CPM_Rate | 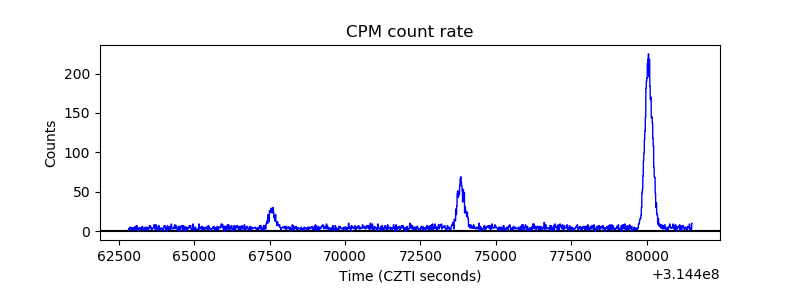 |
| CZT Counter |  |
| +2.5 Volts monitor |  |
| +5 Volts monitor |  |
| _ROLL_ROT | 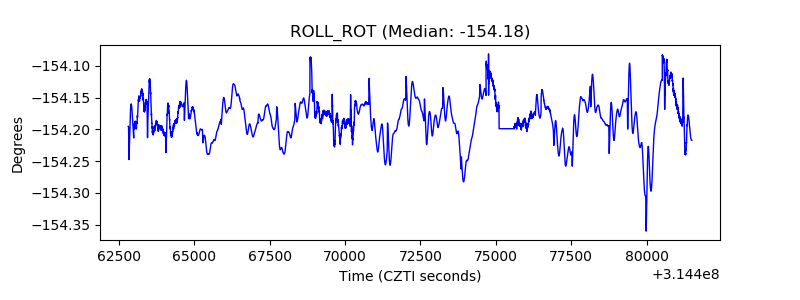 |
| _Roll_DEC | 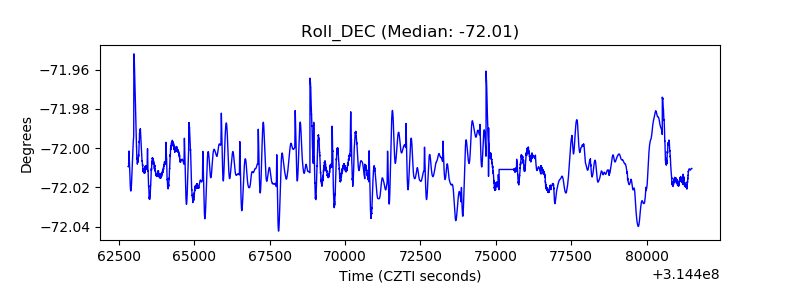 |
| _Roll_RA |  |
| Veto Counter | 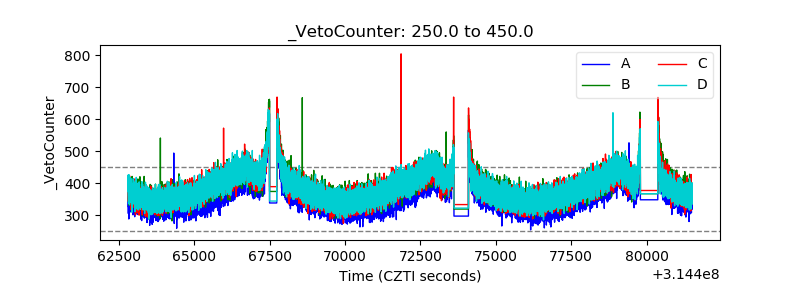 |