| Param | Original file | Final file |
|---|---|---|
| Filename | modeM0/AS1A07_054T01_9000003378cztM0_level2.fits | modeM0/AS1A07_054T01_9000003378cztM0_level2_quad_clean.evt |
| Size (bytes) | 939,098,880 | 1,144,635,840 |
| Size | 895.6 MB | 1.1 GB |
| Events in quadrant A | 5,896,012 | 7,519,314 |
| Events in quadrant B | 5,579,368 | 7,432,736 |
| Events in quadrant C | 5,614,770 | 6,972,204 |
| Events in quadrant D | 4,777,672 | 6,171,824 |
| Mode M9 | |||
|---|---|---|---|
| Quadrant | BADHDUFLAG | Total packets | Discarded packets |
| A | 0 | 168 | 0 |
| B | 0 | 169 | 0 |
| C | 0 | 169 | 0 |
| D | 0 | 169 | 0 |
| Mode SS | |||
|---|---|---|---|
| Quadrant | BADHDUFLAG | Total packets | Discarded packets |
| A | 0 | 1954 | 0 |
| B | 0 | 1954 | 0 |
| C | 0 | 1954 | 0 |
| D | 0 | 1954 | 0 |
| Mode M0 | |||
|---|---|---|---|
| Quadrant | BADHDUFLAG | Total packets | Discarded packets |
| A | 0 | 198870 | 0 |
| B | 0 | 199492 | 0 |
| C | 0 | 196739 | 0 |
| D | 0 | 279038 | 0 |
| Quadrant | Total seconds | Saturated seconds | Saturation percentage |
|---|---|---|---|
| A | 95868 | 589 | 0.614386% |
| B | 95867 | 764 | 0.796937% |
| C | 95867 | 1074 | 1.120302% |
| D | 95867 | 6139 | 6.403663% |
Noise dominated data is calculated using 1-second bins in cleaned event files. If a bin has >2000 counts, and if more than 50% of those come from <1% of pixels, then it is considered to be noise-dominated and hence unusable.
| Quadrant | # 1 sec bins | Bins with >0 counts | Bins with >2000 counts | High rate bins dominated by noise | Noise dominated (total time) | Noise dominated (detector-on time) | Marked lightcurve |
|---|---|---|---|---|---|---|---|
| A | 117189 | 95868 | 0 | 0 | 0.00% | 0.00% |  |
| B | 117189 | 95866 | 0 | 0 | 0.00% | 0.00% | 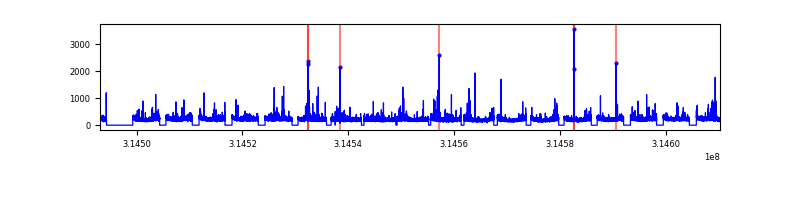 |
| C | 117189 | 95867 | 0 | 0 | 0.00% | 0.00% |  |
| D | 117189 | 95815 | 0 | 0 | 0.00% | 0.00% |  |
Top three noisy pixels from each quadrant. If the there are fewer than three noisy pixels in the level2.evt file, extra rows are filled as -1
| Pixel properties | Quadrant properties | ||||||
|---|---|---|---|---|---|---|---|
| Quadrant | DetID | PixID | Counts | Sigma | Mean | Median | Sigma |
| A | 0 | 29 | 5571 | 10.91 | 1536 | 1451 | 377.6 |
| A | 7 | 110 | 4666 | 8.51 | 1536 | 1451 | 377.6 |
| A | 0 | 30 | 4399 | 7.81 | 1536 | 1451 | 377.6 |
| B | 2 | 9 | 4366 | 10.34 | 1478 | 1421 | 284.9 |
| B | 5 | 128 | 3781 | 8.28 | 1478 | 1421 | 284.9 |
| B | 5 | 255 | 3687 | 7.95 | 1478 | 1421 | 284.9 |
| C | 3 | 234 | 3985 | 6.87 | 1482 | 1391 | 377.8 |
| C | 12 | 241 | 3979 | 6.85 | 1482 | 1391 | 377.8 |
| C | 3 | 235 | 3836 | 6.47 | 1482 | 1391 | 377.8 |
| D | 3 | 14 | 3461 | 5.97 | 1370 | 1252 | 370.1 |
| D | 6 | 67 | 3402 | 5.81 | 1370 | 1252 | 370.1 |
| D | 7 | 3 | 3370 | 5.72 | 1370 | 1252 | 370.1 |
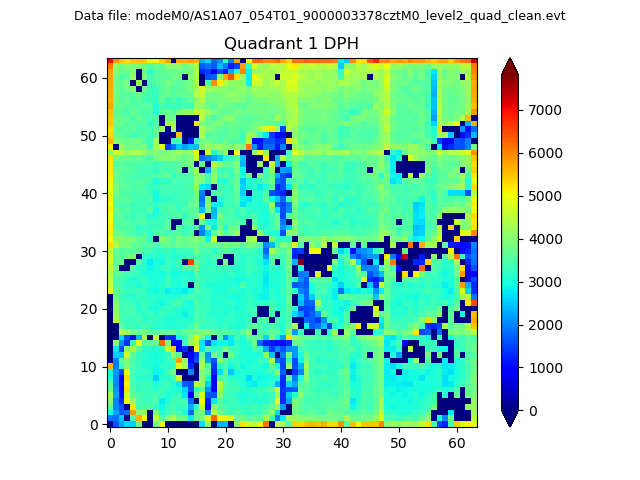
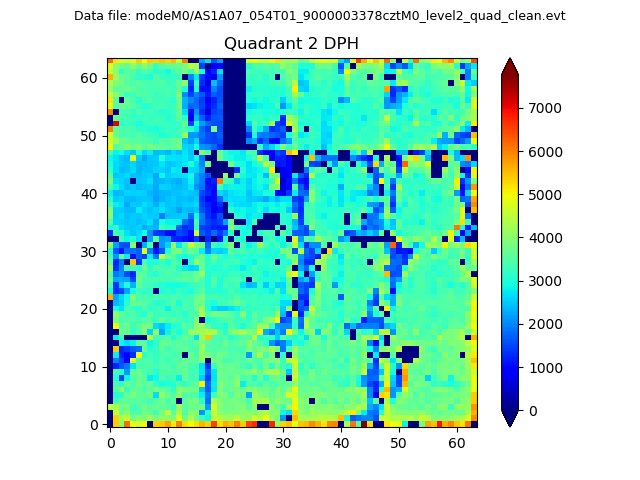
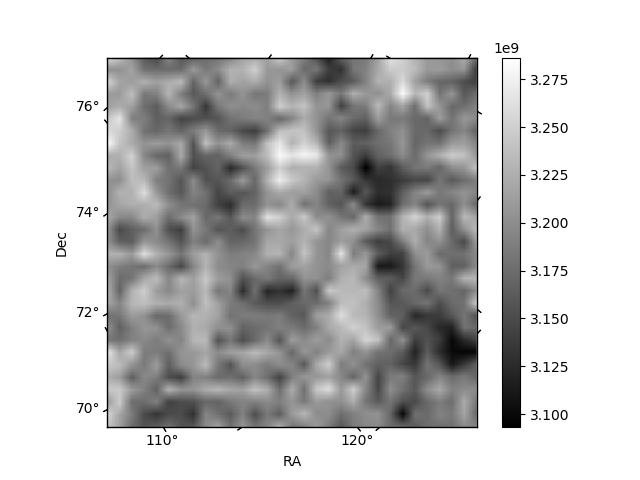
Histogram calculated using DETX and DETY for each event in the final _common_clean file
| Quadrant A |  |
 |
Quadrant B |
|---|---|---|---|
| Quadrant D |  |
 |
Quadrant C |
| Plot type | Count rate plots | Images |
|---|---|---|
| Comparison with Poisson distribution Blue bars denote a histogram of data divided into 1 sec bins. Red curve is a Poisson curve with rate = median count rate of data. |
 |
 |
| Quadrant-wise count rates Data is divided into 100 sec bins |
 |
|
| Module-wise count rates for Quadrant A Data is divided into 100 sec bins |
 |
 |
| Module-wise count rates for Quadrant B Data is divided into 100 sec bins |
 |
 |
| Module-wise count rates for Quadrant C Data is divided into 100 sec bins |
 |
 |
| Module-wise count rates for Quadrant D Data is divided into 100 sec bins |
 |
 |
| Parameter | Plot |
|---|---|
| CZT HV Monitor |  |
| D_VDD | 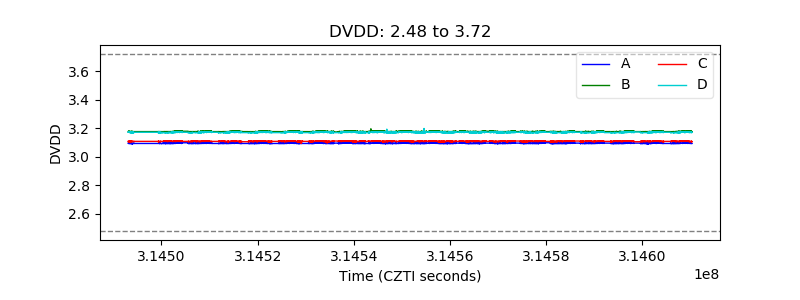 |
| Temperature 1 |  |
| Veto HV Monitor |  |
| Veto LLD |  |
| Alpha Counter |  |
| _CPM_Rate | 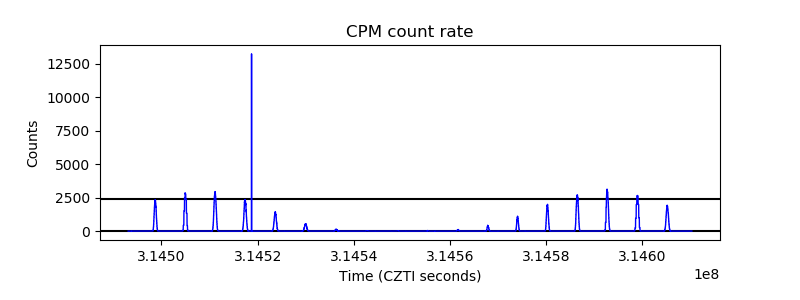 |
| CZT Counter |  |
| +2.5 Volts monitor |  |
| +5 Volts monitor |  |
| _ROLL_ROT |  |
| _Roll_DEC |  |
| _Roll_RA |  |
| Veto Counter |  |