| Param | Original file | Final file |
|---|---|---|
| Filename | modeM0/AS1A07_054T01_9000003378_22850cztM0_level2.evt | modeM0/AS1A07_054T01_9000003378_22850cztM0_level2_quad_clean.evt |
| Size (bytes) | 85,507,200 | 24,932,160 |
| Size | 81.5 MB | 23.8 MB |
| Events in quadrant A | 580,103 | 169,522 |
| Events in quadrant B | 603,730 | 170,748 |
| Events in quadrant C | 605,537 | 162,237 |
| Events in quadrant D | 713,372 | 159,314 |
| Mode SS | |||
|---|---|---|---|
| Quadrant | BADHDUFLAG | Total packets | Discarded packets |
| A | 0 | 26 | 0 |
| B | 0 | 26 | 0 |
| C | 0 | 26 | 0 |
| D | 0 | 26 | 0 |
| Mode M0 | |||
|---|---|---|---|
| Quadrant | BADHDUFLAG | Total packets | Discarded packets |
| A | 0 | 2485 | 0 |
| B | 0 | 2507 | 0 |
| C | 0 | 2518 | 0 |
| D | 0 | 2897 | 0 |
| Quadrant | Total seconds | Saturated seconds | Saturation percentage |
|---|---|---|---|
| A | 1227 | 0 | 0.000000% |
| B | 1226 | 3 | 0.244698% |
| C | 1226 | 7 | 0.570962% |
| D | 1226 | 22 | 1.794454% |
Noise dominated data is calculated using 1-second bins in cleaned event files. If a bin has >2000 counts, and if more than 50% of those come from <1% of pixels, then it is considered to be noise-dominated and hence unusable.
| Quadrant | # 1 sec bins | Bins with >0 counts | Bins with >2000 counts | High rate bins dominated by noise | Noise dominated (total time) | Noise dominated (detector-on time) | Marked lightcurve |
|---|---|---|---|---|---|---|---|
| A | 1227 | 1227 | 0 | 0 | 0.00% | 0.00% | 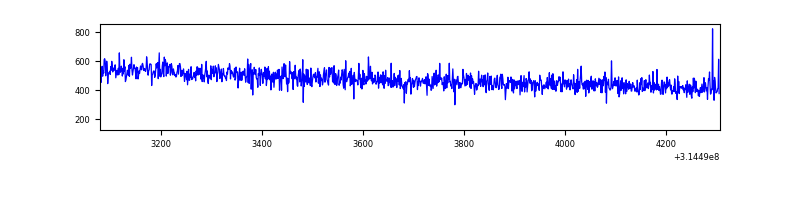 |
| B | 1226 | 1226 | 0 | 0 | 0.00% | 0.00% | 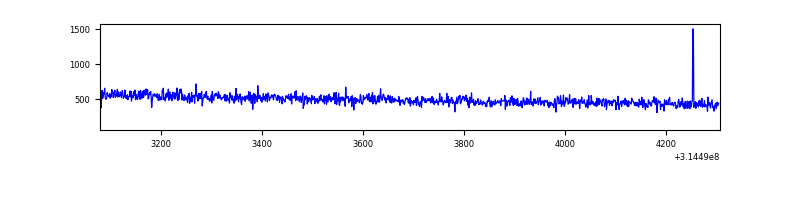 |
| C | 1226 | 1226 | 0 | 0 | 0.00% | 0.00% | 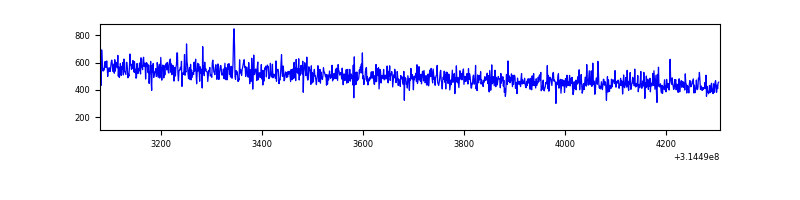 |
| D | 1226 | 1226 | 15 | 15 | 1.22% | 1.22% | 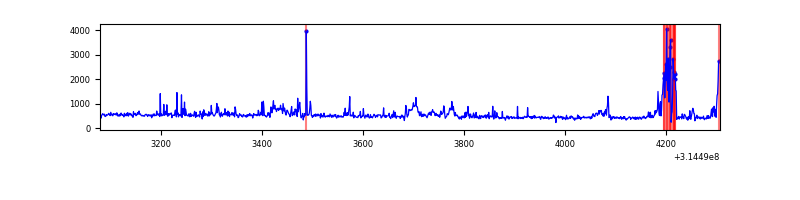 |
Top three noisy pixels from each quadrant. If the there are fewer than three noisy pixels in the level2.evt file, extra rows are filled as -1
| Pixel properties | Quadrant properties | ||||||
|---|---|---|---|---|---|---|---|
| Quadrant | DetID | PixID | Counts | Sigma | Mean | Median | Sigma |
| A | 13 | 254 | 2347 | 68.14 | 150 | 146 | 32.3 |
| A | 0 | 226 | 1311 | 36.07 | 150 | 146 | 32.3 |
| A | 3 | 137 | 1168 | 31.64 | 150 | 146 | 32.3 |
| B | 12 | 111 | 3546 | 109.13 | 152 | 148 | 31.1 |
| B | 11 | 111 | 2937 | 89.57 | 152 | 148 | 31.1 |
| B | 14 | 111 | 2535 | 76.66 | 152 | 148 | 31.1 |
| C | 14 | 238 | 23418 | 640.64 | 148 | 149 | 36.3 |
| C | 10 | 22 | 2149 | 55.06 | 148 | 149 | 36.3 |
| C | 13 | 61 | 982 | 22.93 | 148 | 149 | 36.3 |
| D | 1 | 52 | 60852 | 1626.25 | 147 | 142 | 37.3 |
| D | 13 | 153 | 49571 | 1324.07 | 147 | 142 | 37.3 |
| D | 9 | 85 | 24931 | 664.03 | 147 | 142 | 37.3 |
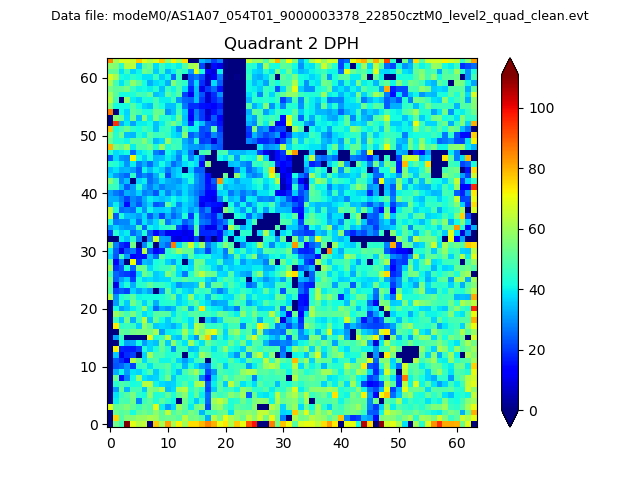
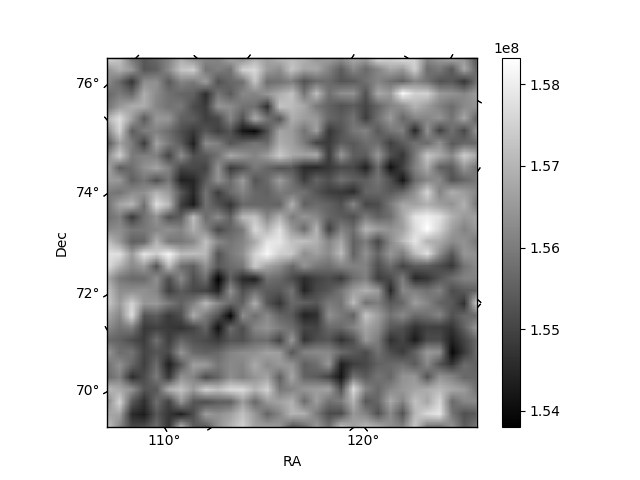
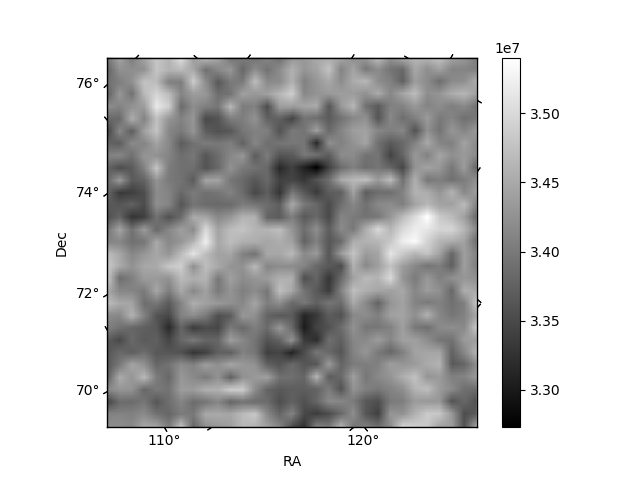
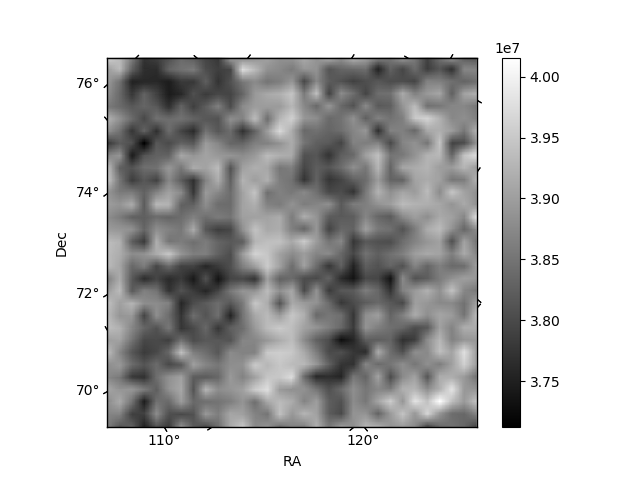
Histogram calculated using DETX and DETY for each event in the final _common_clean file
| Quadrant A | 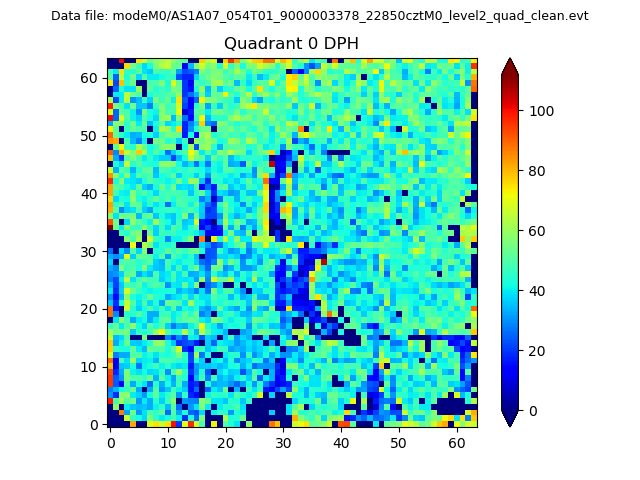 |
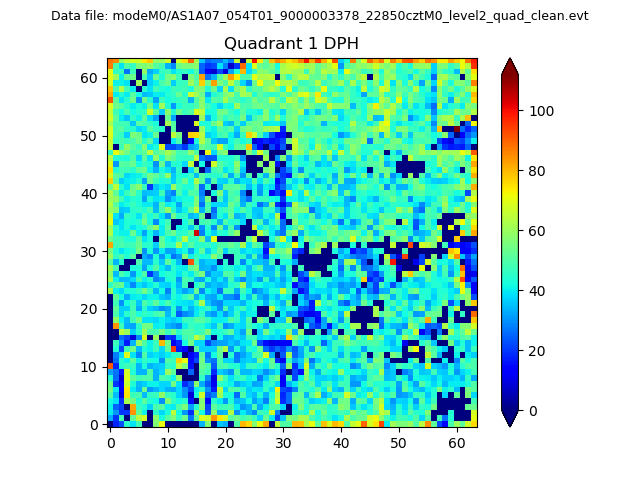 |
Quadrant B |
|---|---|---|---|
| Quadrant D | 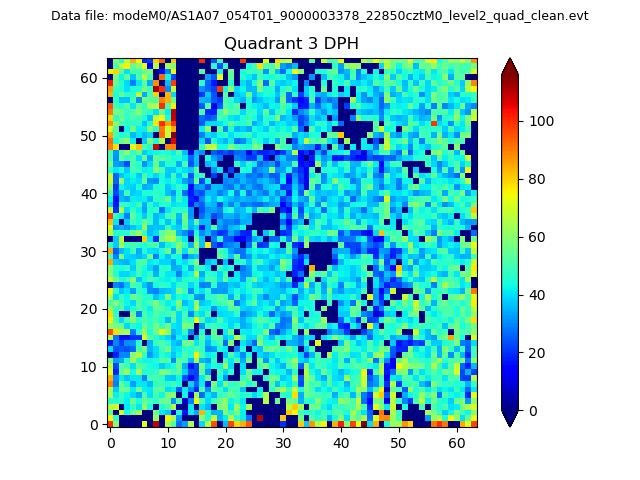 |
 |
Quadrant C |
| Plot type | Count rate plots | Images |
|---|---|---|
| Comparison with Poisson distribution Blue bars denote a histogram of data divided into 1 sec bins. Red curve is a Poisson curve with rate = median count rate of data. |
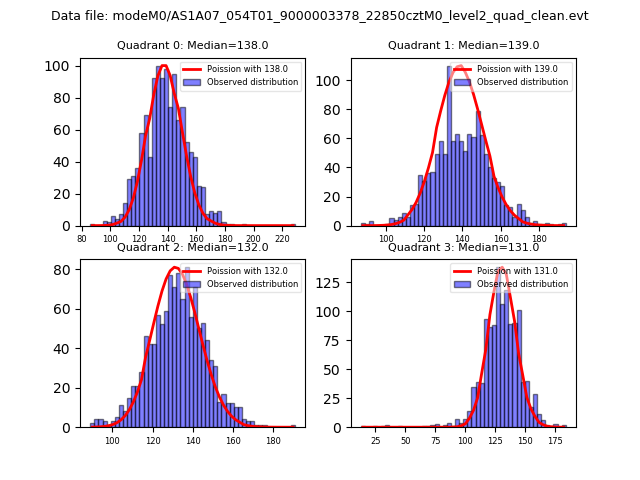 |
 |
| Quadrant-wise count rates Data is divided into 100 sec bins |
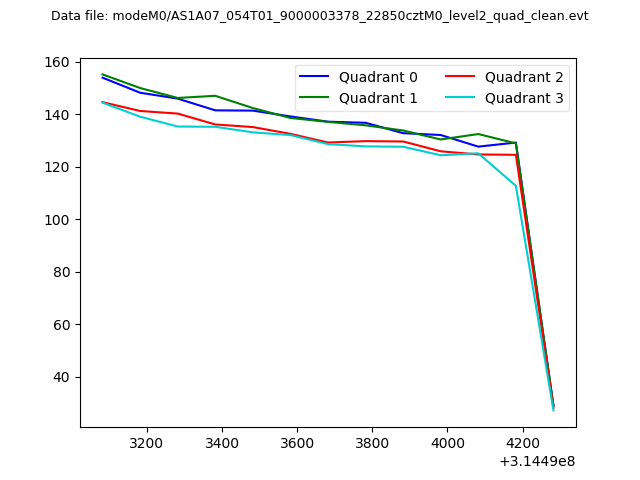 |
|
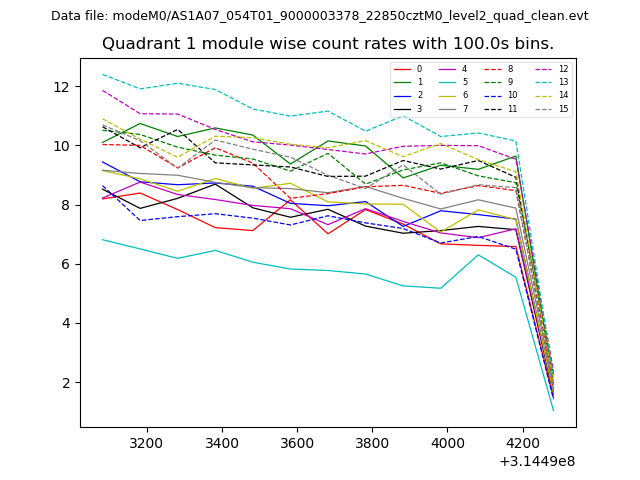
| Module-wise count rates for Quadrant A Data is divided into 100 sec bins |
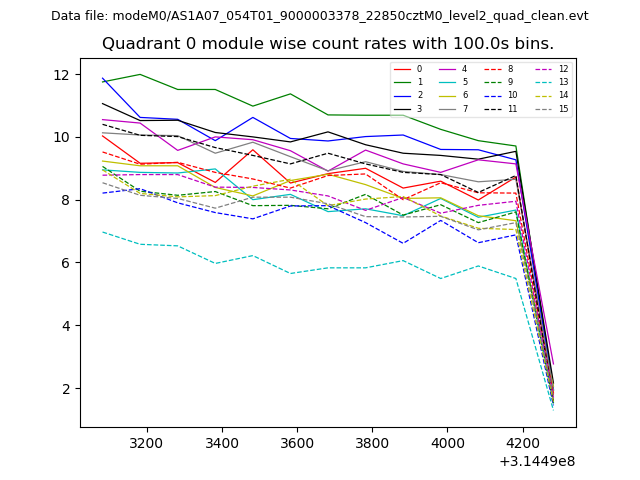 |
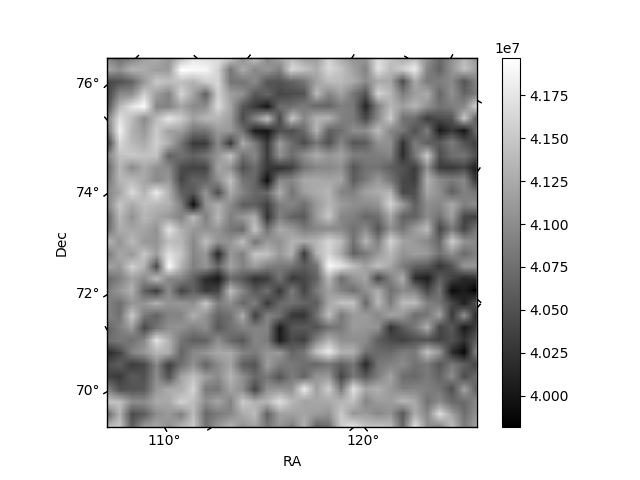 |
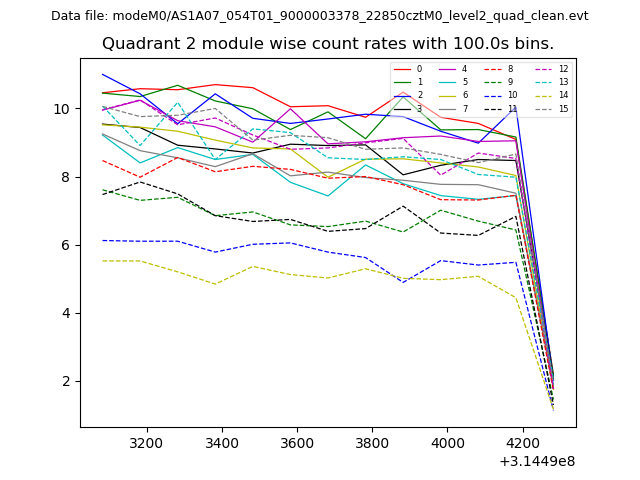
| Module-wise count rates for Quadrant B Data is divided into 100 sec bins |
 |
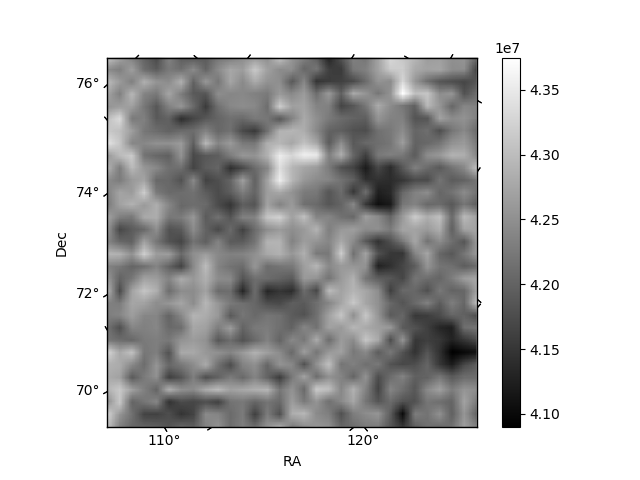 |
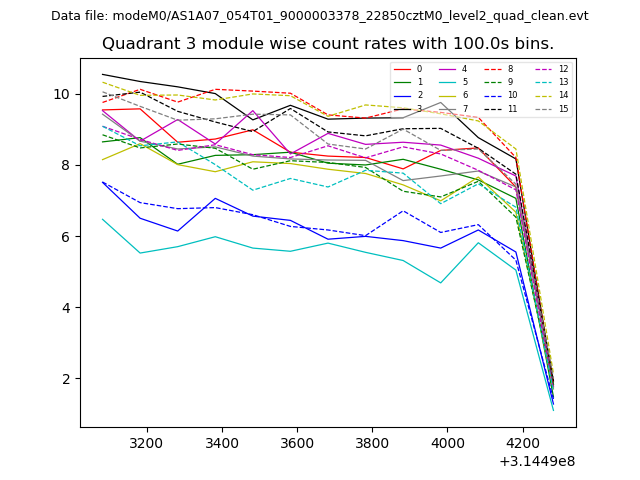
| Module-wise count rates for Quadrant C Data is divided into 100 sec bins |
 |
 |
| Module-wise count rates for Quadrant D Data is divided into 100 sec bins |
 |
 |
| Parameter | Plot |
|---|---|
| CZT HV Monitor | 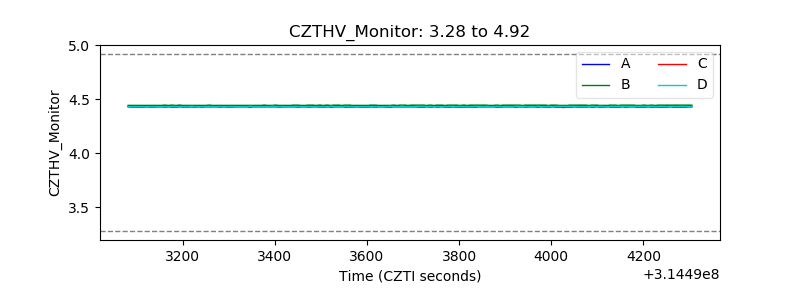 |
| D_VDD | 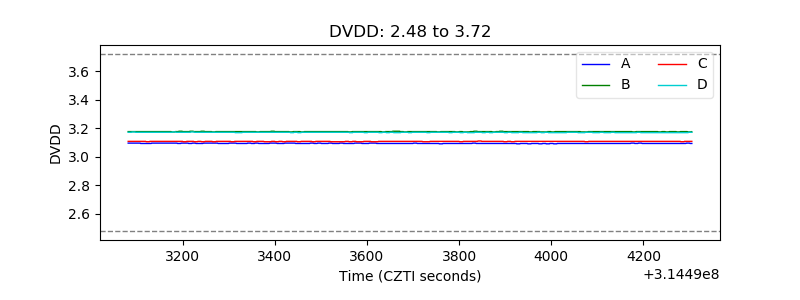 |
| Temperature 1 | 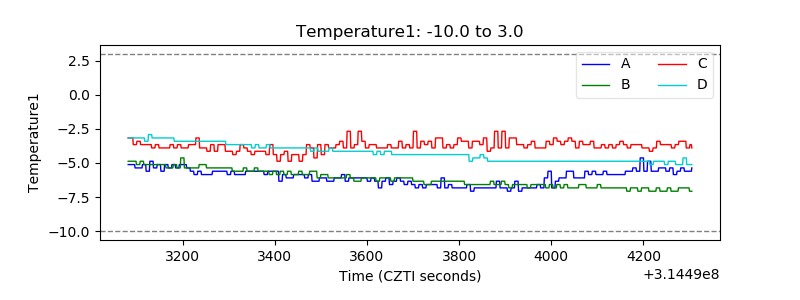 |
| Veto HV Monitor | 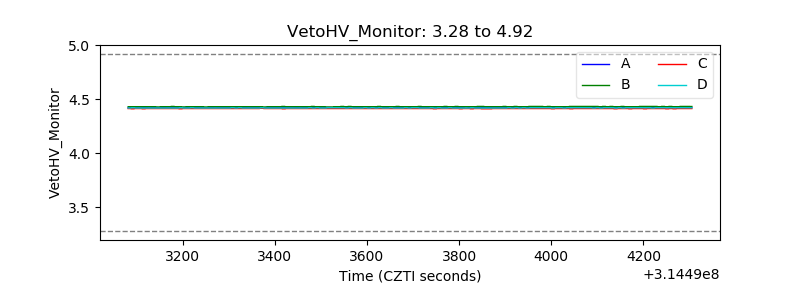 |
| Veto LLD | 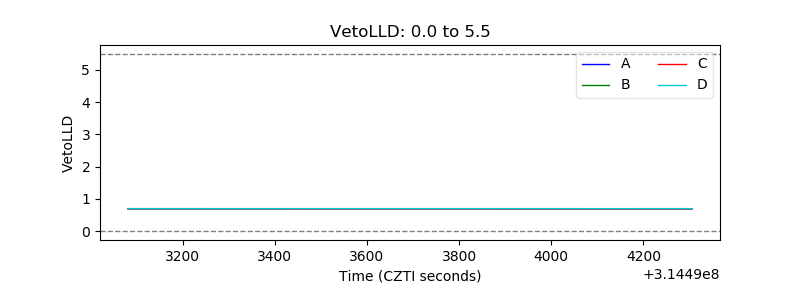 |
| Alpha Counter | 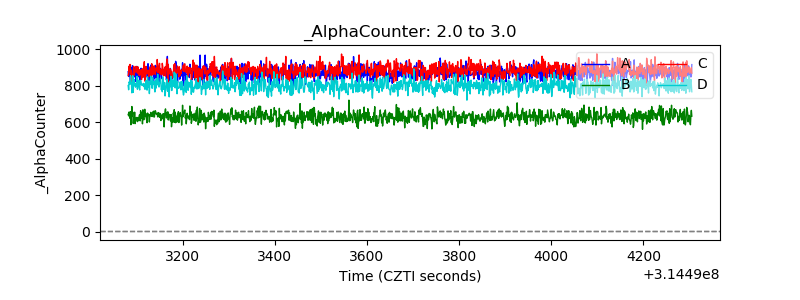 |
| _CPM_Rate | 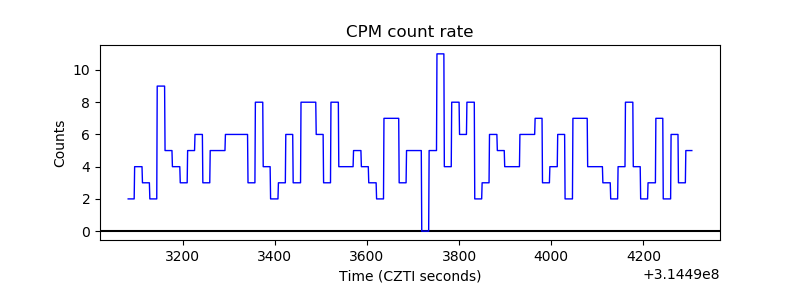 |
| CZT Counter | 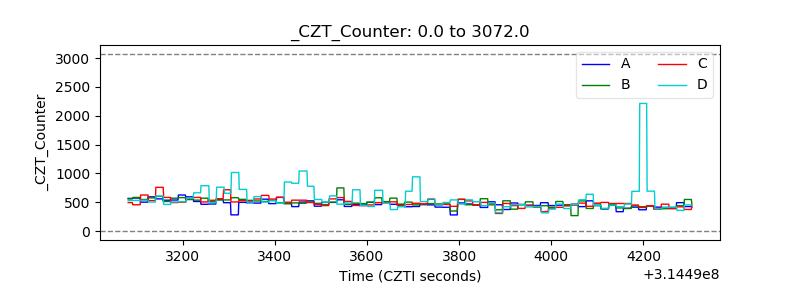 |
| +2.5 Volts monitor | 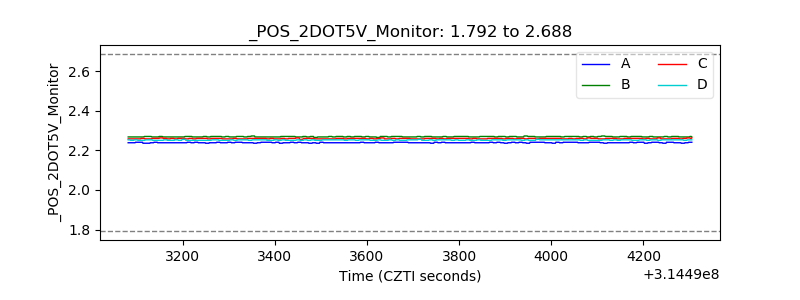 |
| +5 Volts monitor | 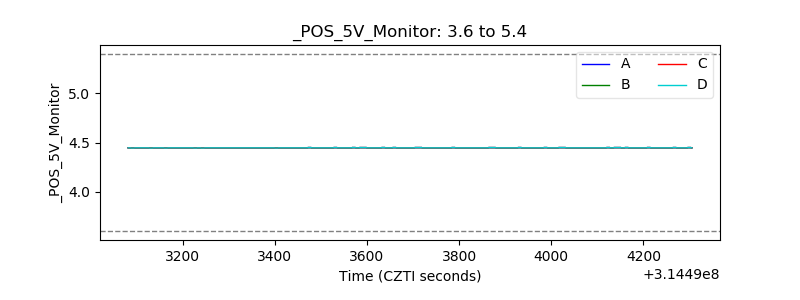 |
| _ROLL_ROT | 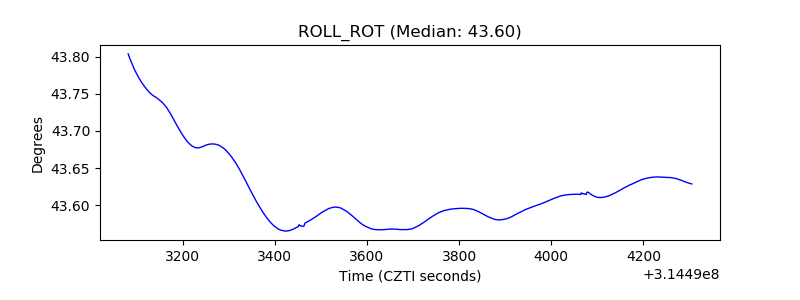 |
| _Roll_DEC | 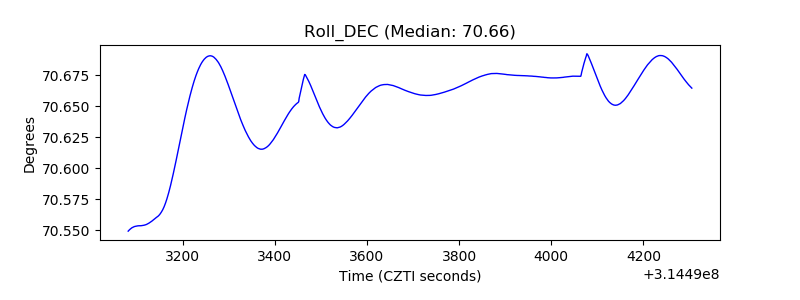 |
| _Roll_RA | 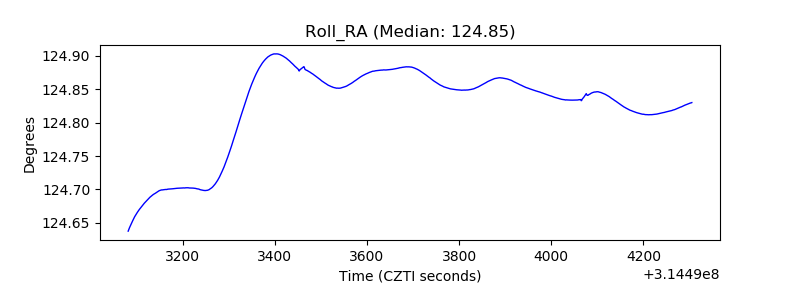 |
| Veto Counter | 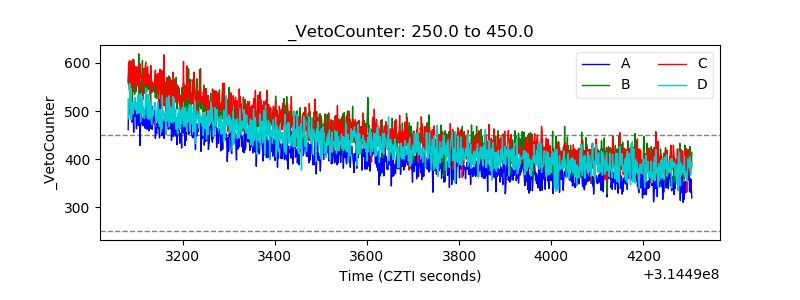 |