| Param | Original file | Final file |
|---|---|---|
| Filename | modeM0/AS1A07_054T01_9000003378_22853cztM0_level2.evt | modeM0/AS1A07_054T01_9000003378_22853cztM0_level2_quad_clean.evt |
| Size (bytes) | 491,610,240 | 132,194,880 |
| Size | 468.8 MB | 126.1 MB |
| Events in quadrant A | 3,329,609 | 919,948 |
| Events in quadrant B | 3,194,196 | 932,270 |
| Events in quadrant C | 3,113,226 | 880,371 |
| Events in quadrant D | 4,804,801 | 812,745 |
| Mode M9 | |||
|---|---|---|---|
| Quadrant | BADHDUFLAG | Total packets | Discarded packets |
| A | 0 | 17 | 0 |
| B | 0 | 18 | 0 |
| C | 0 | 18 | 0 |
| D | 0 | 18 | 0 |
| Mode SS | |||
|---|---|---|---|
| Quadrant | BADHDUFLAG | Total packets | Discarded packets |
| A | 0 | 134 | 0 |
| B | 0 | 134 | 0 |
| C | 0 | 134 | 0 |
| D | 0 | 134 | 0 |
| Mode M0 | |||
|---|---|---|---|
| Quadrant | BADHDUFLAG | Total packets | Discarded packets |
| A | 0 | 13915 | 2 |
| B | 0 | 13726 | 2 |
| C | 0 | 13569 | 2 |
| D | 0 | 18737 | 4 |
| Quadrant | Total seconds | Saturated seconds | Saturation percentage |
|---|---|---|---|
| A | 6573 | 15 | 0.228206% |
| B | 6573 | 28 | 0.425985% |
| C | 6573 | 50 | 0.760688% |
| D | 6572 | 574 | 8.734023% |
Noise dominated data is calculated using 1-second bins in cleaned event files. If a bin has >2000 counts, and if more than 50% of those come from <1% of pixels, then it is considered to be noise-dominated and hence unusable.
| Quadrant | # 1 sec bins | Bins with >0 counts | Bins with >2000 counts | High rate bins dominated by noise | Noise dominated (total time) | Noise dominated (detector-on time) | Marked lightcurve |
|---|---|---|---|---|---|---|---|
| A | 7753 | 6574 | 0 | 0 | 0.00% | 0.00% | 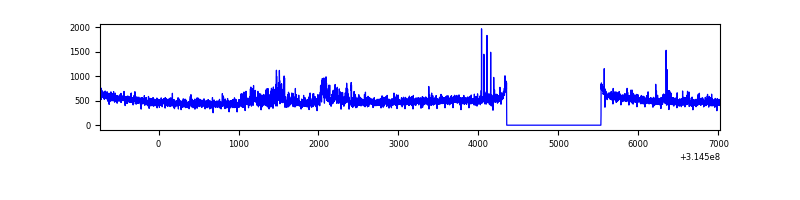 |
| B | 7753 | 6574 | 0 | 0 | 0.00% | 0.00% | 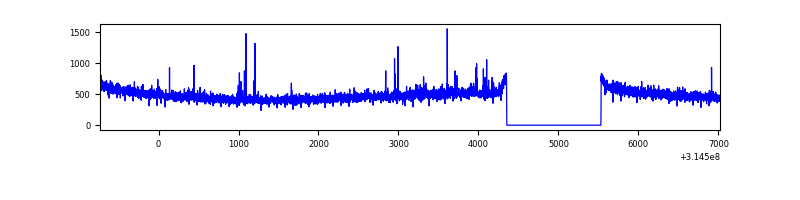 |
| C | 7753 | 6574 | 0 | 0 | 0.00% | 0.00% | 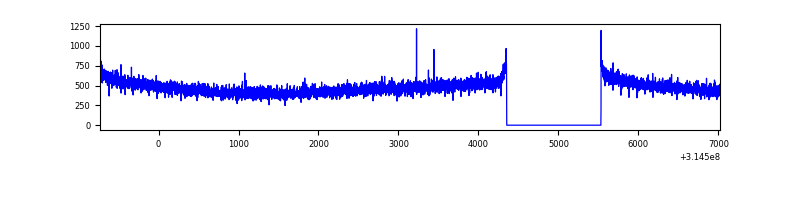 |
| D | 7751 | 6570 | 470 | 470 | 6.06% | 7.15% | 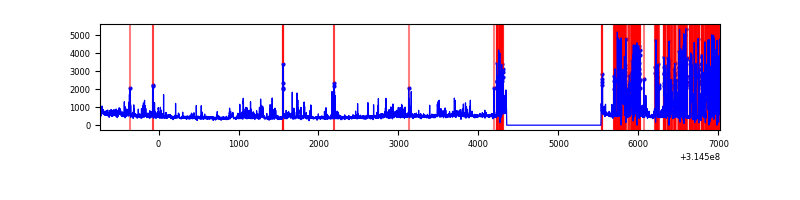 |
Top three noisy pixels from each quadrant. If the there are fewer than three noisy pixels in the level2.evt file, extra rows are filled as -1
| Pixel properties | Quadrant properties | ||||||
|---|---|---|---|---|---|---|---|
| Quadrant | DetID | PixID | Counts | Sigma | Mean | Median | Sigma |
| A | 13 | 252 | 186216 | 1165.59 | 803 | 788 | 159.1 |
| A | 4 | 2 | 41770 | 257.61 | 803 | 788 | 159.1 |
| A | 13 | 254 | 11316 | 66.18 | 803 | 788 | 159.1 |
| B | 0 | 190 | 21699 | 140.37 | 803 | 785 | 149.0 |
| B | 12 | 111 | 17565 | 112.62 | 803 | 785 | 149.0 |
| B | 11 | 111 | 15518 | 98.89 | 803 | 785 | 149.0 |
| C | 14 | 238 | 126512 | 718.4 | 764 | 769 | 175.0 |
| C | 7 | 247 | 6781 | 34.35 | 764 | 769 | 175.0 |
| C | 13 | 61 | 5420 | 26.57 | 764 | 769 | 175.0 |
| D | 7 | 238 | 1422833 | 8068.41 | 734 | 712 | 176.3 |
| D | 1 | 52 | 299695 | 1696.28 | 734 | 712 | 176.3 |
| D | 13 | 153 | 174534 | 986.18 | 734 | 712 | 176.3 |
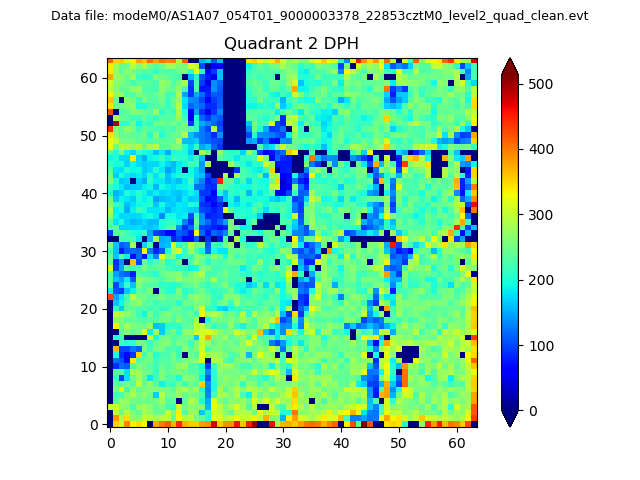
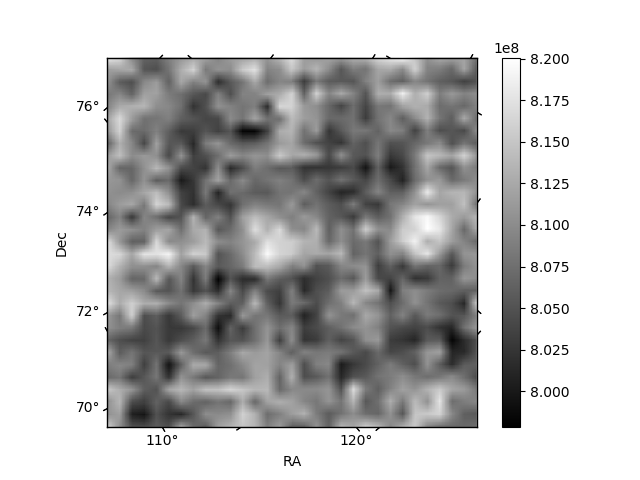
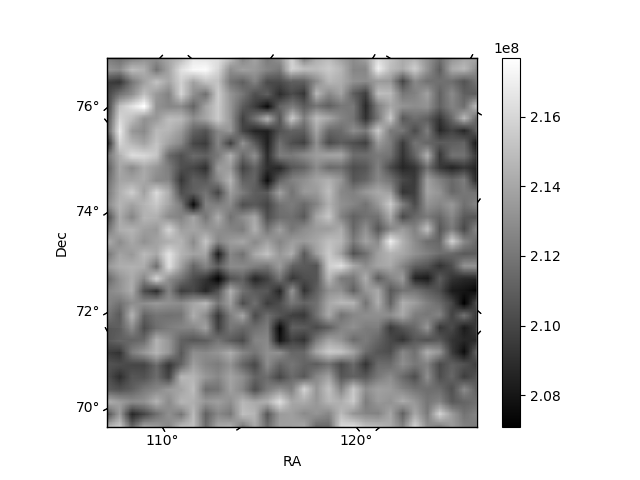
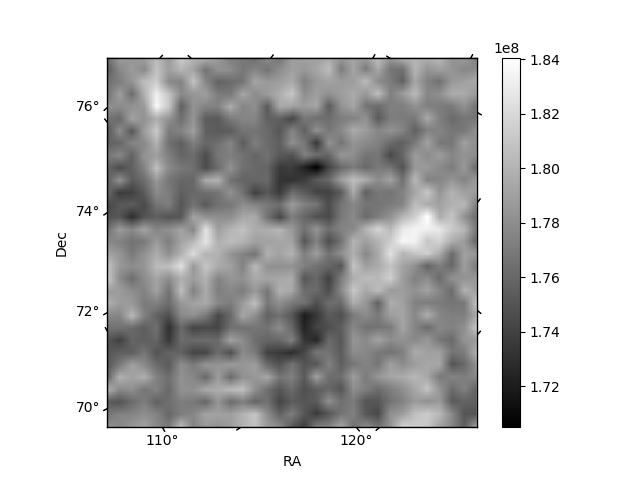
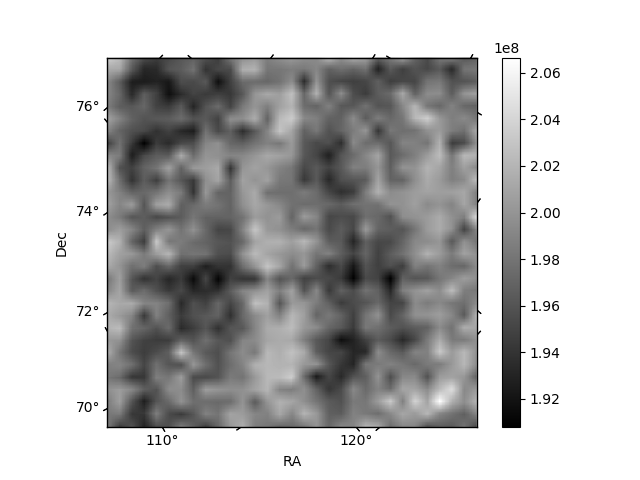
Histogram calculated using DETX and DETY for each event in the final _common_clean file
| Quadrant A | 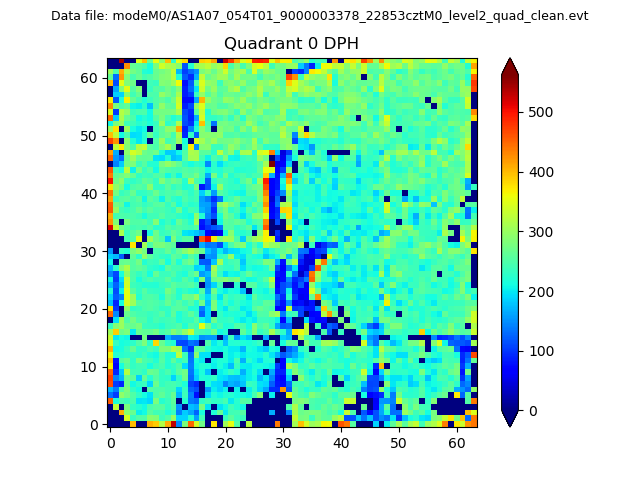 |
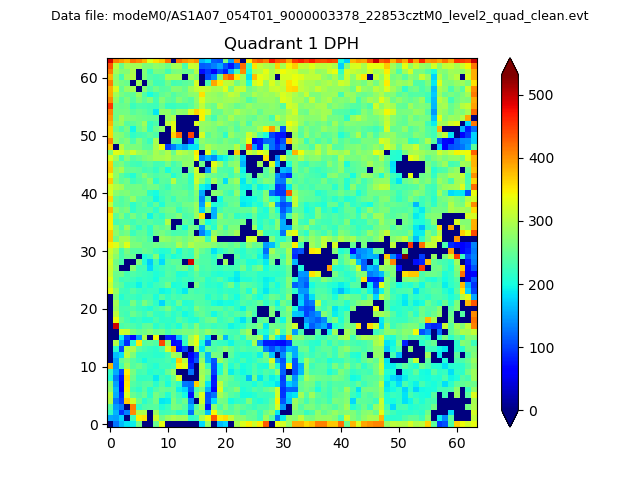 |
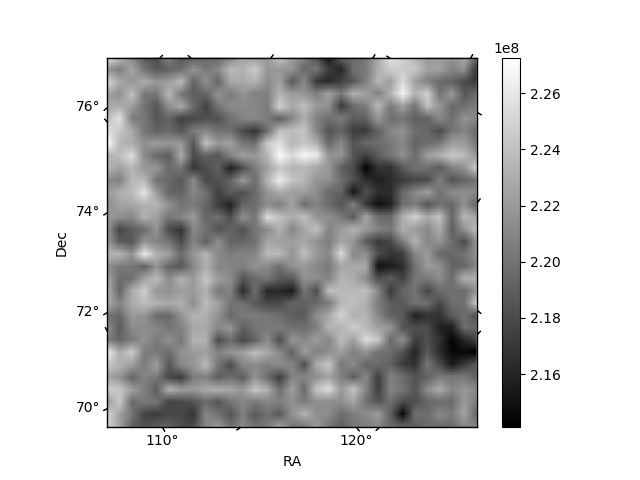
Quadrant B |
|---|---|---|---|
| Quadrant D | 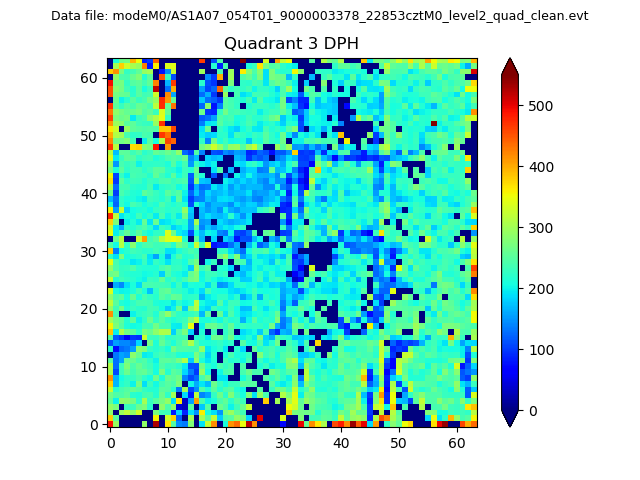 |
 |
Quadrant C |
| Plot type | Count rate plots | Images |
|---|---|---|
| Comparison with Poisson distribution Blue bars denote a histogram of data divided into 1 sec bins. Red curve is a Poisson curve with rate = median count rate of data. |
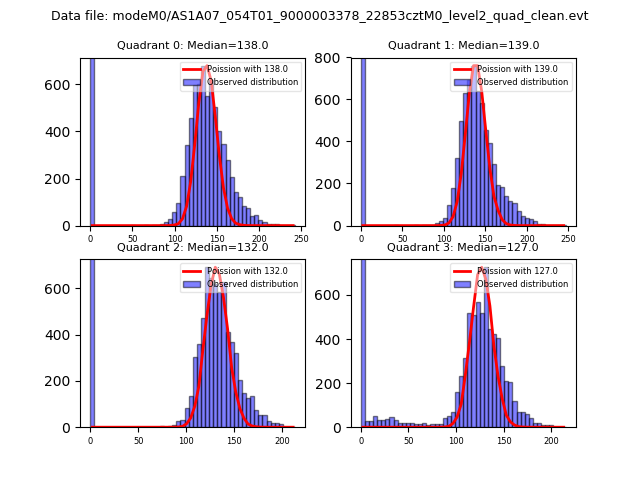 |
 |
| Quadrant-wise count rates Data is divided into 100 sec bins |
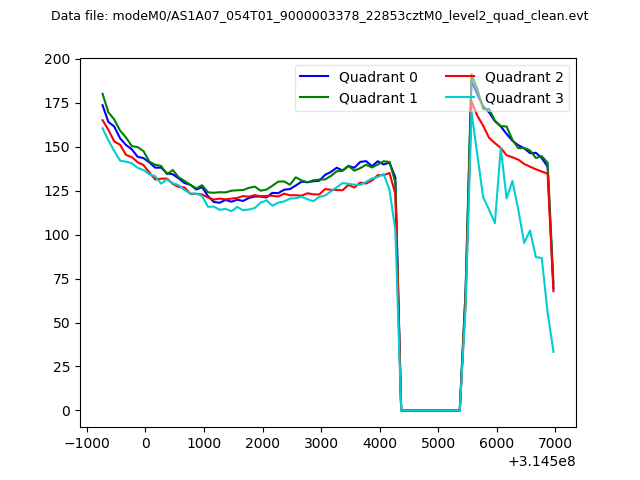 |
|
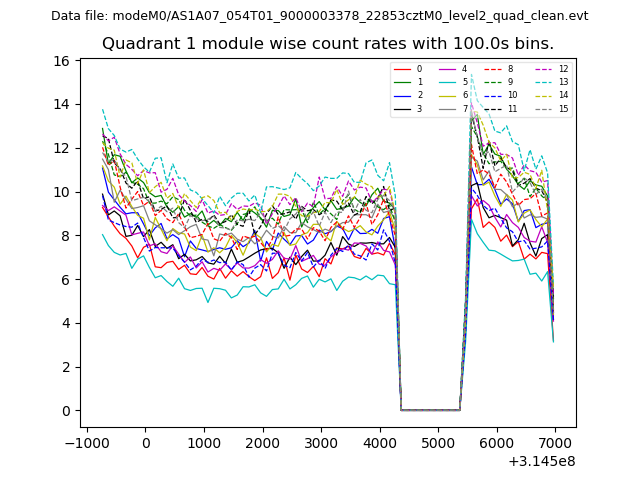
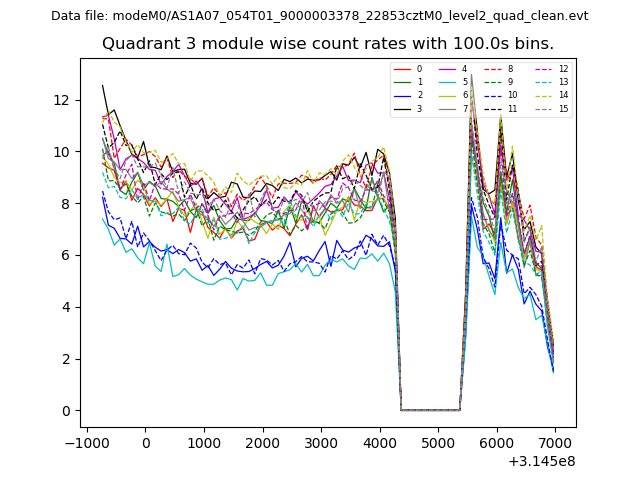
| Module-wise count rates for Quadrant A Data is divided into 100 sec bins |
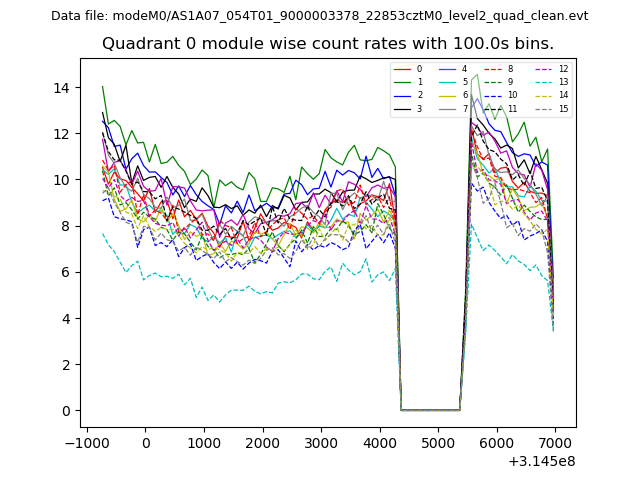 |
 |
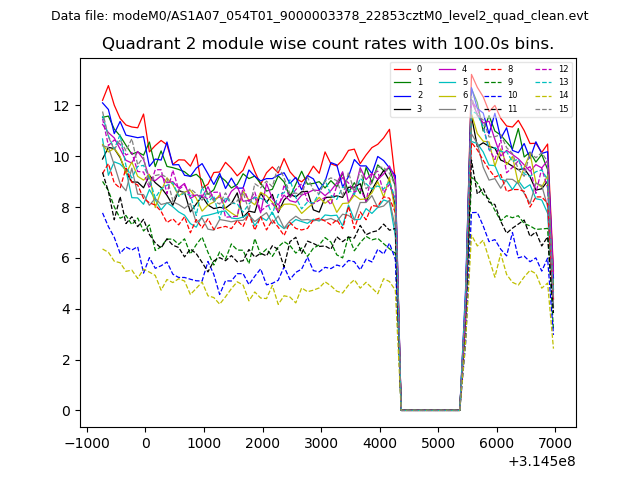
| Module-wise count rates for Quadrant B Data is divided into 100 sec bins |
 |
 |
| Module-wise count rates for Quadrant C Data is divided into 100 sec bins |
 |
 |
| Module-wise count rates for Quadrant D Data is divided into 100 sec bins |
 |
 |
| Parameter | Plot |
|---|---|
| CZT HV Monitor | 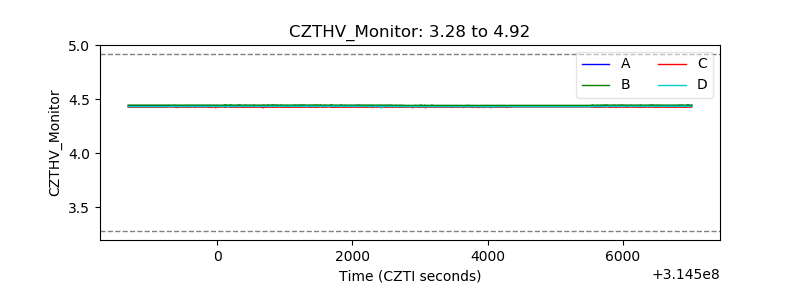 |
| D_VDD | 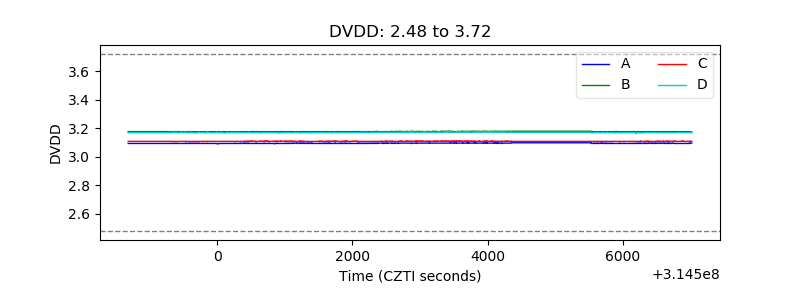 |
| Temperature 1 | 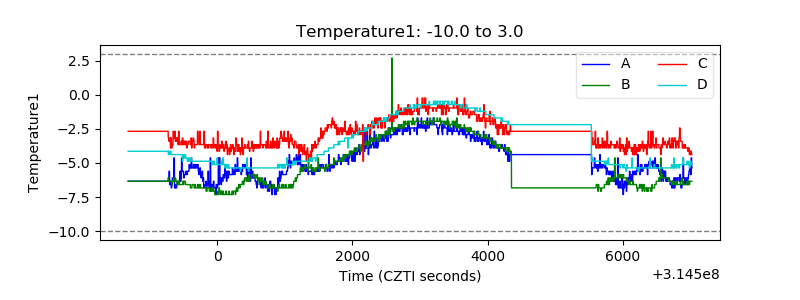 |
| Veto HV Monitor | 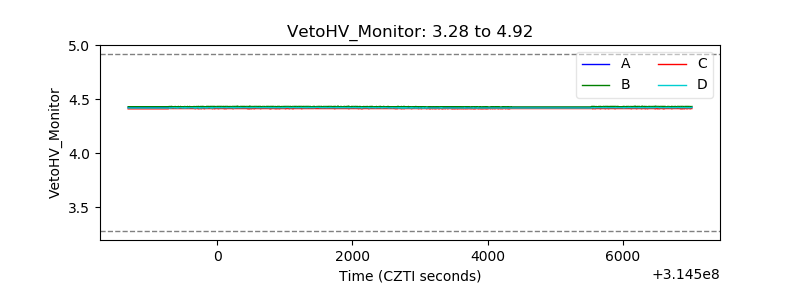 |
| Veto LLD | 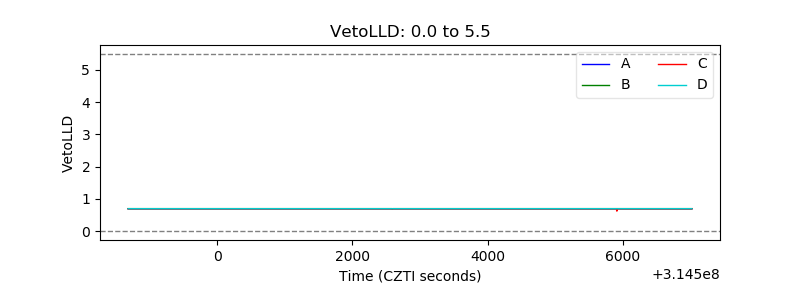 |
| Alpha Counter | 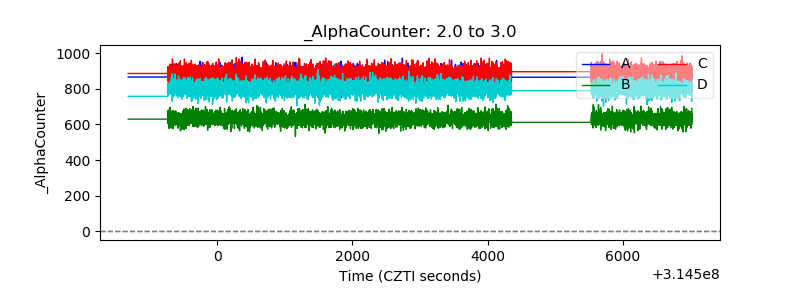 |
| _CPM_Rate | 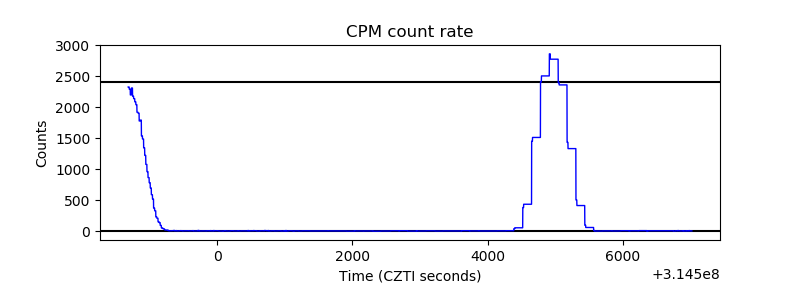 |
| CZT Counter | 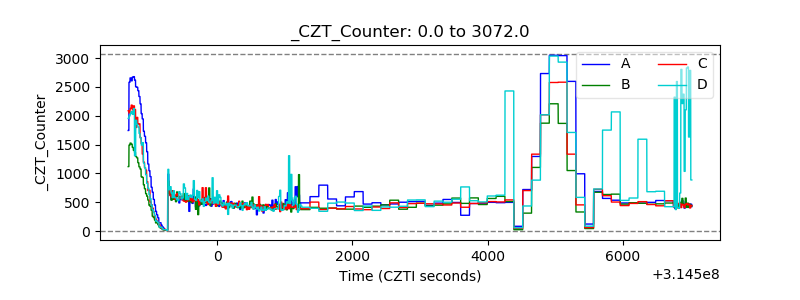 |
| +2.5 Volts monitor | 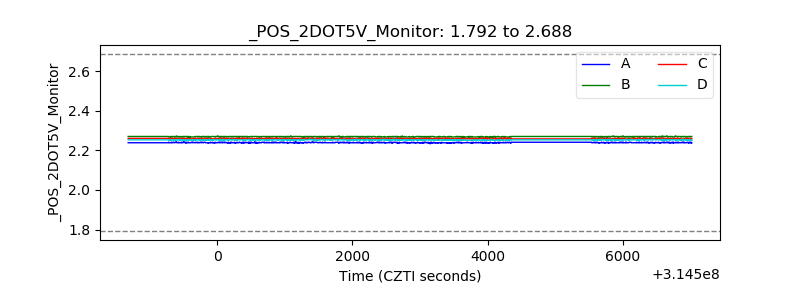 |
| +5 Volts monitor |  |
| _ROLL_ROT | 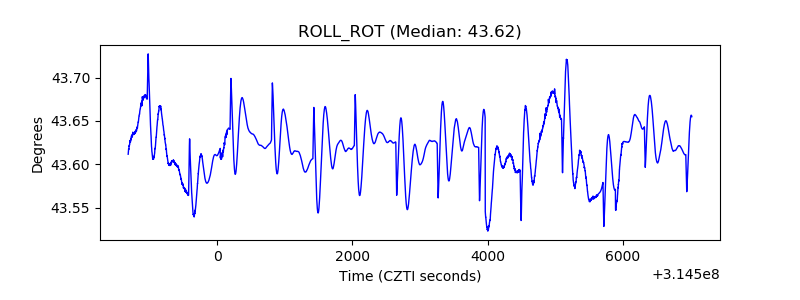 |
| _Roll_DEC | 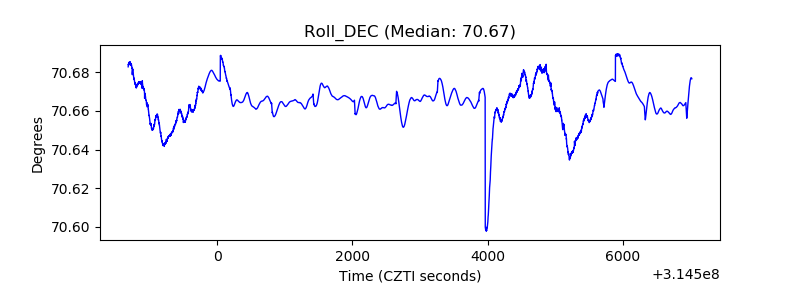 |
| _Roll_RA | 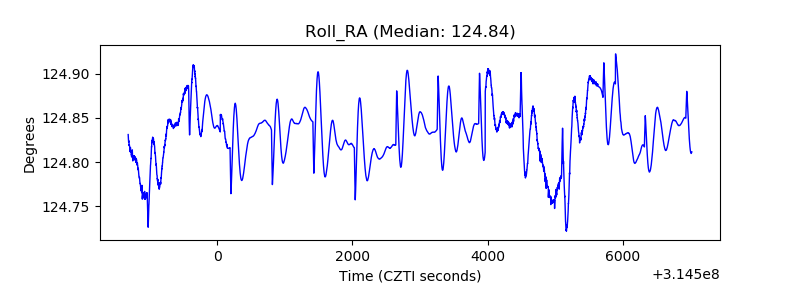 |
| Veto Counter | 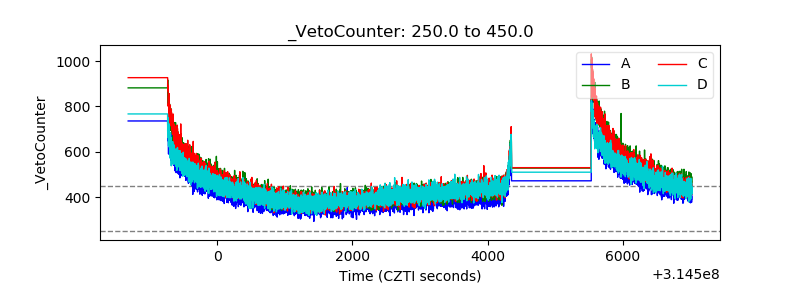 |