| Param | Original file | Final file |
|---|---|---|
| Filename | modeM0/AS1A07_054T01_9000003378_22856cztM0_level2.evt | modeM0/AS1A07_054T01_9000003378_22856cztM0_level2_quad_clean.evt |
| Size (bytes) | 438,546,240 | 130,132,800 |
| Size | 418.2 MB | 124.1 MB |
| Events in quadrant A | 3,041,041 | 912,158 |
| Events in quadrant B | 3,041,373 | 914,671 |
| Events in quadrant C | 2,975,816 | 847,246 |
| Events in quadrant D | 3,808,711 | 841,713 |
| Mode M9 | |||
|---|---|---|---|
| Quadrant | BADHDUFLAG | Total packets | Discarded packets |
| A | 0 | 13 | 0 |
| B | 0 | 13 | 0 |
| C | 0 | 13 | 0 |
| D | 0 | 13 | 0 |
| Mode SS | |||
|---|---|---|---|
| Quadrant | BADHDUFLAG | Total packets | Discarded packets |
| A | 0 | 124 | 0 |
| B | 0 | 124 | 0 |
| C | 0 | 124 | 0 |
| D | 0 | 124 | 0 |
| Mode M0 | |||
|---|---|---|---|
| Quadrant | BADHDUFLAG | Total packets | Discarded packets |
| A | 0 | 12578 | 1 |
| B | 0 | 12578 | 1 |
| C | 0 | 12534 | 1 |
| D | 0 | 15296 | 1 |
| Quadrant | Total seconds | Saturated seconds | Saturation percentage |
|---|---|---|---|
| A | 6099 | 59 | 0.967372% |
| B | 6099 | 76 | 1.246106% |
| C | 6099 | 88 | 1.442859% |
| D | 6100 | 118 | 1.934426% |
Noise dominated data is calculated using 1-second bins in cleaned event files. If a bin has >2000 counts, and if more than 50% of those come from <1% of pixels, then it is considered to be noise-dominated and hence unusable.
| Quadrant | # 1 sec bins | Bins with >0 counts | Bins with >2000 counts | High rate bins dominated by noise | Noise dominated (total time) | Noise dominated (detector-on time) | Marked lightcurve |
|---|---|---|---|---|---|---|---|
| A | 7394 | 6100 | 0 | 0 | 0.00% | 0.00% | 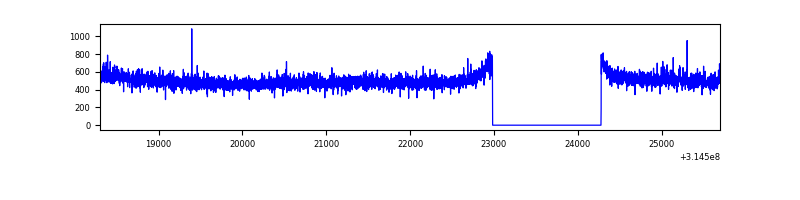 |
| B | 7394 | 6100 | 0 | 0 | 0.00% | 0.00% | 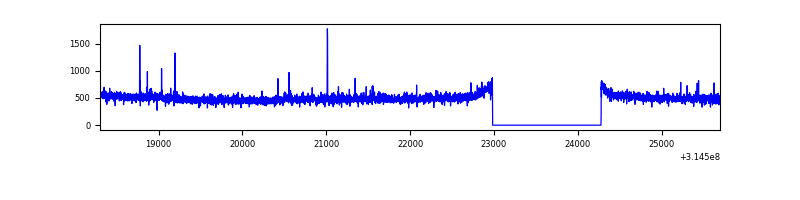 |
| C | 7394 | 6100 | 0 | 0 | 0.00% | 0.00% | 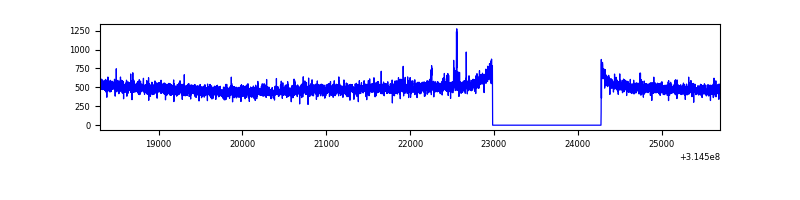 |
| D | 7395 | 6101 | 78 | 78 | 1.05% | 1.28% | 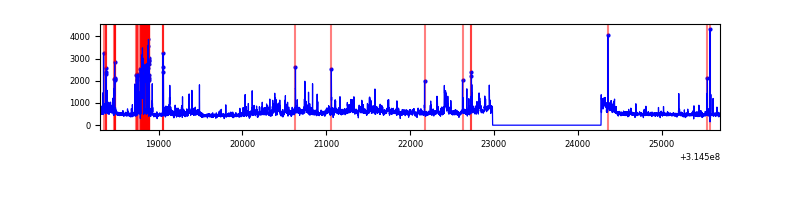 |
Top three noisy pixels from each quadrant. If the there are fewer than three noisy pixels in the level2.evt file, extra rows are filled as -1
| Pixel properties | Quadrant properties | ||||||
|---|---|---|---|---|---|---|---|
| Quadrant | DetID | PixID | Counts | Sigma | Mean | Median | Sigma |
| A | 13 | 252 | 19766 | 122.66 | 782 | 770 | 154.9 |
| A | 13 | 254 | 9817 | 58.42 | 782 | 770 | 154.9 |
| A | 11 | 47 | 9799 | 58.3 | 782 | 770 | 154.9 |
| B | 12 | 111 | 16419 | 109.66 | 769 | 753 | 142.9 |
| B | 11 | 111 | 14377 | 95.36 | 769 | 753 | 142.9 |
| B | 14 | 111 | 12555 | 82.61 | 769 | 753 | 142.9 |
| C | 14 | 238 | 120194 | 719.47 | 726 | 730 | 166.0 |
| C | 10 | 22 | 12022 | 68.01 | 726 | 730 | 166.0 |
| C | 0 | 239 | 6662 | 35.73 | 726 | 730 | 166.0 |
| D | 7 | 238 | 638015 | 3529.26 | 746 | 724 | 180.6 |
| D | 13 | 153 | 134981 | 743.5 | 746 | 724 | 180.6 |
| D | 1 | 52 | 121387 | 668.22 | 746 | 724 | 180.6 |
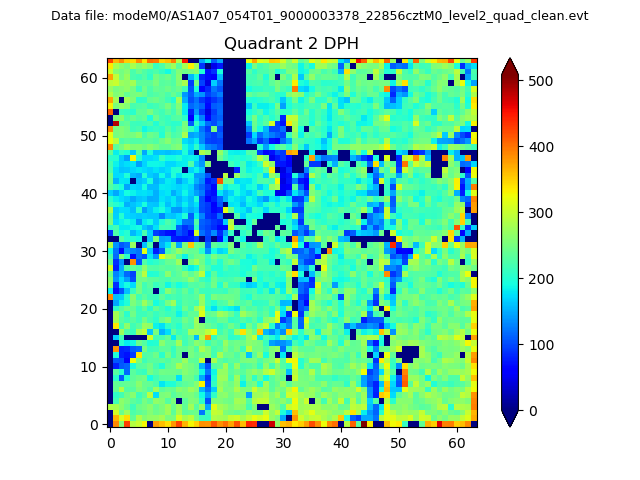
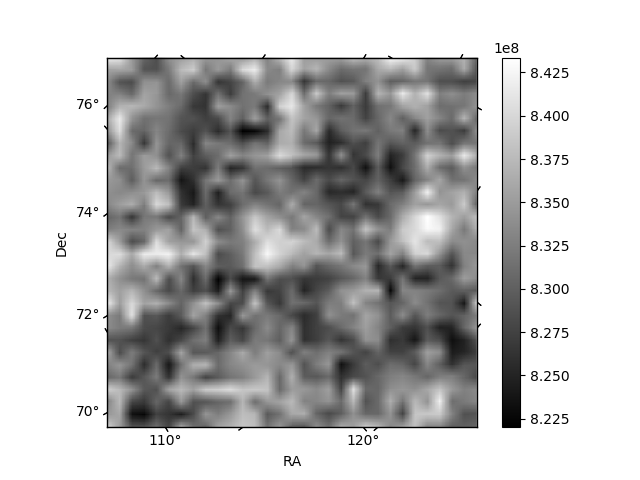
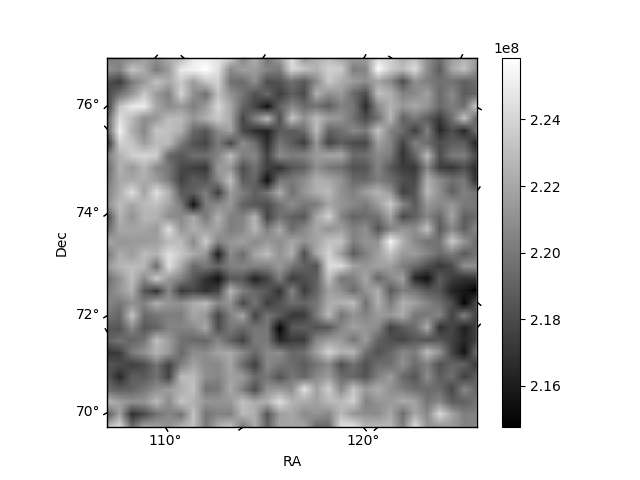
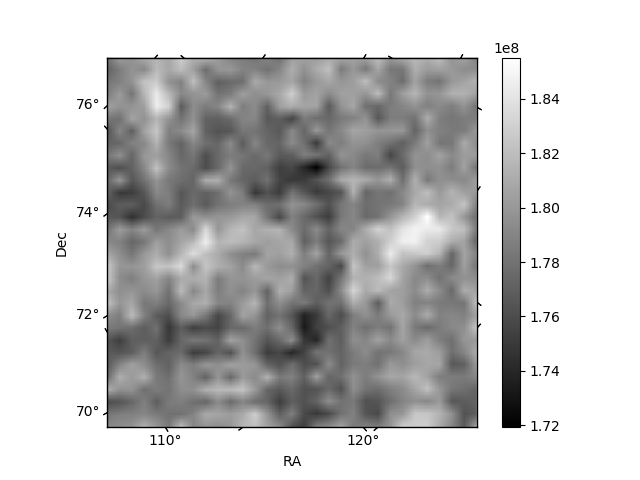
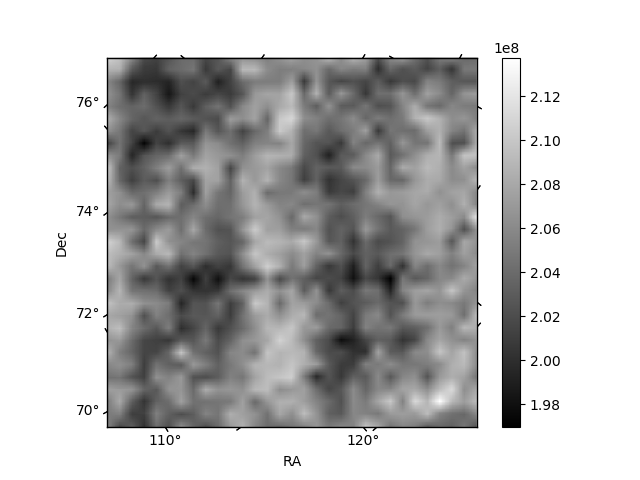
Histogram calculated using DETX and DETY for each event in the final _common_clean file
| Quadrant A | 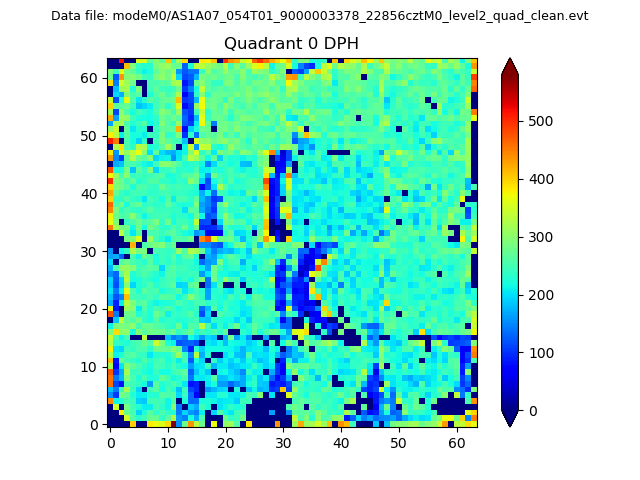 |
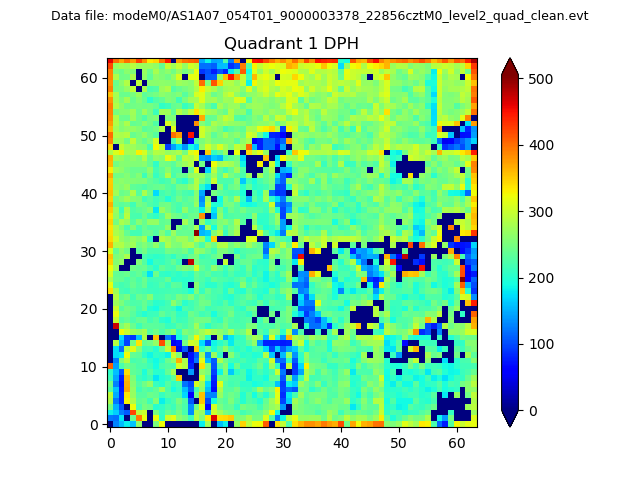 |
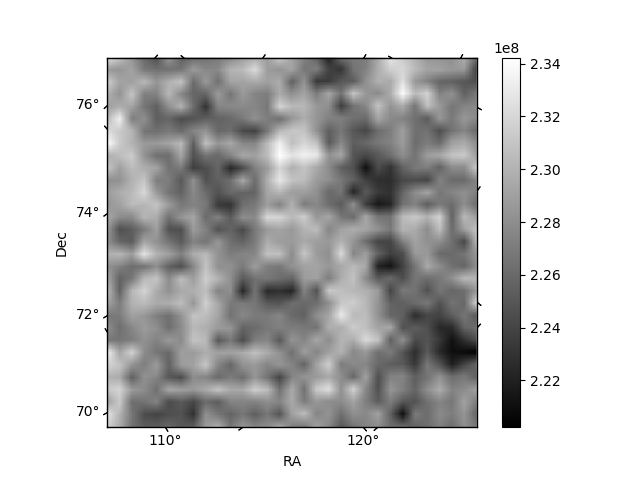
Quadrant B |
|---|---|---|---|
| Quadrant D | 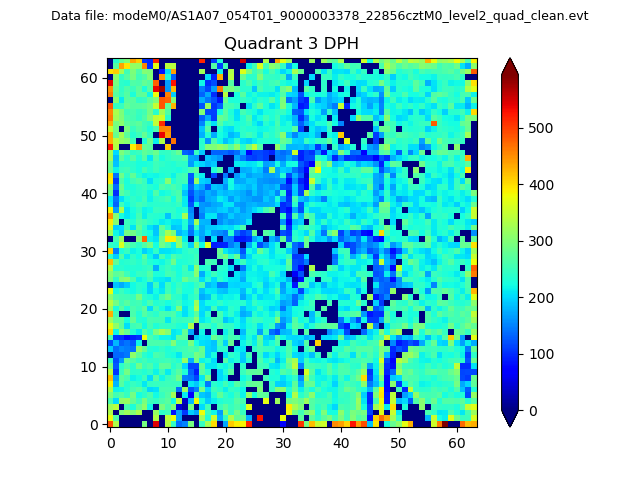 |
 |
Quadrant C |
| Plot type | Count rate plots | Images |
|---|---|---|
| Comparison with Poisson distribution Blue bars denote a histogram of data divided into 1 sec bins. Red curve is a Poisson curve with rate = median count rate of data. |
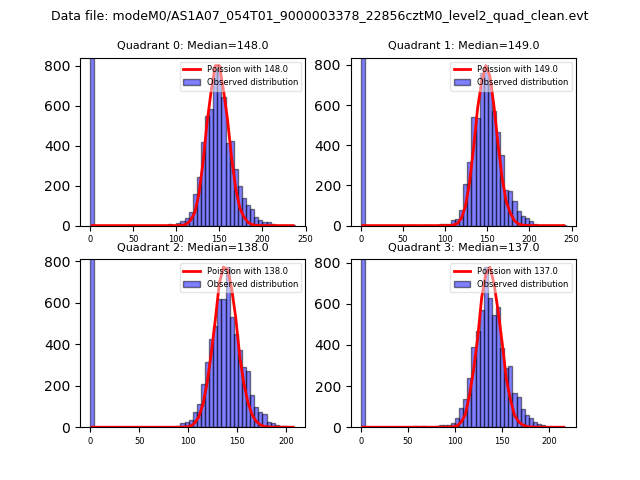 |
 |
| Quadrant-wise count rates Data is divided into 100 sec bins |
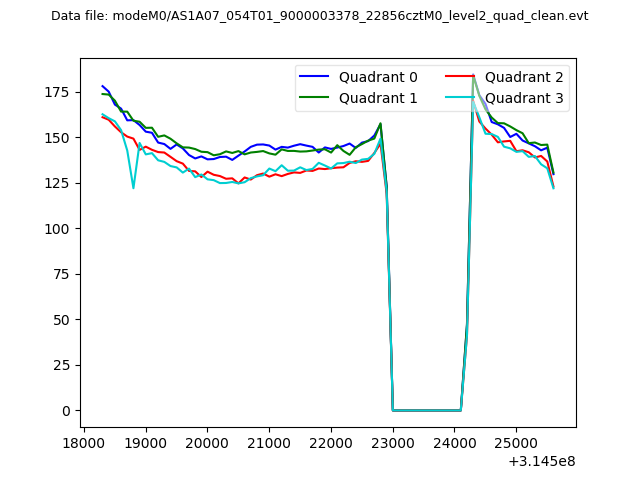 |
|
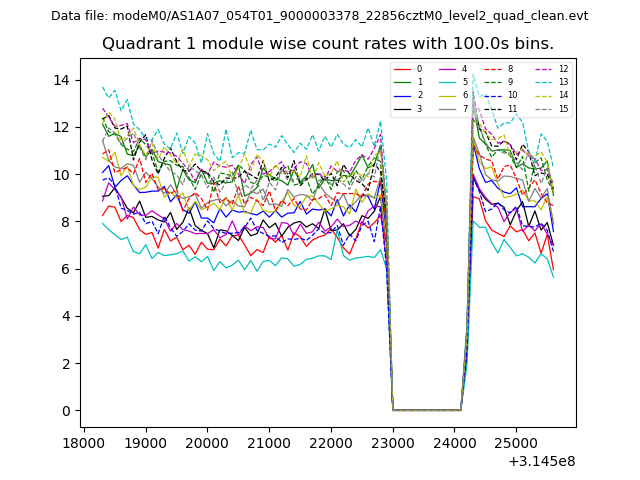
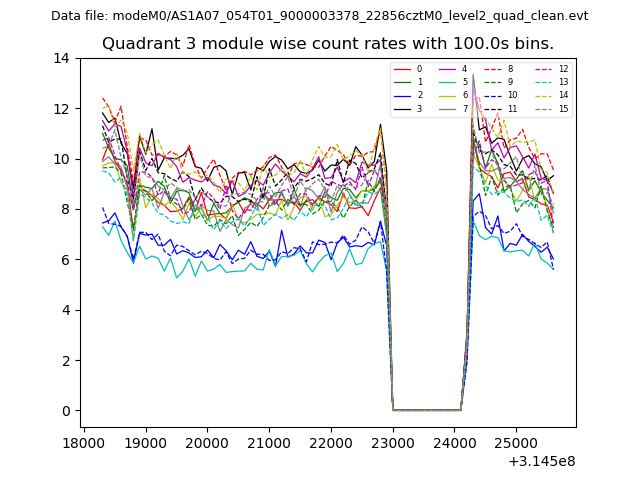
| Module-wise count rates for Quadrant A Data is divided into 100 sec bins |
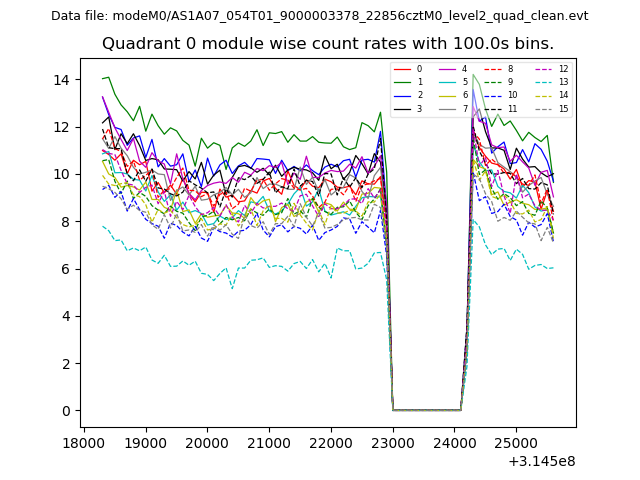 |
 |
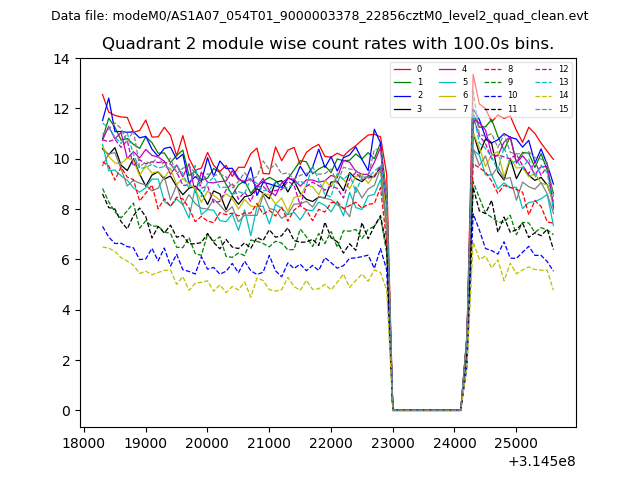
| Module-wise count rates for Quadrant B Data is divided into 100 sec bins |
 |
 |
| Module-wise count rates for Quadrant C Data is divided into 100 sec bins |
 |
 |
| Module-wise count rates for Quadrant D Data is divided into 100 sec bins |
 |
 |
| Parameter | Plot |
|---|---|
| CZT HV Monitor | 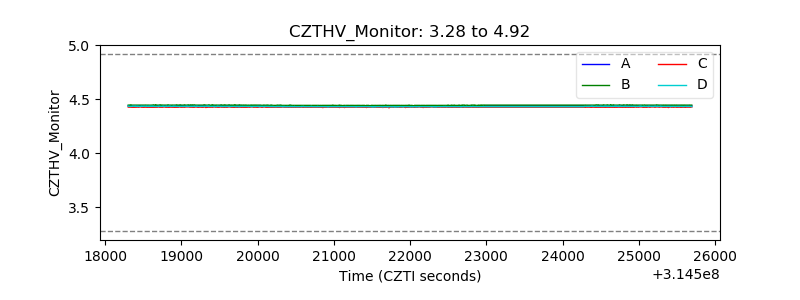 |
| D_VDD | 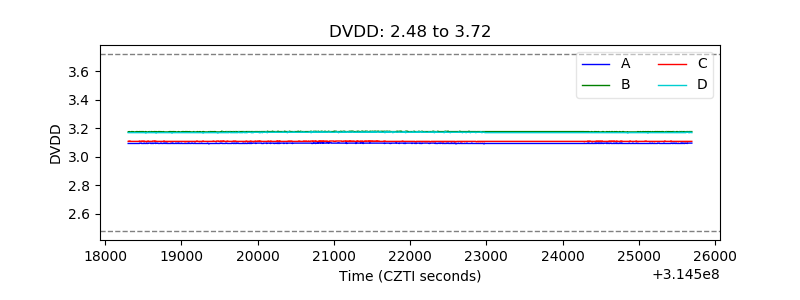 |
| Temperature 1 | 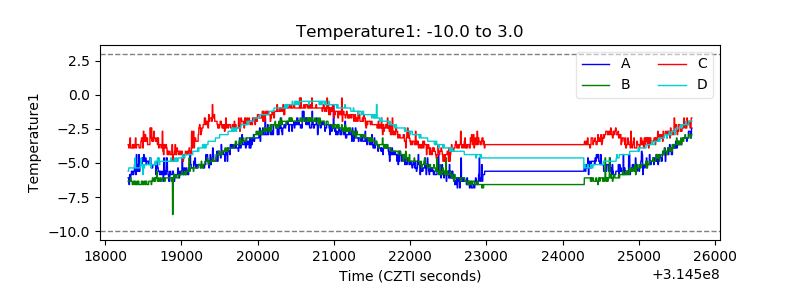 |
| Veto HV Monitor | 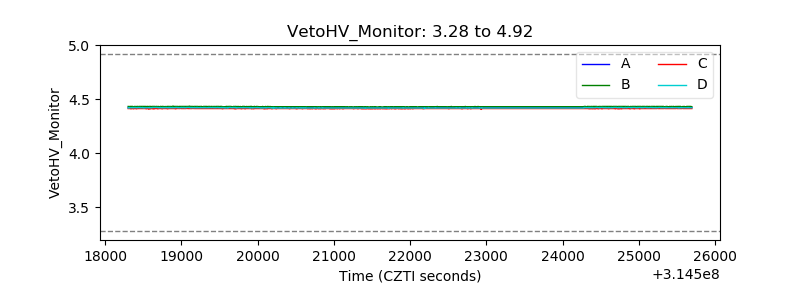 |
| Veto LLD | 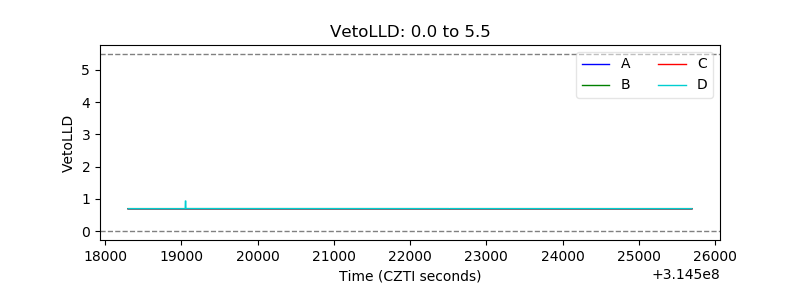 |
| Alpha Counter |  |
| _CPM_Rate |  |
| CZT Counter | 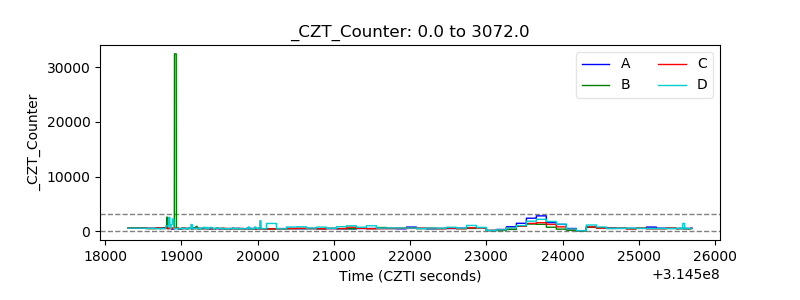 |
| +2.5 Volts monitor | 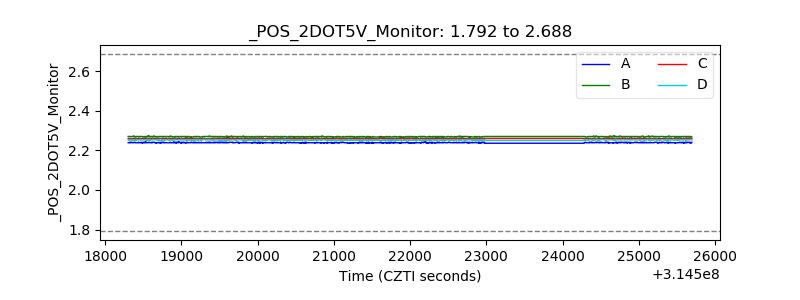 |
| +5 Volts monitor |  |
| _ROLL_ROT | 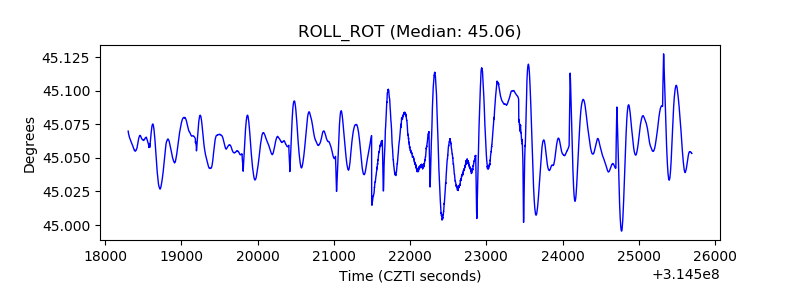 |
| _Roll_DEC | 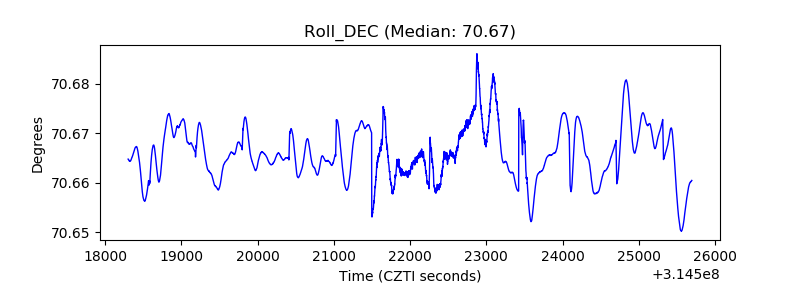 |
| _Roll_RA | 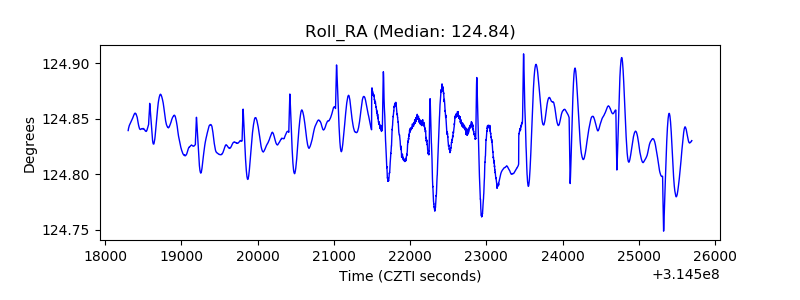 |
| Veto Counter | 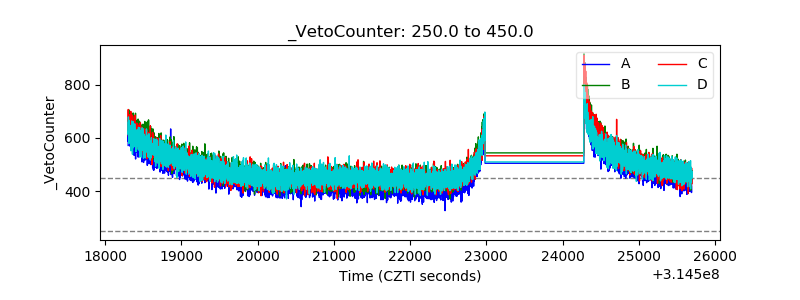 |