| Param | Original file | Final file |
|---|---|---|
| Filename | modeM0/AS1A07_054T01_9000003378_22857cztM0_level2.evt | modeM0/AS1A07_054T01_9000003378_22857cztM0_level2_quad_clean.evt |
| Size (bytes) | 1,182,936,960 | 323,737,920 |
| Size | 1.1 GB | 308.7 MB |
| Events in quadrant A | 7,822,477 | 2,275,746 |
| Events in quadrant B | 7,726,033 | 2,280,143 |
| Events in quadrant C | 7,648,381 | 2,117,315 |
| Events in quadrant D | 11,573,228 | 2,055,710 |
| Mode M9 | |||
|---|---|---|---|
| Quadrant | BADHDUFLAG | Total packets | Discarded packets |
| A | 0 | 38 | 0 |
| B | 0 | 38 | 0 |
| C | 0 | 38 | 0 |
| D | 0 | 38 | 0 |
| Mode SS | |||
|---|---|---|---|
| Quadrant | BADHDUFLAG | Total packets | Discarded packets |
| A | 0 | 318 | 0 |
| B | 0 | 318 | 0 |
| C | 0 | 318 | 0 |
| D | 0 | 318 | 0 |
| Mode M0 | |||
|---|---|---|---|
| Quadrant | BADHDUFLAG | Total packets | Discarded packets |
| A | 0 | 32519 | 3 |
| B | 0 | 32342 | 3 |
| C | 0 | 32277 | 3 |
| D | 0 | 44413 | 3 |
| Quadrant | Total seconds | Saturated seconds | Saturation percentage |
|---|---|---|---|
| A | 15617 | 176 | 1.126977% |
| B | 15618 | 227 | 1.453451% |
| C | 15618 | 251 | 1.607120% |
| D | 15618 | 966 | 6.185171% |
Noise dominated data is calculated using 1-second bins in cleaned event files. If a bin has >2000 counts, and if more than 50% of those come from <1% of pixels, then it is considered to be noise-dominated and hence unusable.
| Quadrant | # 1 sec bins | Bins with >0 counts | Bins with >2000 counts | High rate bins dominated by noise | Noise dominated (total time) | Noise dominated (detector-on time) | Marked lightcurve |
|---|---|---|---|---|---|---|---|
| A | 19377 | 15620 | 0 | 0 | 0.00% | 0.00% | 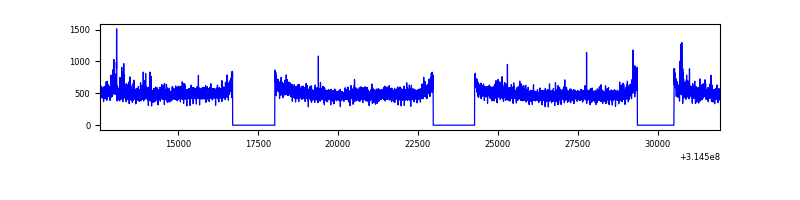 |
| B | 19378 | 15621 | 3 | 3 | 0.02% | 0.02% | 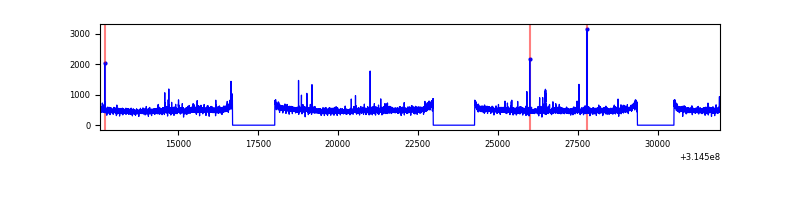 |
| C | 19378 | 15621 | 0 | 0 | 0.00% | 0.00% | 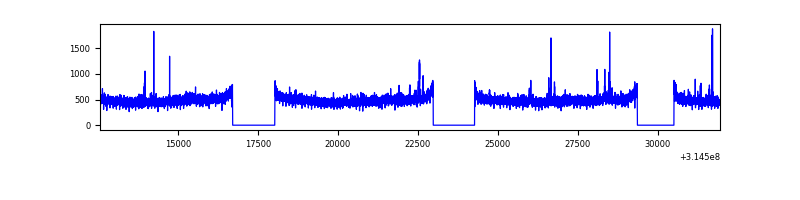 |
| D | 19378 | 15621 | 717 | 717 | 3.70% | 4.59% | 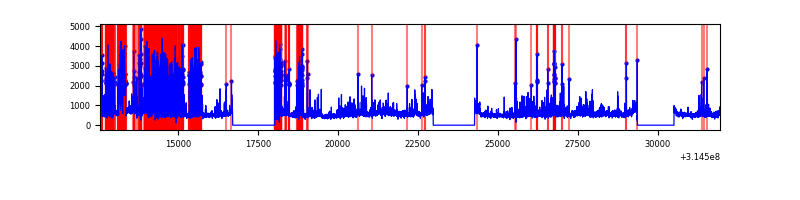 |
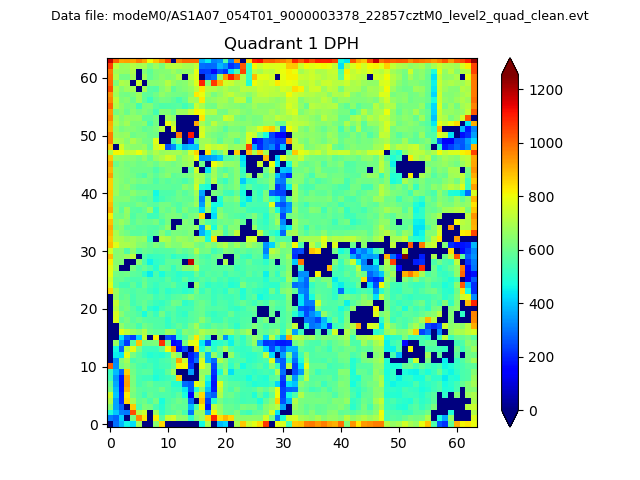
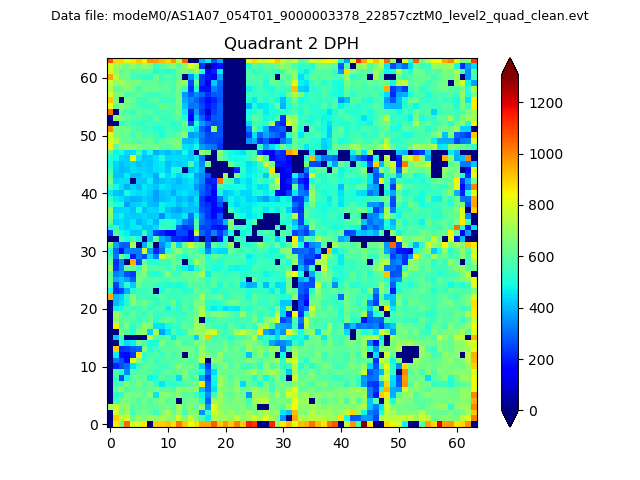
Top three noisy pixels from each quadrant. If the there are fewer than three noisy pixels in the level2.evt file, extra rows are filled as -1
| Pixel properties | Quadrant properties | ||||||
|---|---|---|---|---|---|---|---|
| Quadrant | DetID | PixID | Counts | Sigma | Mean | Median | Sigma |
| A | 13 | 252 | 112961 | 286.62 | 1978 | 1943 | 387.3 |
| A | 11 | 47 | 50624 | 125.68 | 1978 | 1943 | 387.3 |
| A | 4 | 2 | 43569 | 107.47 | 1978 | 1943 | 387.3 |
| B | 0 | 190 | 48405 | 128.88 | 1948 | 1904 | 360.8 |
| B | 12 | 111 | 41612 | 110.05 | 1948 | 1904 | 360.8 |
| B | 11 | 111 | 36560 | 96.05 | 1948 | 1904 | 360.8 |
| C | 14 | 238 | 302576 | 716.07 | 1844 | 1852 | 420.0 |
| C | 10 | 22 | 64391 | 148.92 | 1844 | 1852 | 420.0 |
| C | 0 | 239 | 51578 | 118.41 | 1844 | 1852 | 420.0 |
| D | 7 | 238 | 2963607 | 6662.87 | 1866 | 1814 | 444.5 |
| D | 1 | 52 | 809337 | 1816.61 | 1866 | 1814 | 444.5 |
| D | 13 | 153 | 311775 | 697.29 | 1866 | 1814 | 444.5 |
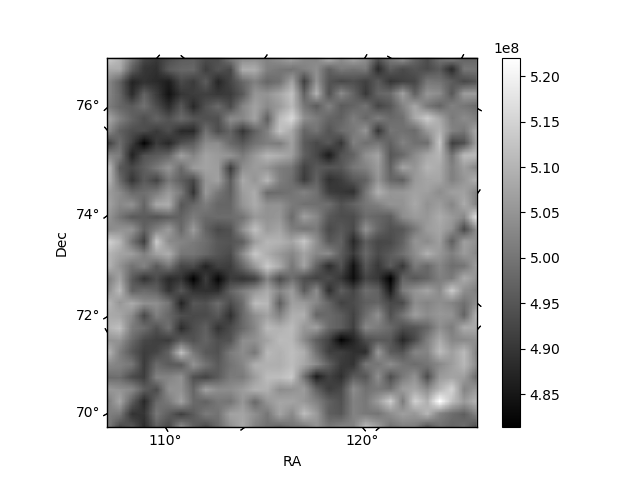
Histogram calculated using DETX and DETY for each event in the final _common_clean file
| Quadrant A | 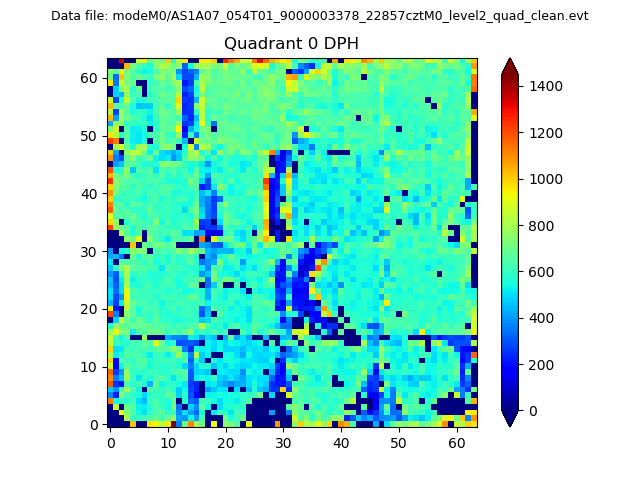 |
 |
Quadrant B |
|---|---|---|---|
| Quadrant D | 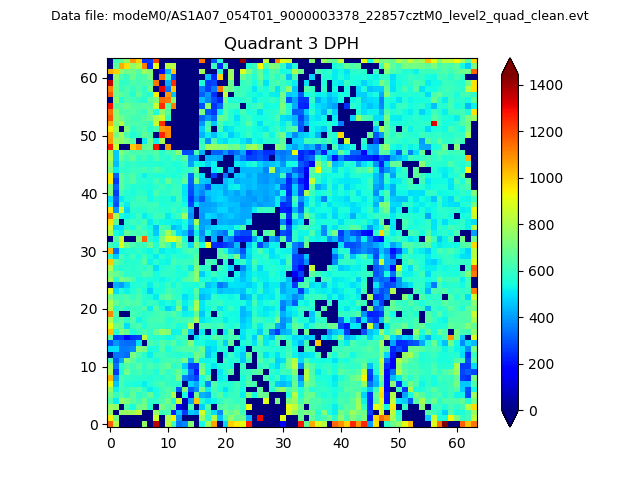 |
 |
Quadrant C |
| Plot type | Count rate plots | Images |
|---|---|---|
| Comparison with Poisson distribution Blue bars denote a histogram of data divided into 1 sec bins. Red curve is a Poisson curve with rate = median count rate of data. |
 |
 |
| Quadrant-wise count rates Data is divided into 100 sec bins |
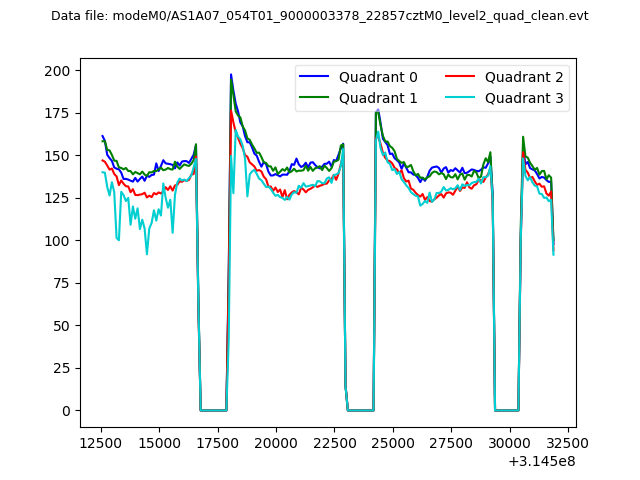 |
|
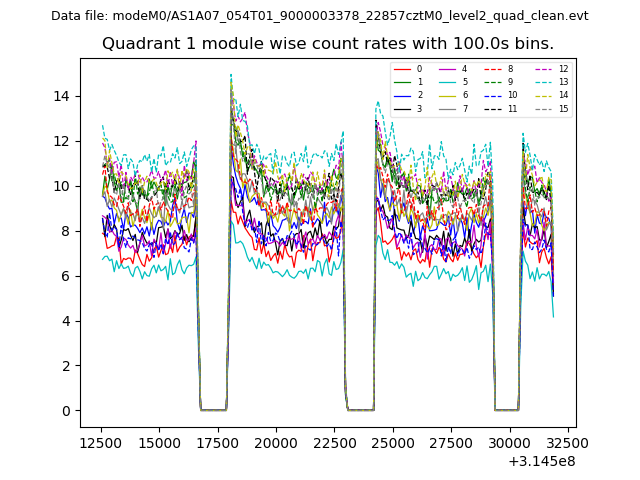
| Module-wise count rates for Quadrant A Data is divided into 100 sec bins |
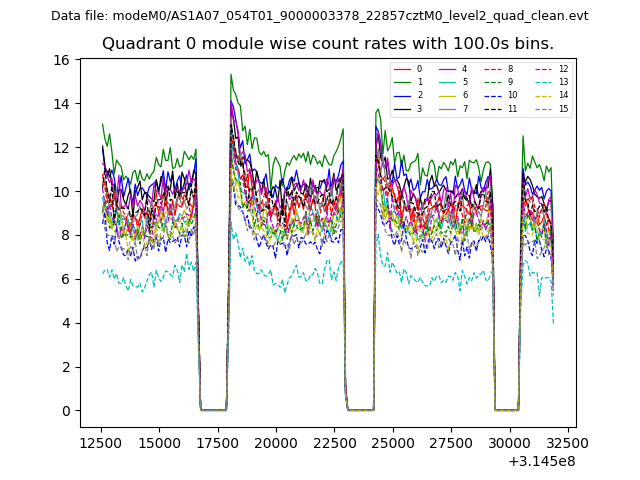 |
 |
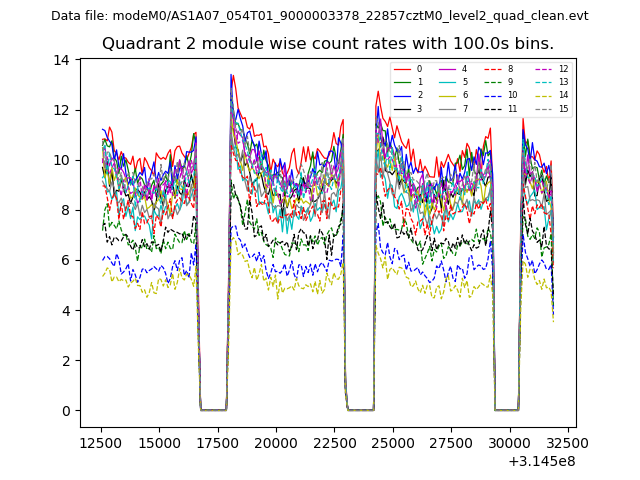
| Module-wise count rates for Quadrant B Data is divided into 100 sec bins |
 |
 |
| Module-wise count rates for Quadrant C Data is divided into 100 sec bins |
 |
 |
| Module-wise count rates for Quadrant D Data is divided into 100 sec bins |
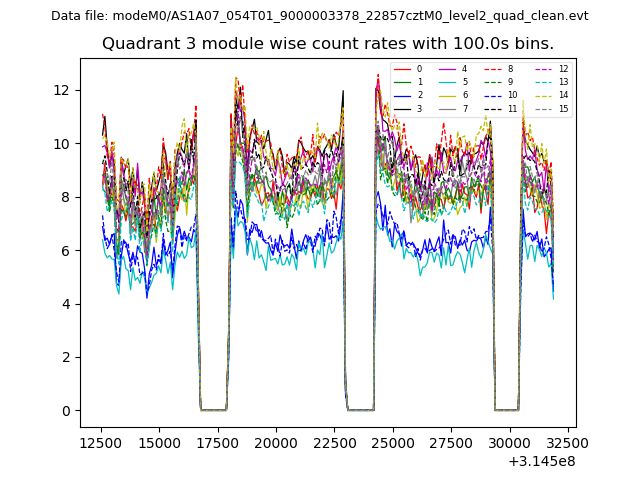 |
 |
| Parameter | Plot |
|---|---|
| CZT HV Monitor | 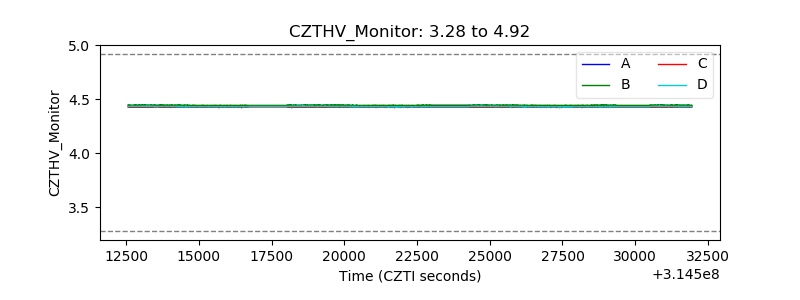 |
| D_VDD | 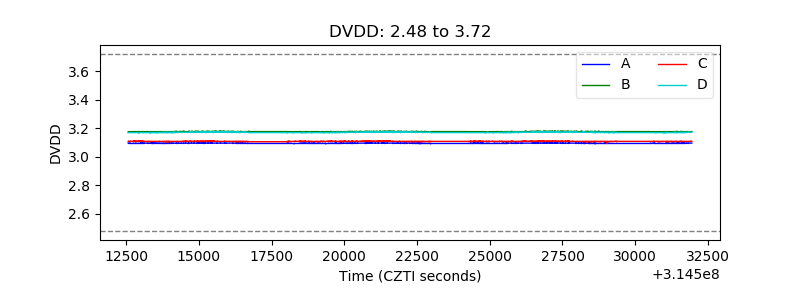 |
| Temperature 1 | 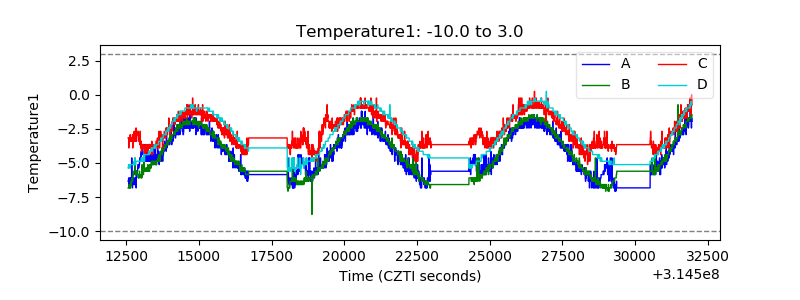 |
| Veto HV Monitor | 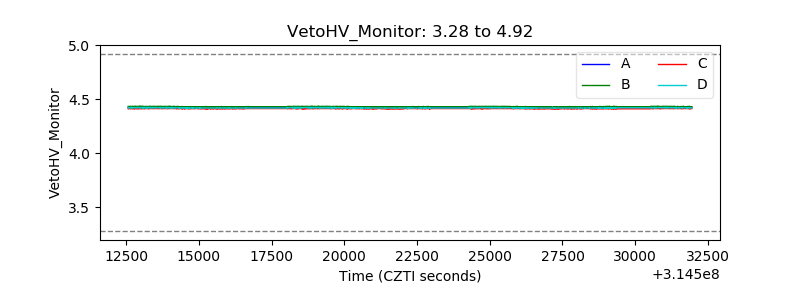 |
| Veto LLD | 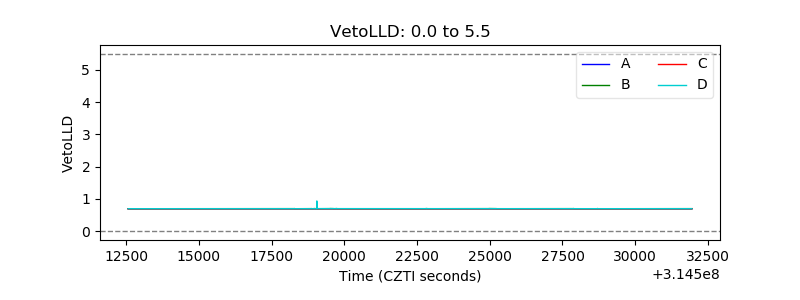 |
| Alpha Counter | 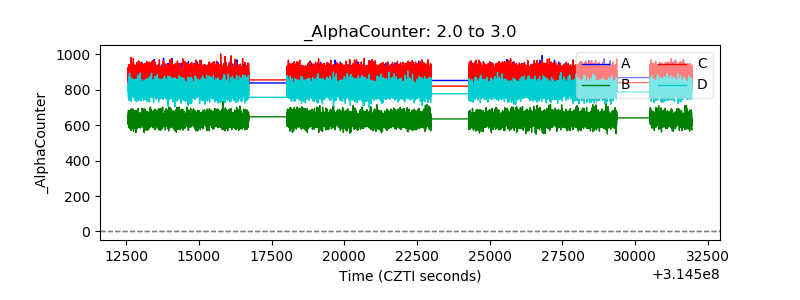 |
| _CPM_Rate | 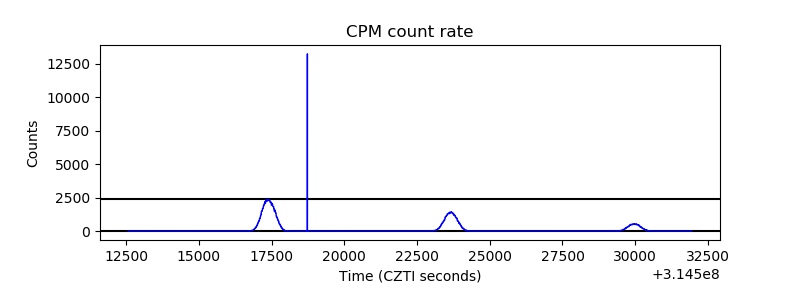 |
| CZT Counter | 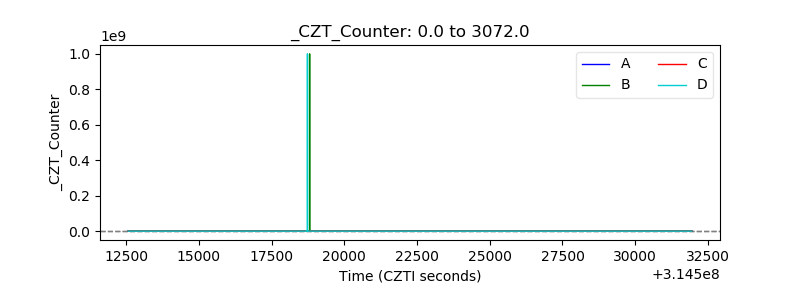 |
| +2.5 Volts monitor |  |
| +5 Volts monitor | 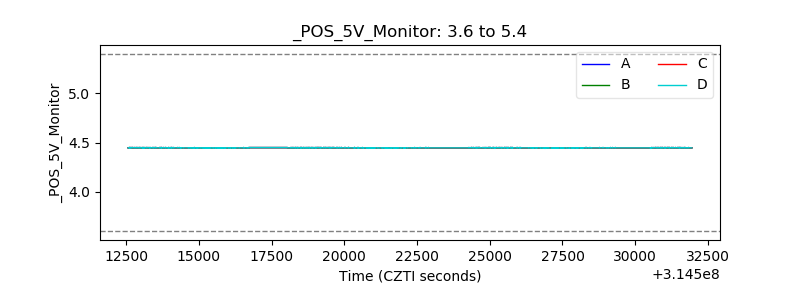 |
| _ROLL_ROT | 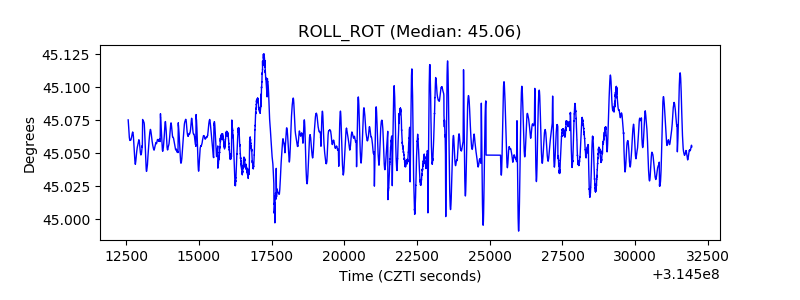 |
| _Roll_DEC | 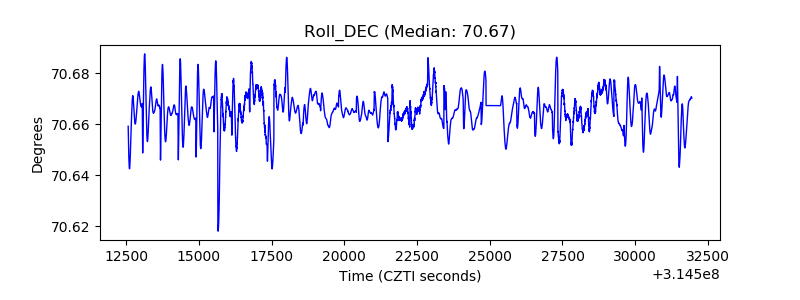 |
| _Roll_RA | 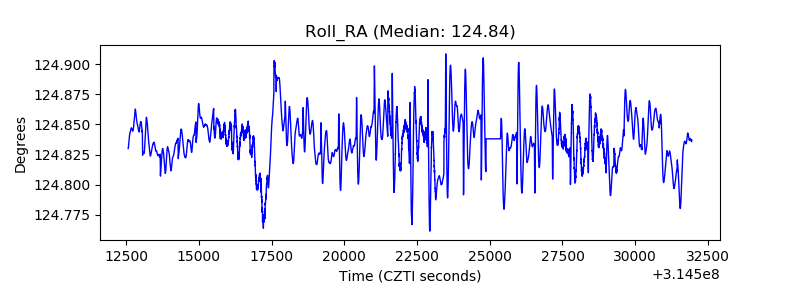 |
| Veto Counter | 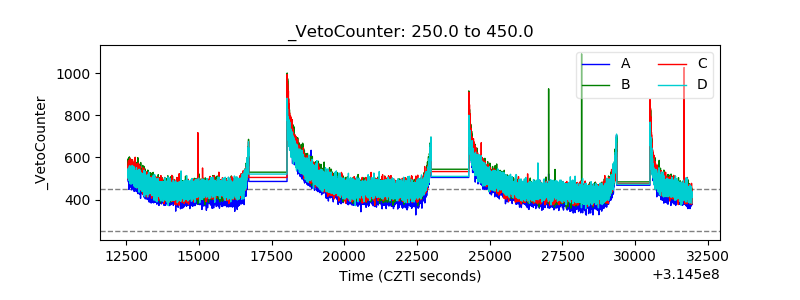 |