| Param | Original file | Final file |
|---|---|---|
| Filename | modeM0/AS1A07_054T01_9000003378_22858cztM0_level2.evt | modeM0/AS1A07_054T01_9000003378_22858cztM0_level2_quad_clean.evt |
| Size (bytes) | 486,809,280 | 137,998,080 |
| Size | 464.3 MB | 131.6 MB |
| Events in quadrant A | 3,432,544 | 952,922 |
| Events in quadrant B | 3,453,305 | 952,570 |
| Events in quadrant C | 3,323,969 | 897,159 |
| Events in quadrant D | 4,054,347 | 886,420 |
| Mode M9 | |||
|---|---|---|---|
| Quadrant | BADHDUFLAG | Total packets | Discarded packets |
| A | 0 | 8 | 0 |
| B | 0 | 8 | 0 |
| C | 0 | 8 | 0 |
| D | 0 | 8 | 0 |
| Mode SS | |||
|---|---|---|---|
| Quadrant | BADHDUFLAG | Total packets | Discarded packets |
| A | 0 | 144 | 0 |
| B | 0 | 144 | 0 |
| C | 0 | 144 | 0 |
| D | 0 | 144 | 0 |
| Mode M0 | |||
|---|---|---|---|
| Quadrant | BADHDUFLAG | Total packets | Discarded packets |
| A | 0 | 14694 | 2 |
| B | 0 | 14658 | 2 |
| C | 0 | 14448 | 3 |
| D | 0 | 16350 | 2 |
| Quadrant | Total seconds | Saturated seconds | Saturation percentage |
|---|---|---|---|
| A | 7042 | 101 | 1.434252% |
| B | 7043 | 122 | 1.732216% |
| C | 7042 | 141 | 2.002272% |
| D | 7042 | 150 | 2.130077% |
Noise dominated data is calculated using 1-second bins in cleaned event files. If a bin has >2000 counts, and if more than 50% of those come from <1% of pixels, then it is considered to be noise-dominated and hence unusable.
| Quadrant | # 1 sec bins | Bins with >0 counts | Bins with >2000 counts | High rate bins dominated by noise | Noise dominated (total time) | Noise dominated (detector-on time) | Marked lightcurve |
|---|---|---|---|---|---|---|---|
| A | 7907 | 7043 | 0 | 0 | 0.00% | 0.00% | 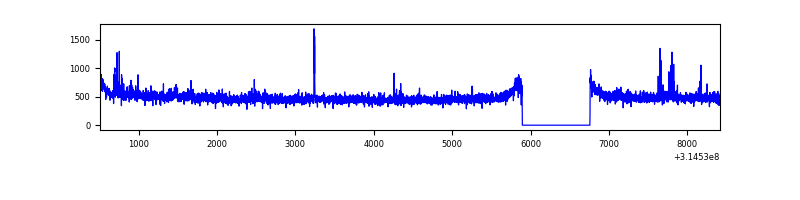 |
| B | 7908 | 7044 | 5 | 5 | 0.06% | 0.07% | 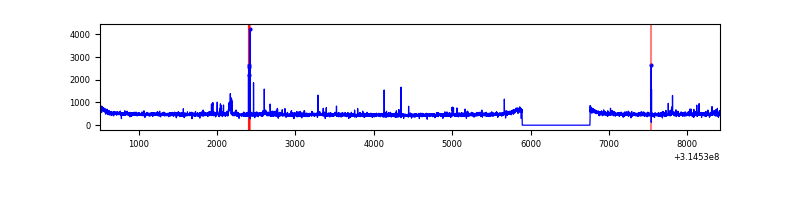 |
| C | 7907 | 7043 | 0 | 0 | 0.00% | 0.00% | 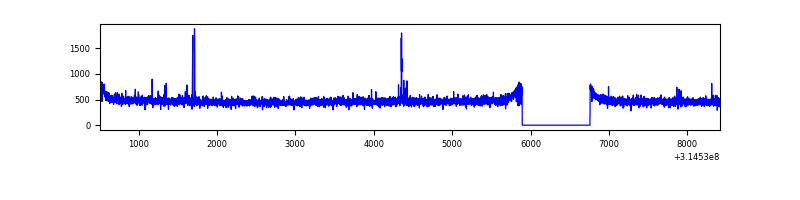 |
| D | 7907 | 7043 | 53 | 53 | 0.67% | 0.75% | 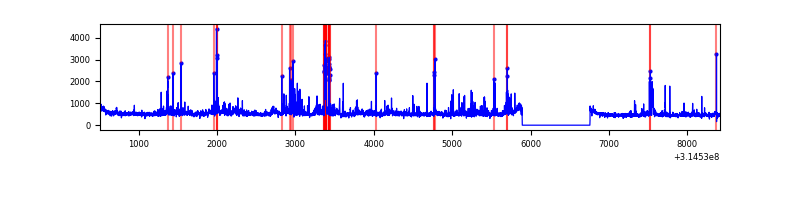 |
Top three noisy pixels from each quadrant. If the there are fewer than three noisy pixels in the level2.evt file, extra rows are filled as -1
| Pixel properties | Quadrant properties | ||||||
|---|---|---|---|---|---|---|---|
| Quadrant | DetID | PixID | Counts | Sigma | Mean | Median | Sigma |
| A | 11 | 47 | 81813 | 470.87 | 858 | 841 | 172.0 |
| A | 13 | 252 | 44952 | 256.52 | 858 | 841 | 172.0 |
| A | 13 | 254 | 11423 | 61.54 | 858 | 841 | 172.0 |
| B | 0 | 190 | 34062 | 208.61 | 847 | 824 | 159.3 |
| B | 0 | 229 | 27745 | 168.96 | 847 | 824 | 159.3 |
| B | 4 | 216 | 21928 | 132.45 | 847 | 824 | 159.3 |
| C | 14 | 238 | 130510 | 702.1 | 807 | 809 | 184.7 |
| C | 10 | 22 | 35880 | 189.84 | 807 | 809 | 184.7 |
| C | 7 | 247 | 7478 | 36.1 | 807 | 809 | 184.7 |
| D | 7 | 238 | 205737 | 1023.97 | 827 | 803 | 200.1 |
| D | 13 | 153 | 181805 | 904.39 | 827 | 803 | 200.1 |
| D | 12 | 227 | 165270 | 821.77 | 827 | 803 | 200.1 |
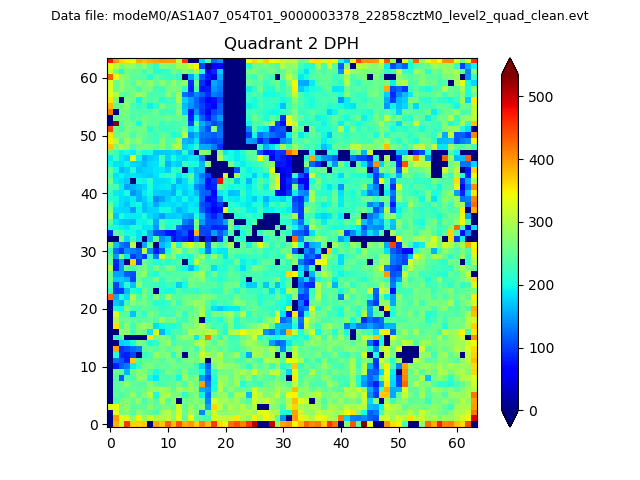
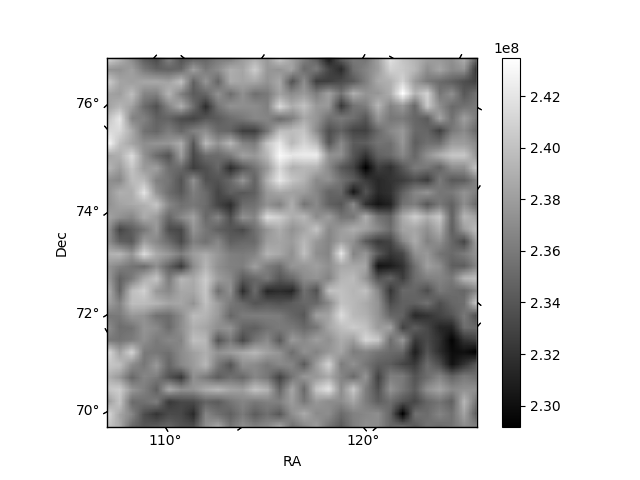
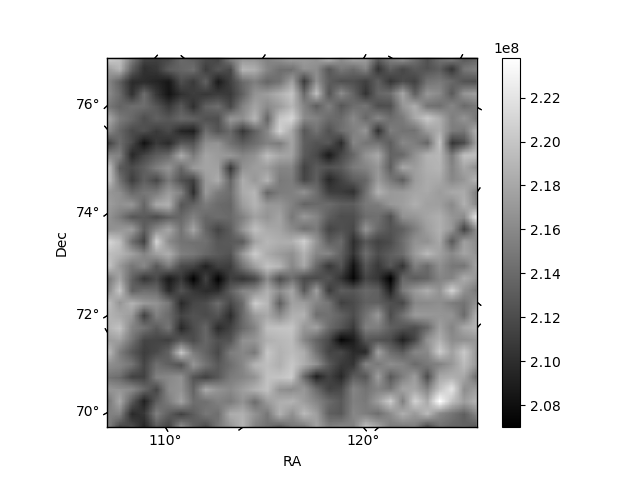
Histogram calculated using DETX and DETY for each event in the final _common_clean file
| Quadrant A | 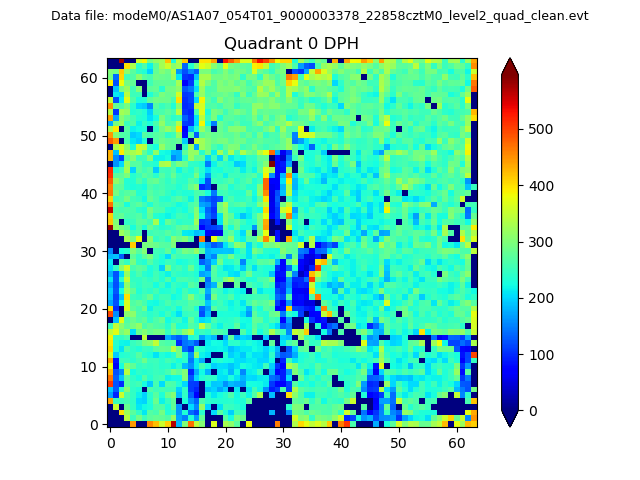 |
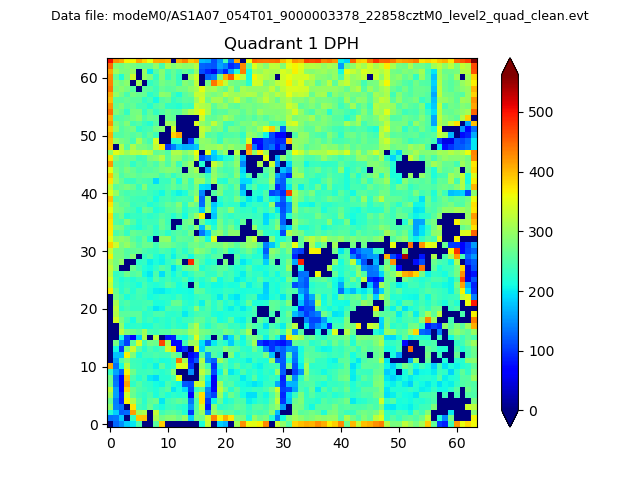 |
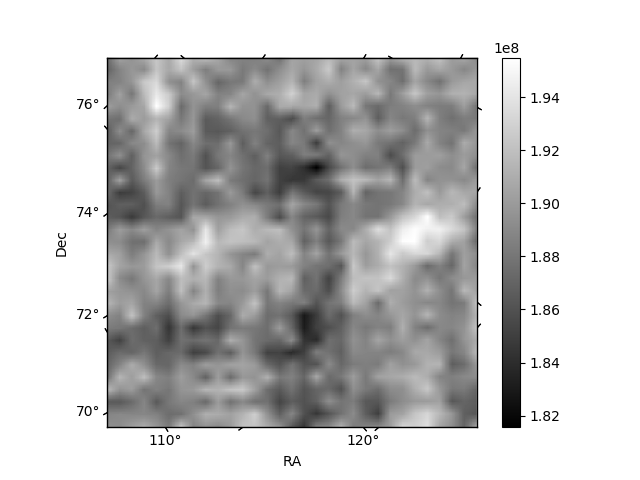
Quadrant B |
|---|---|---|---|
| Quadrant D | 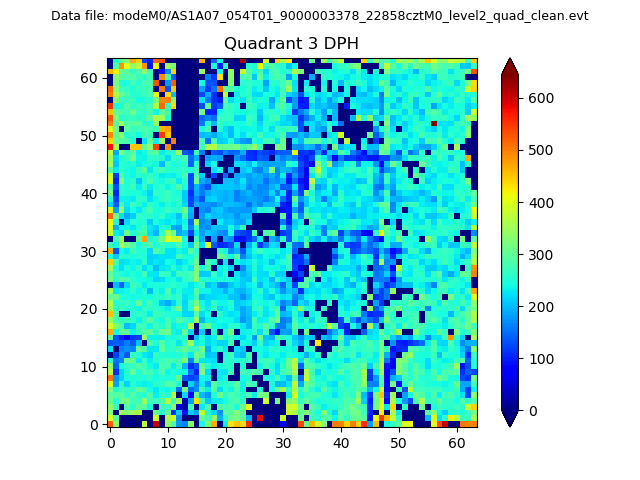 |
 |
Quadrant C |
| Plot type | Count rate plots | Images |
|---|---|---|
| Comparison with Poisson distribution Blue bars denote a histogram of data divided into 1 sec bins. Red curve is a Poisson curve with rate = median count rate of data. |
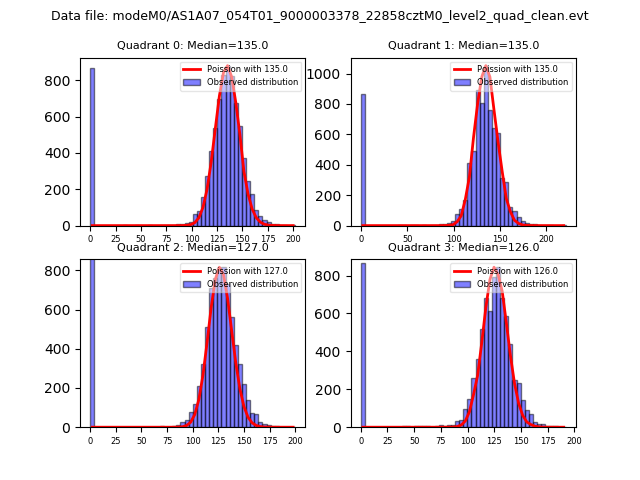 |
 |
| Quadrant-wise count rates Data is divided into 100 sec bins |
 |
|
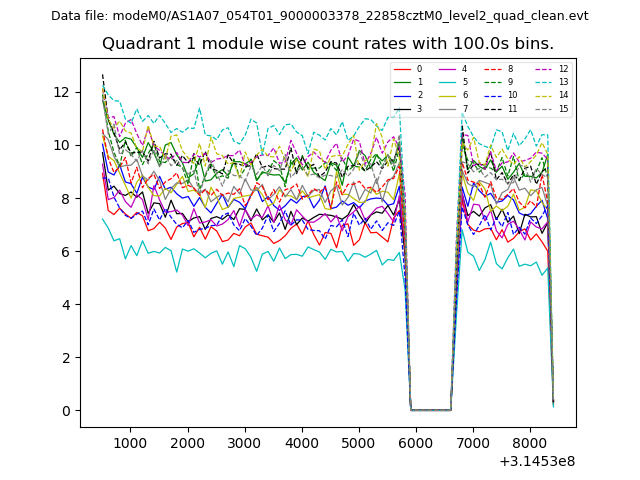
| Module-wise count rates for Quadrant A Data is divided into 100 sec bins |
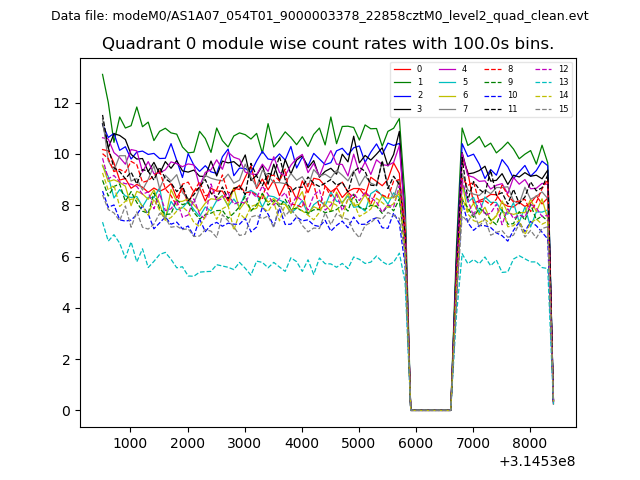 |
 |
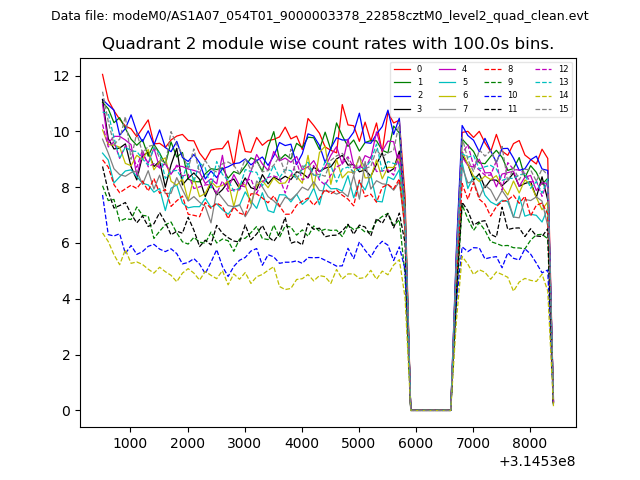
| Module-wise count rates for Quadrant B Data is divided into 100 sec bins |
 |
 |
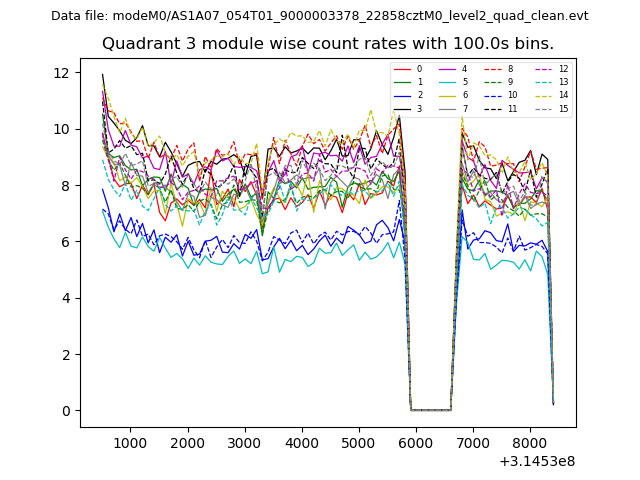
| Module-wise count rates for Quadrant C Data is divided into 100 sec bins |
 |
 |
| Module-wise count rates for Quadrant D Data is divided into 100 sec bins |
 |
 |
| Parameter | Plot |
|---|---|
| CZT HV Monitor |  |
| D_VDD | 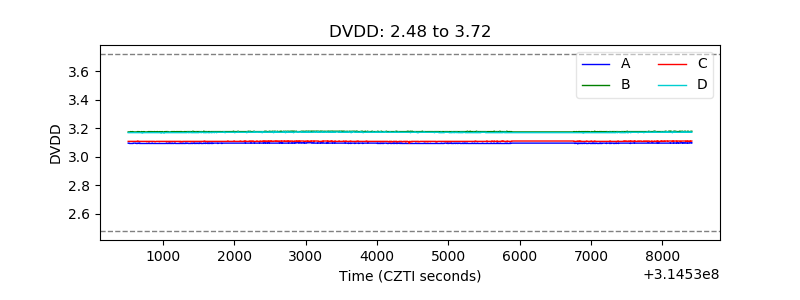 |
| Temperature 1 | 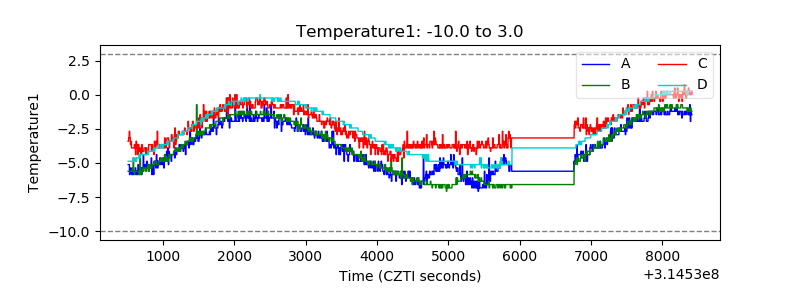 |
| Veto HV Monitor | 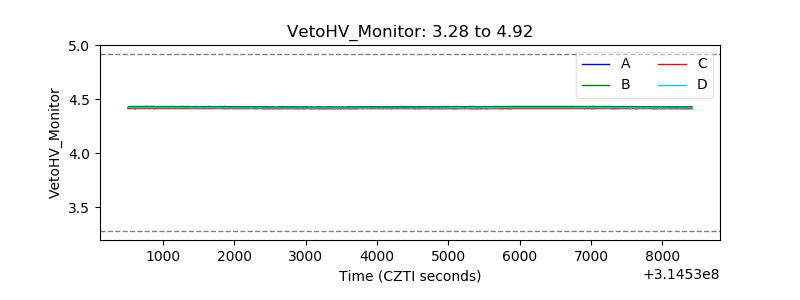 |
| Veto LLD | 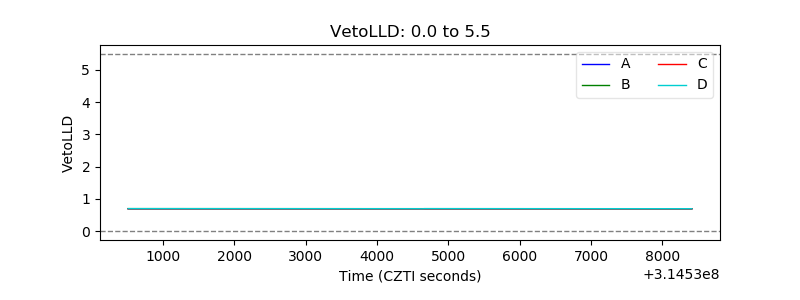 |
| Alpha Counter |  |
| _CPM_Rate | 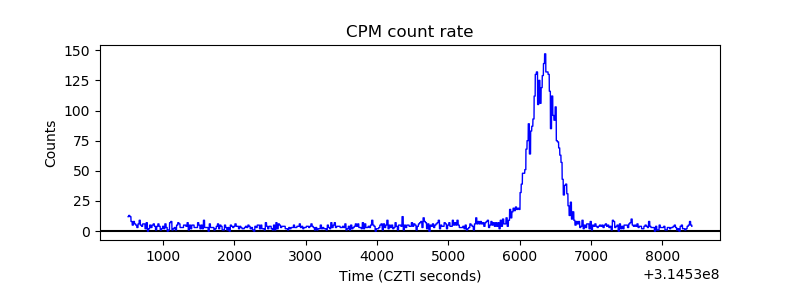 |
| CZT Counter | 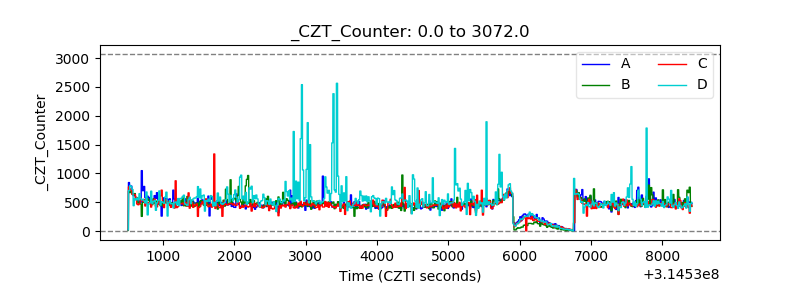 |
| +2.5 Volts monitor |  |
| +5 Volts monitor |  |
| _ROLL_ROT |  |
| _Roll_DEC | 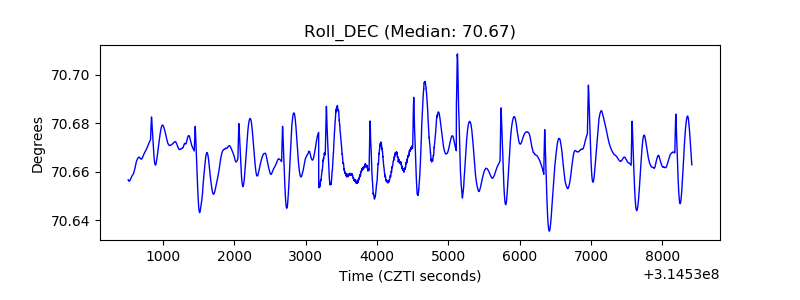 |
| _Roll_RA | 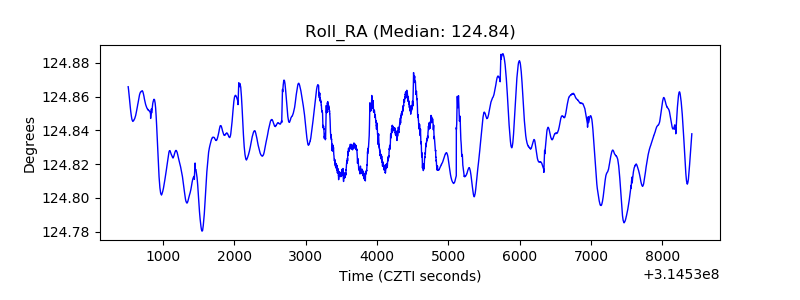 |
| Veto Counter | 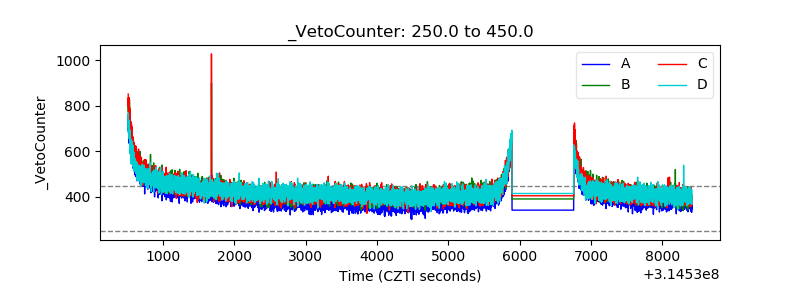 |