| Param | Original file | Final file |
|---|---|---|
| Filename | modeM0/AS1A07_054T01_9000003378_22859cztM0_level2.evt | modeM0/AS1A07_054T01_9000003378_22859cztM0_level2_quad_clean.evt |
| Size (bytes) | 443,776,320 | 124,859,520 |
| Size | 423.2 MB | 119.1 MB |
| Events in quadrant A | 3,147,597 | 858,154 |
| Events in quadrant B | 3,154,397 | 856,343 |
| Events in quadrant C | 3,022,364 | 805,061 |
| Events in quadrant D | 3,666,357 | 801,720 |
| Mode M9 | |||
|---|---|---|---|
| Quadrant | BADHDUFLAG | Total packets | Discarded packets |
| A | 0 | 4 | 0 |
| B | 0 | 4 | 0 |
| C | 0 | 4 | 0 |
| D | 0 | 4 | 0 |
| Mode SS | |||
|---|---|---|---|
| Quadrant | BADHDUFLAG | Total packets | Discarded packets |
| A | 0 | 136 | 0 |
| B | 0 | 136 | 0 |
| C | 0 | 136 | 0 |
| D | 0 | 136 | 0 |
| Mode M0 | |||
|---|---|---|---|
| Quadrant | BADHDUFLAG | Total packets | Discarded packets |
| A | 0 | 13680 | 1 |
| B | 0 | 13613 | 1 |
| C | 0 | 13387 | 1 |
| D | 0 | 15159 | 1 |
| Quadrant | Total seconds | Saturated seconds | Saturation percentage |
|---|---|---|---|
| A | 6597 | 70 | 1.061088% |
| B | 6598 | 82 | 1.242801% |
| C | 6597 | 87 | 1.318781% |
| D | 6597 | 82 | 1.242989% |
Noise dominated data is calculated using 1-second bins in cleaned event files. If a bin has >2000 counts, and if more than 50% of those come from <1% of pixels, then it is considered to be noise-dominated and hence unusable.
| Quadrant | # 1 sec bins | Bins with >0 counts | Bins with >2000 counts | High rate bins dominated by noise | Noise dominated (total time) | Noise dominated (detector-on time) | Marked lightcurve |
|---|---|---|---|---|---|---|---|
| A | 7072 | 6598 | 0 | 0 | 0.00% | 0.00% | 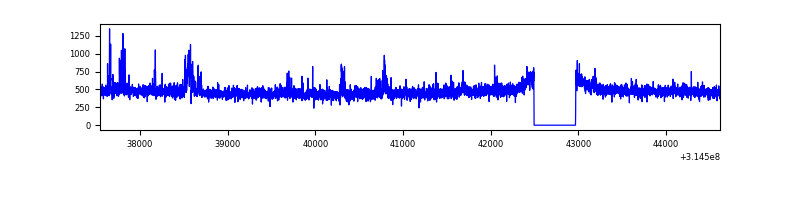 |
| B | 7073 | 6599 | 8 | 8 | 0.11% | 0.12% | 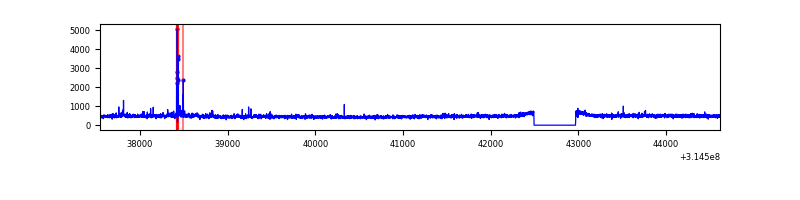 |
| C | 7072 | 6598 | 0 | 0 | 0.00% | 0.00% | 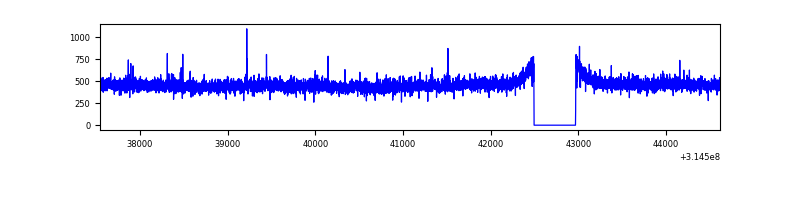 |
| D | 7072 | 6598 | 29 | 29 | 0.41% | 0.44% | 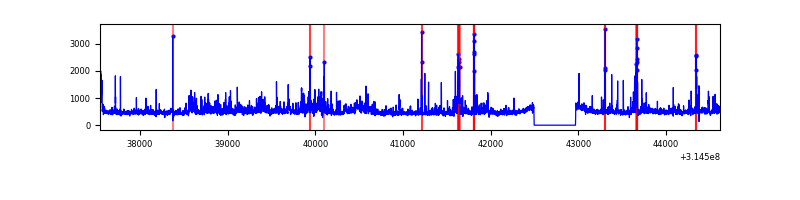 |
Top three noisy pixels from each quadrant. If the there are fewer than three noisy pixels in the level2.evt file, extra rows are filled as -1
| Pixel properties | Quadrant properties | ||||||
|---|---|---|---|---|---|---|---|
| Quadrant | DetID | PixID | Counts | Sigma | Mean | Median | Sigma |
| A | 11 | 47 | 107626 | 674.99 | 785 | 769 | 158.3 |
| A | 13 | 254 | 11075 | 65.1 | 785 | 769 | 158.3 |
| A | 13 | 252 | 9413 | 54.6 | 785 | 769 | 158.3 |
| B | 15 | 33 | 34910 | 233.83 | 776 | 756 | 146.1 |
| B | 0 | 190 | 21034 | 138.83 | 776 | 756 | 146.1 |
| B | 0 | 189 | 20926 | 138.09 | 776 | 756 | 146.1 |
| C | 14 | 238 | 118701 | 685.24 | 741 | 743 | 172.1 |
| C | 7 | 247 | 8553 | 45.37 | 741 | 743 | 172.1 |
| C | 13 | 61 | 5302 | 26.48 | 741 | 743 | 172.1 |
| D | 7 | 238 | 199169 | 1077.39 | 757 | 735 | 184.2 |
| D | 13 | 153 | 192389 | 1040.57 | 757 | 735 | 184.2 |
| D | 10 | 230 | 93423 | 503.24 | 757 | 735 | 184.2 |
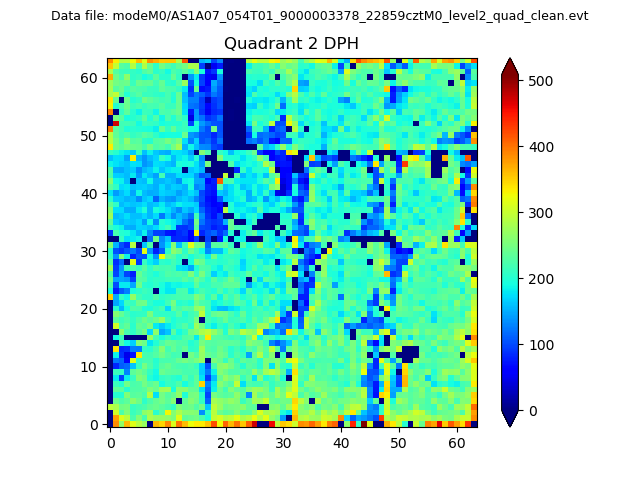
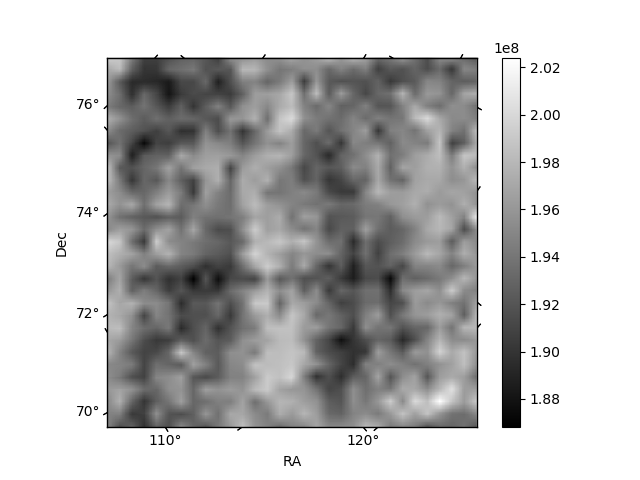
Histogram calculated using DETX and DETY for each event in the final _common_clean file
| Quadrant A | 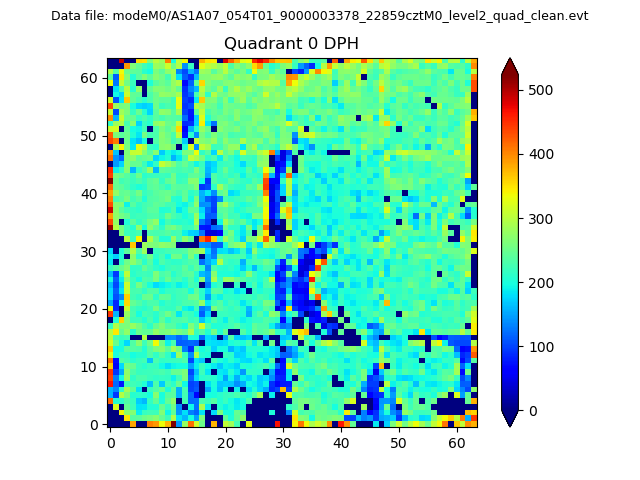 |
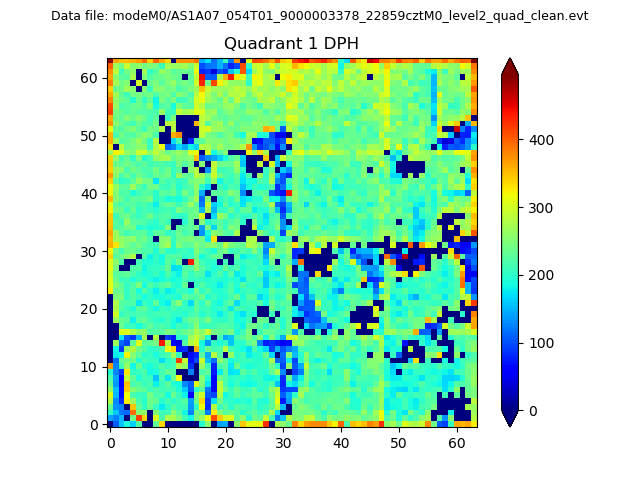 |
Quadrant B |
|---|---|---|---|
| Quadrant D | 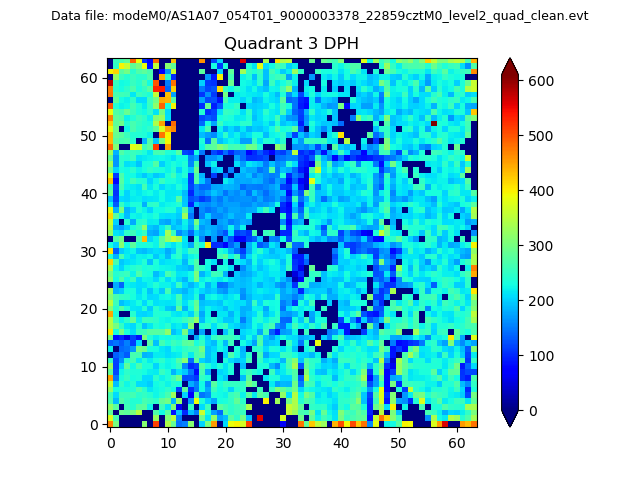 |
 |
Quadrant C |
| Plot type | Count rate plots | Images |
|---|---|---|
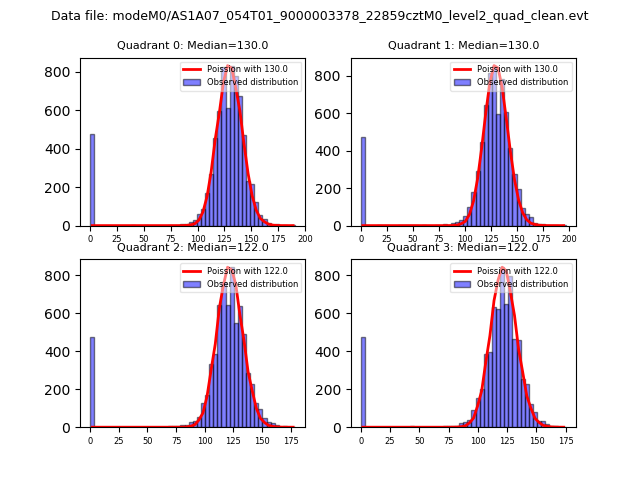
| Comparison with Poisson distribution Blue bars denote a histogram of data divided into 1 sec bins. Red curve is a Poisson curve with rate = median count rate of data. |
 |
 |
| Quadrant-wise count rates Data is divided into 100 sec bins |
 |
|
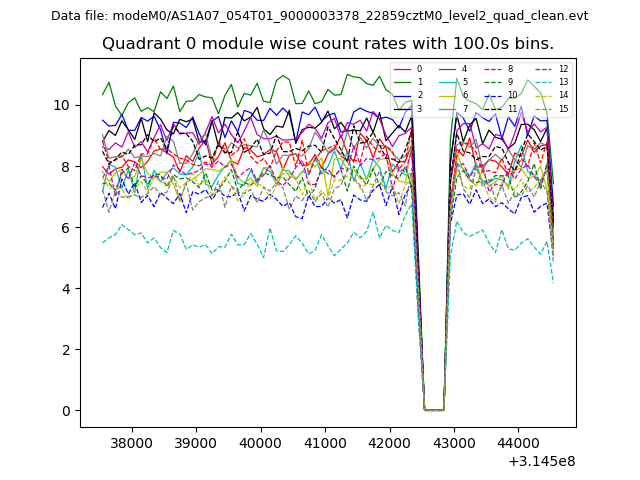
| Module-wise count rates for Quadrant A Data is divided into 100 sec bins |
 |
 |
| Module-wise count rates for Quadrant B Data is divided into 100 sec bins |
 |
 |
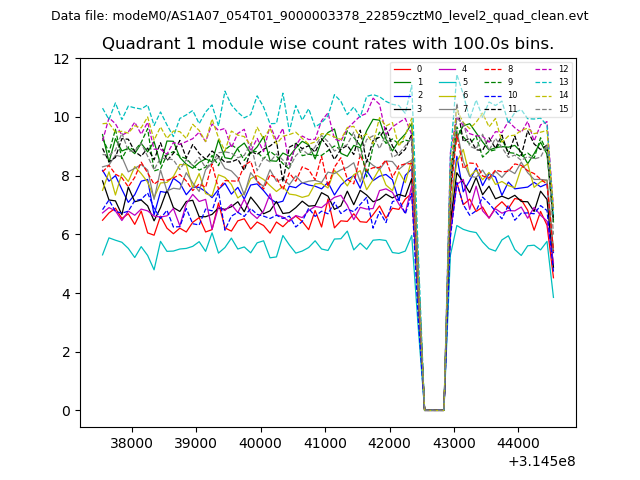
| Module-wise count rates for Quadrant C Data is divided into 100 sec bins |
 |
 |
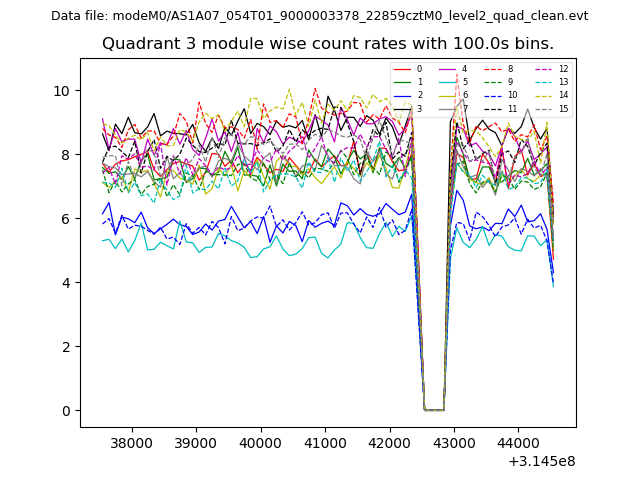
| Module-wise count rates for Quadrant D Data is divided into 100 sec bins |
 |
 |
| Parameter | Plot |
|---|---|
| CZT HV Monitor |  |
| D_VDD | 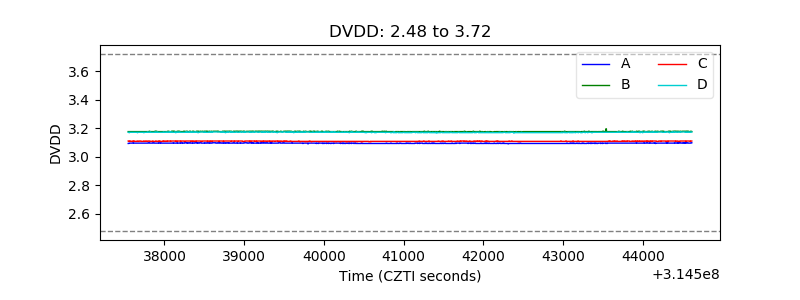 |
| Temperature 1 | 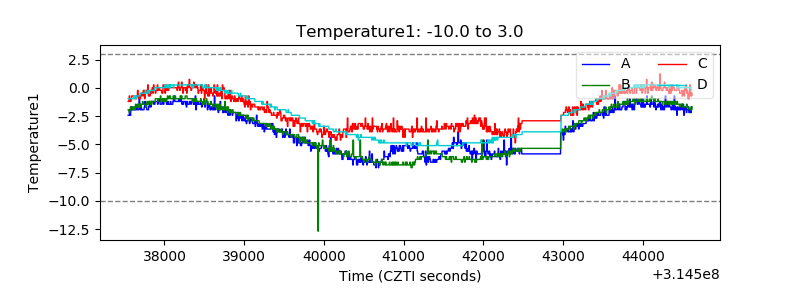 |
| Veto HV Monitor | 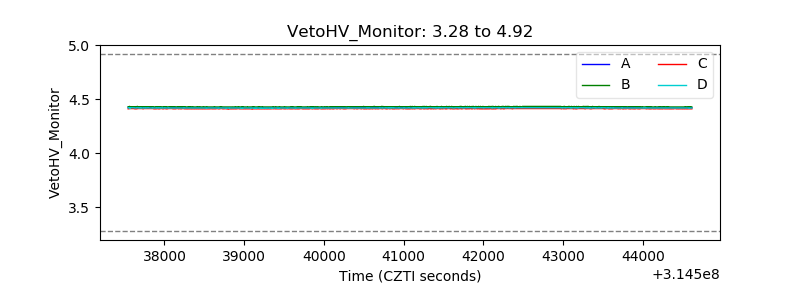 |
| Veto LLD | 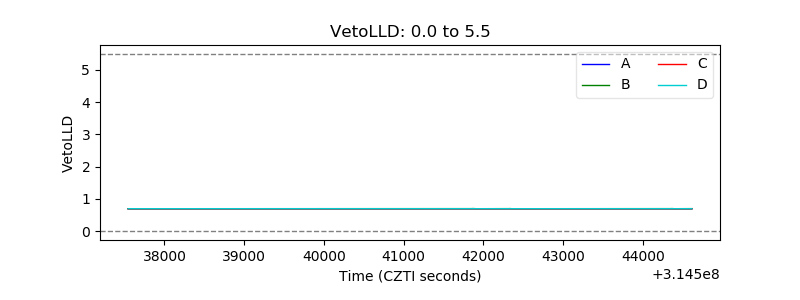 |
| Alpha Counter | 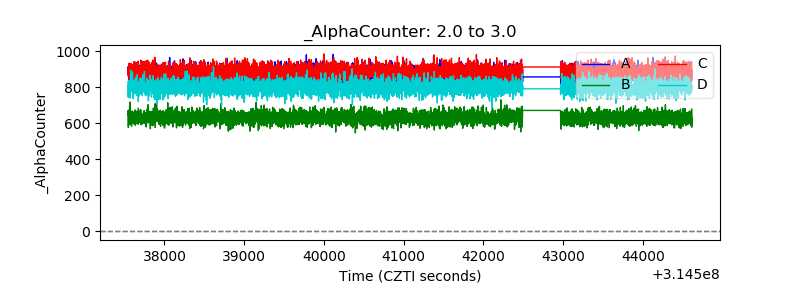 |
| _CPM_Rate | 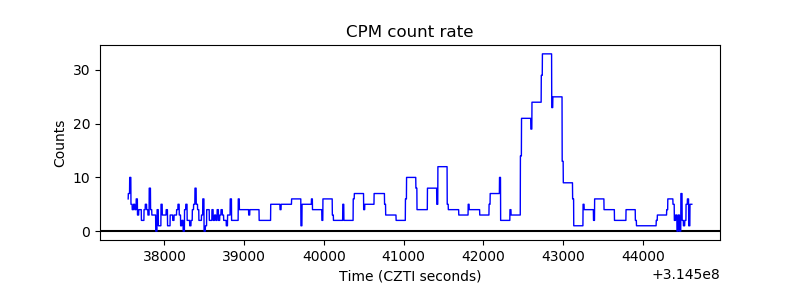 |
| CZT Counter | 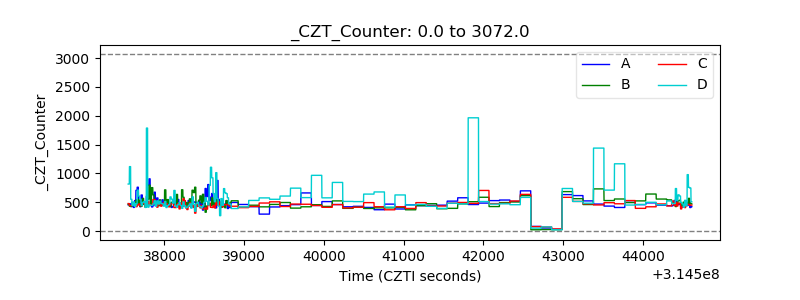 |
| +2.5 Volts monitor | 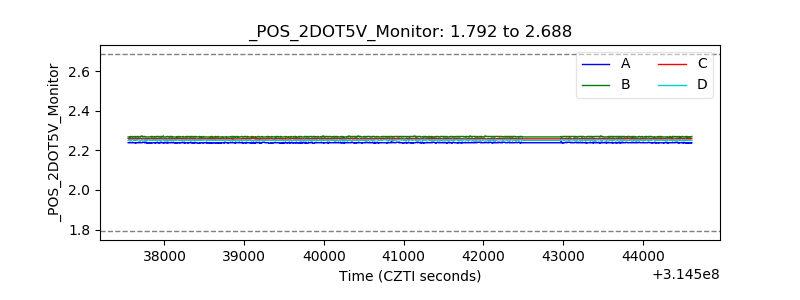 |
| +5 Volts monitor |  |
| _ROLL_ROT | 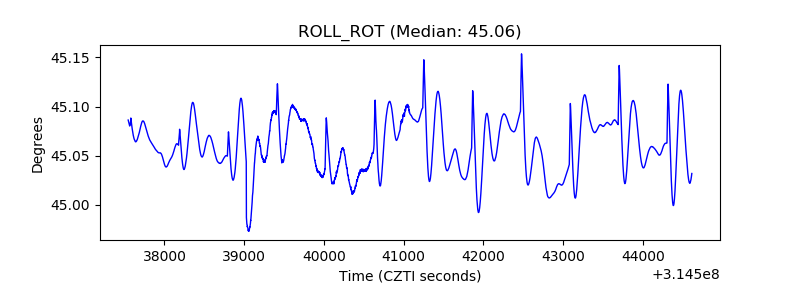 |
| _Roll_DEC | 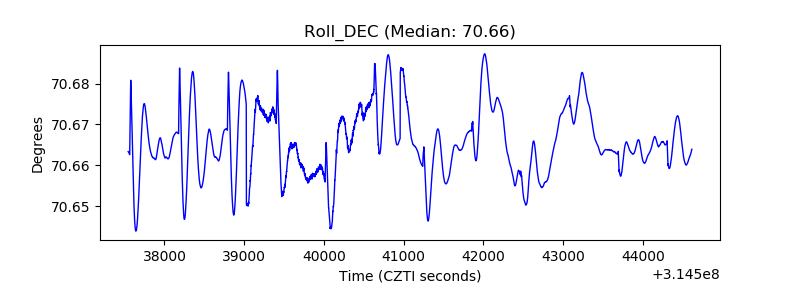 |
| _Roll_RA | 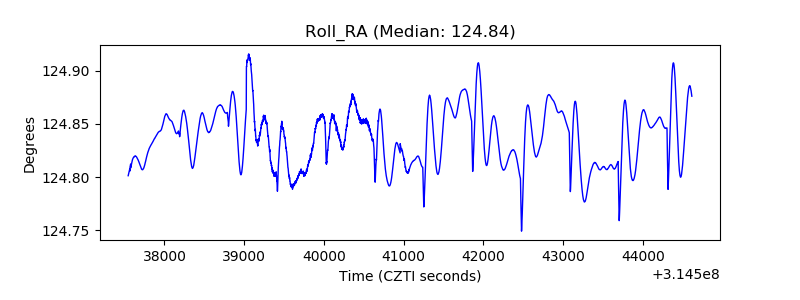 |
| Veto Counter | 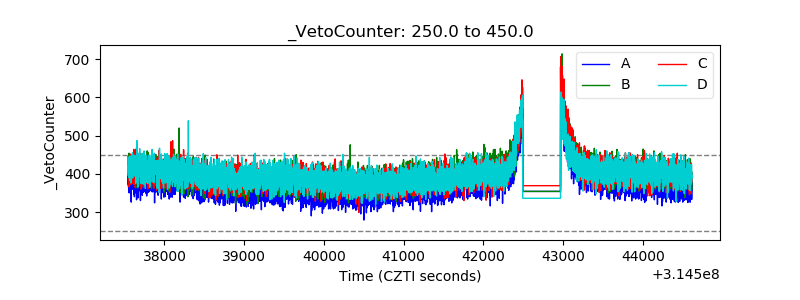 |