| Param | Original file | Final file |
|---|---|---|
| Filename | modeM0/AS1A07_054T01_9000003378_22860cztM0_level2.evt | modeM0/AS1A07_054T01_9000003378_22860cztM0_level2_quad_clean.evt |
| Size (bytes) | 483,785,280 | 127,722,240 |
| Size | 461.4 MB | 121.8 MB |
| Events in quadrant A | 3,390,663 | 875,407 |
| Events in quadrant B | 3,267,825 | 876,682 |
| Events in quadrant C | 3,155,398 | 825,273 |
| Events in quadrant D | 4,373,368 | 814,807 |
| Mode M9 | |||
|---|---|---|---|
| Quadrant | BADHDUFLAG | Total packets | Discarded packets |
| A | 0 | 2 | 0 |
| B | 0 | 2 | 0 |
| C | 0 | 2 | 0 |
| D | 0 | 2 | 0 |
| Mode SS | |||
|---|---|---|---|
| Quadrant | BADHDUFLAG | Total packets | Discarded packets |
| A | 0 | 140 | 0 |
| B | 0 | 140 | 0 |
| C | 0 | 140 | 0 |
| D | 0 | 140 | 0 |
| Mode M0 | |||
|---|---|---|---|
| Quadrant | BADHDUFLAG | Total packets | Discarded packets |
| A | 0 | 14696 | 1 |
| B | 0 | 14129 | 1 |
| C | 0 | 13950 | 1 |
| D | 0 | 17517 | 1 |
| Quadrant | Total seconds | Saturated seconds | Saturation percentage |
|---|---|---|---|
| A | 6829 | 85 | 1.244692% |
| B | 6829 | 65 | 0.951823% |
| C | 6829 | 114 | 1.669351% |
| D | 6829 | 223 | 3.265485% |
Noise dominated data is calculated using 1-second bins in cleaned event files. If a bin has >2000 counts, and if more than 50% of those come from <1% of pixels, then it is considered to be noise-dominated and hence unusable.
| Quadrant | # 1 sec bins | Bins with >0 counts | Bins with >2000 counts | High rate bins dominated by noise | Noise dominated (total time) | Noise dominated (detector-on time) | Marked lightcurve |
|---|---|---|---|---|---|---|---|
| A | 7069 | 6830 | 2 | 2 | 0.03% | 0.03% | 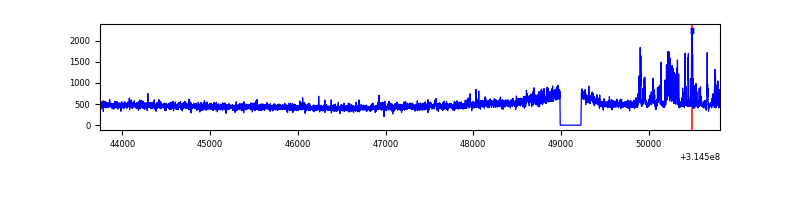 |
| B | 7069 | 6830 | 0 | 0 | 0.00% | 0.00% | 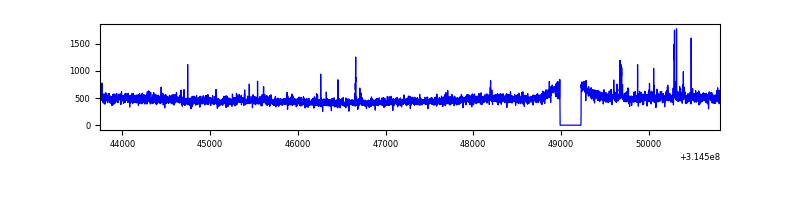 |
| C | 7069 | 6830 | 0 | 0 | 0.00% | 0.00% | 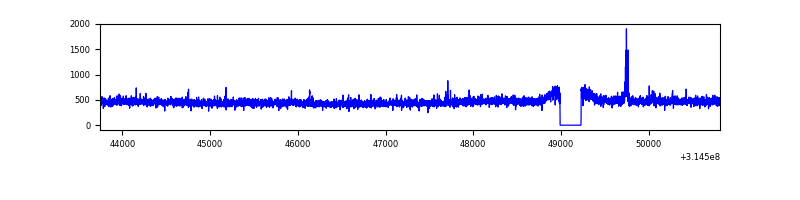 |
| D | 7069 | 6830 | 132 | 132 | 1.87% | 1.93% | 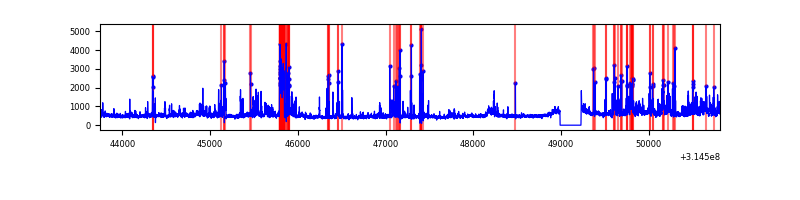 |
Top three noisy pixels from each quadrant. If the there are fewer than three noisy pixels in the level2.evt file, extra rows are filled as -1
| Pixel properties | Quadrant properties | ||||||
|---|---|---|---|---|---|---|---|
| Quadrant | DetID | PixID | Counts | Sigma | Mean | Median | Sigma |
| A | 11 | 47 | 183129 | 1112.56 | 812 | 794 | 163.9 |
| A | 13 | 252 | 68764 | 414.74 | 812 | 794 | 163.9 |
| A | 13 | 254 | 11564 | 65.72 | 812 | 794 | 163.9 |
| B | 0 | 189 | 31703 | 201.84 | 805 | 783 | 153.2 |
| B | 0 | 190 | 28682 | 182.12 | 805 | 783 | 153.2 |
| B | 0 | 228 | 24941 | 157.7 | 805 | 783 | 153.2 |
| C | 14 | 238 | 123670 | 683.38 | 769 | 771 | 179.8 |
| C | 0 | 207 | 19485 | 104.06 | 769 | 771 | 179.8 |
| C | 7 | 247 | 9792 | 50.16 | 769 | 771 | 179.8 |
| D | 7 | 238 | 552321 | 2897.43 | 780 | 755 | 190.4 |
| D | 1 | 239 | 180768 | 945.63 | 780 | 755 | 190.4 |
| D | 2 | 152 | 173741 | 908.71 | 780 | 755 | 190.4 |
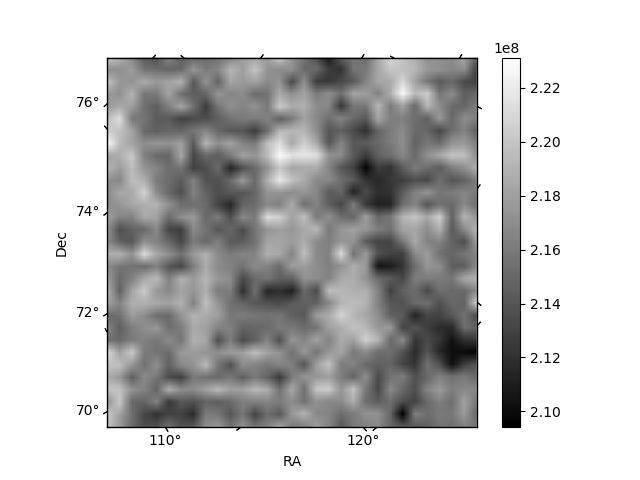
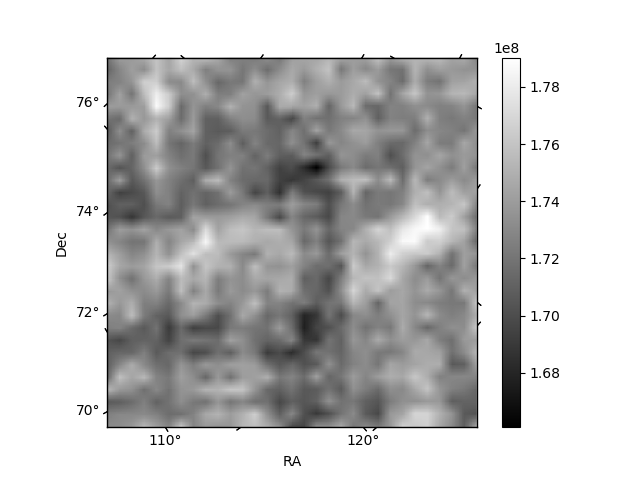
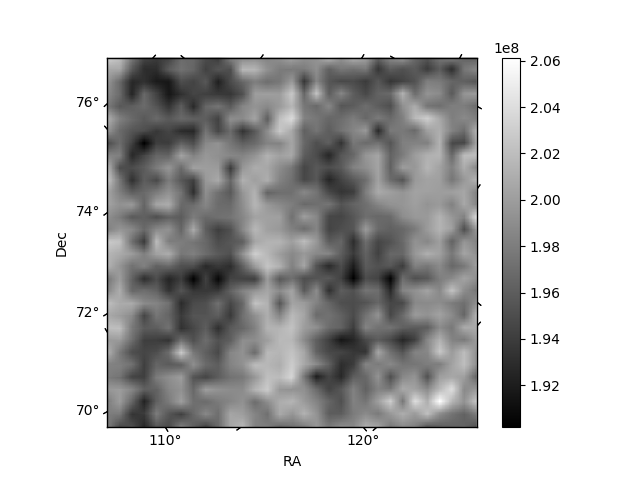
Histogram calculated using DETX and DETY for each event in the final _common_clean file
| Quadrant A | 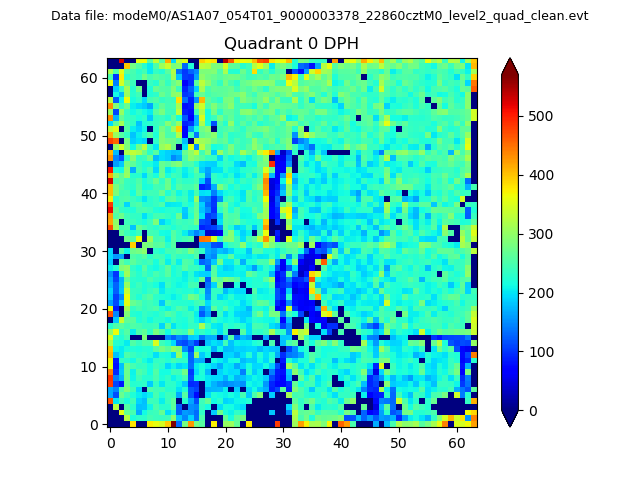 |
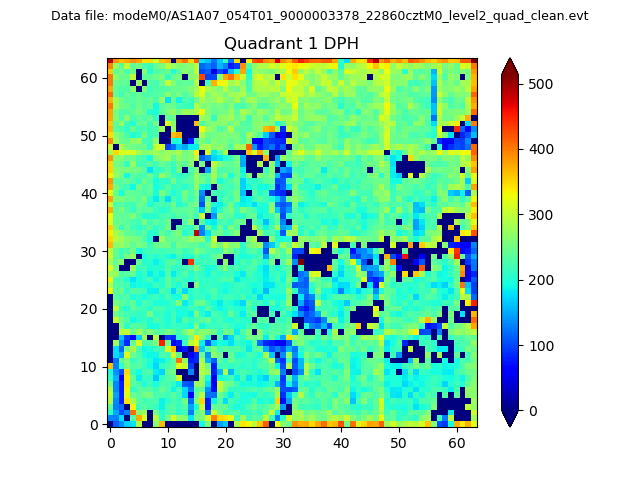 |
Quadrant B |
|---|---|---|---|
| Quadrant D | 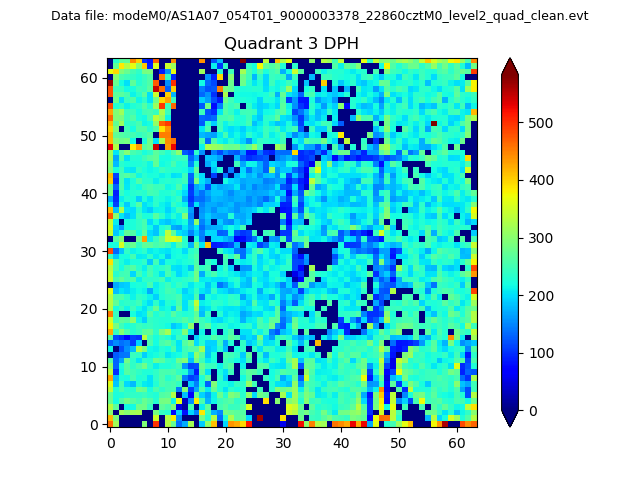 |
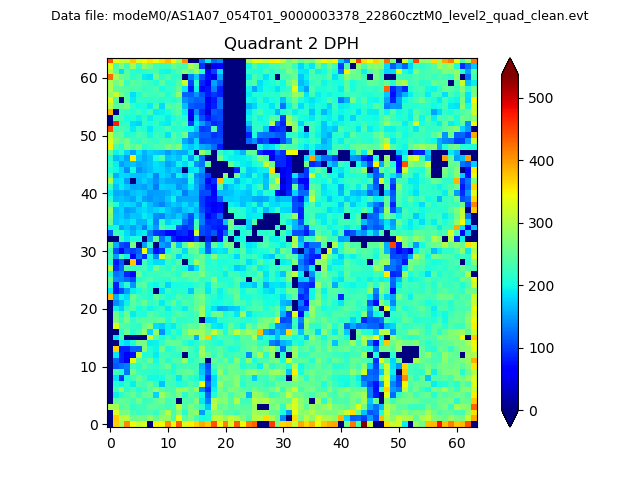 |
Quadrant C |
| Plot type | Count rate plots | Images |
|---|---|---|
| Comparison with Poisson distribution Blue bars denote a histogram of data divided into 1 sec bins. Red curve is a Poisson curve with rate = median count rate of data. |
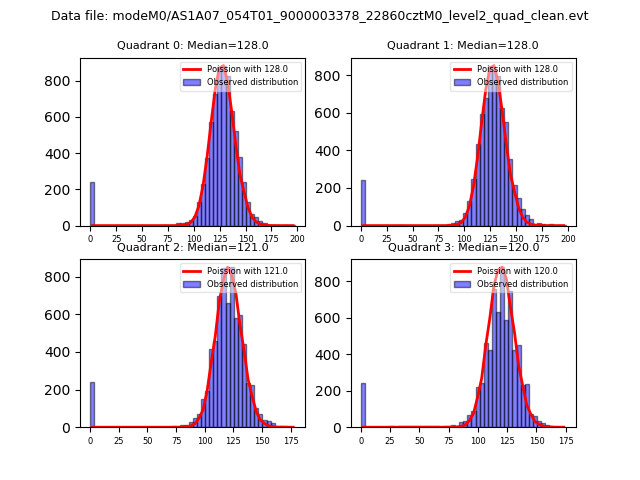 |
 |
| Quadrant-wise count rates Data is divided into 100 sec bins |
 |
|
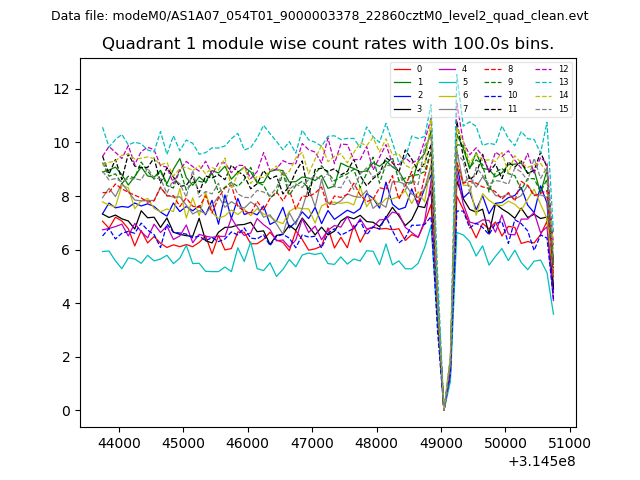
| Module-wise count rates for Quadrant A Data is divided into 100 sec bins |
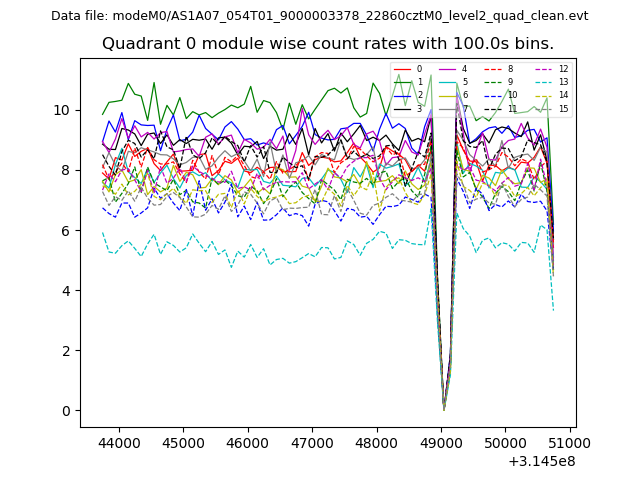 |
 |
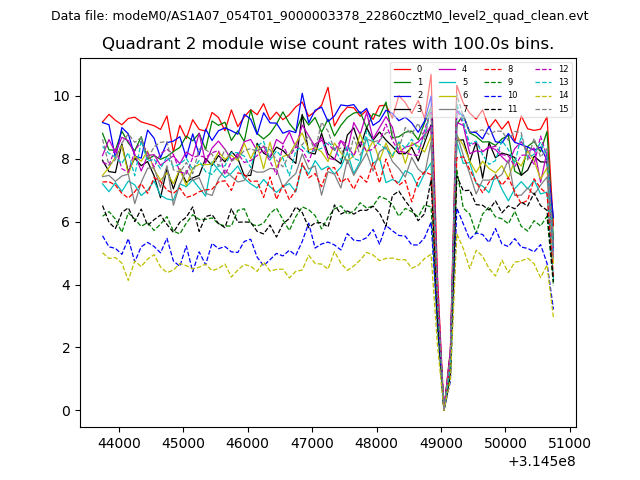
| Module-wise count rates for Quadrant B Data is divided into 100 sec bins |
 |
 |
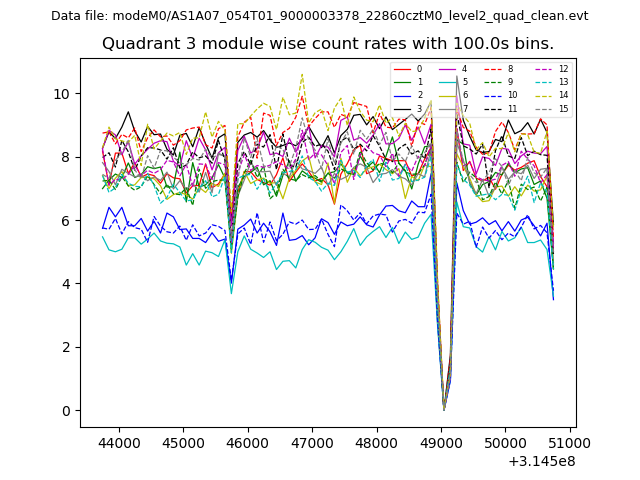
| Module-wise count rates for Quadrant C Data is divided into 100 sec bins |
 |
 |
| Module-wise count rates for Quadrant D Data is divided into 100 sec bins |
 |
 |
| Parameter | Plot |
|---|---|
| CZT HV Monitor | 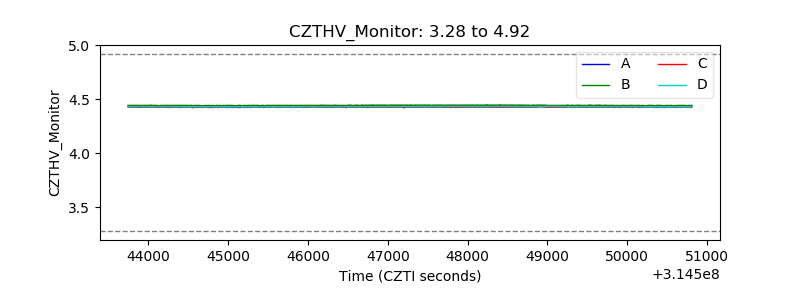 |
| D_VDD | 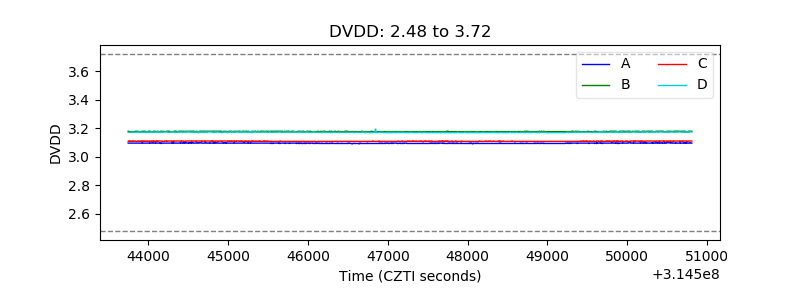 |
| Temperature 1 | 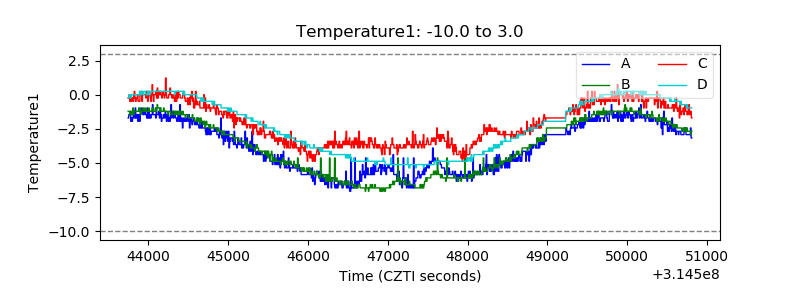 |
| Veto HV Monitor | 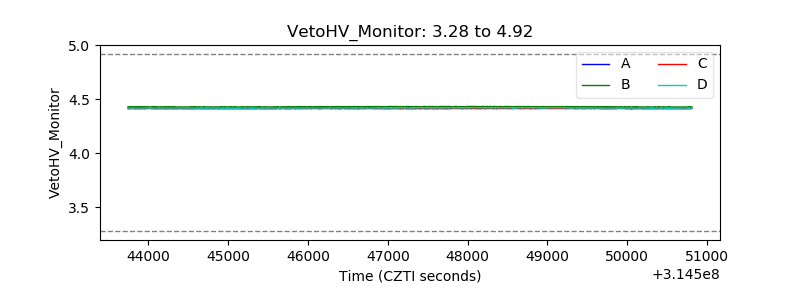 |
| Veto LLD | 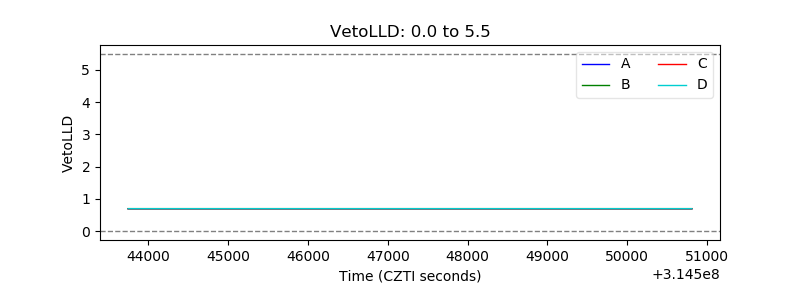 |
| Alpha Counter |  |
| _CPM_Rate | 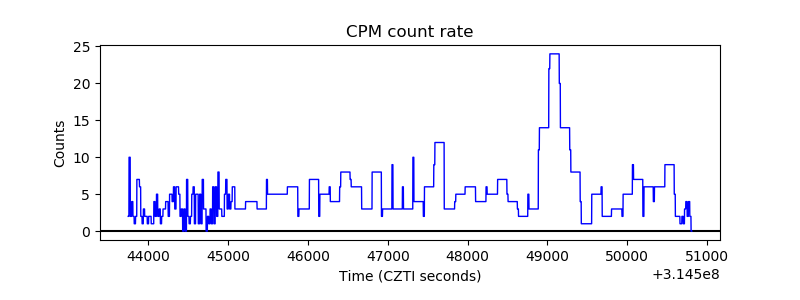 |
| CZT Counter | 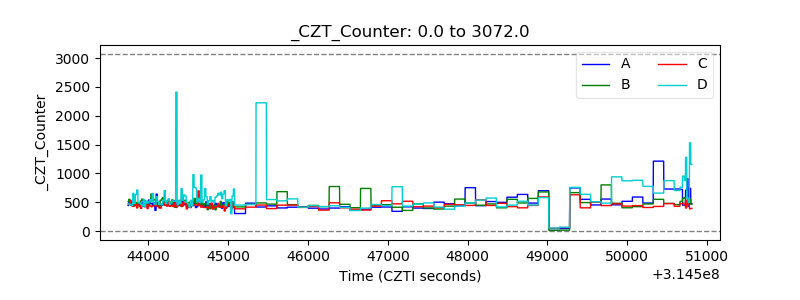 |
| +2.5 Volts monitor |  |
| +5 Volts monitor |  |
| _ROLL_ROT | 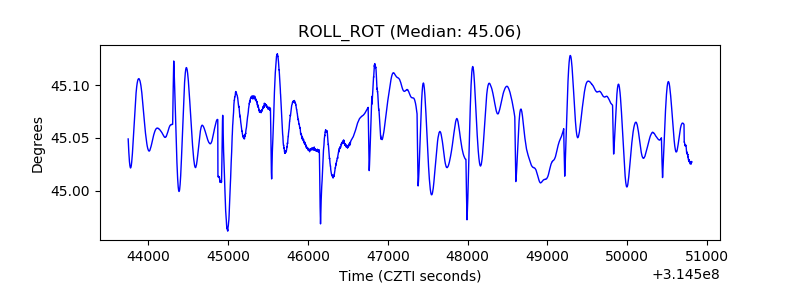 |
| _Roll_DEC | 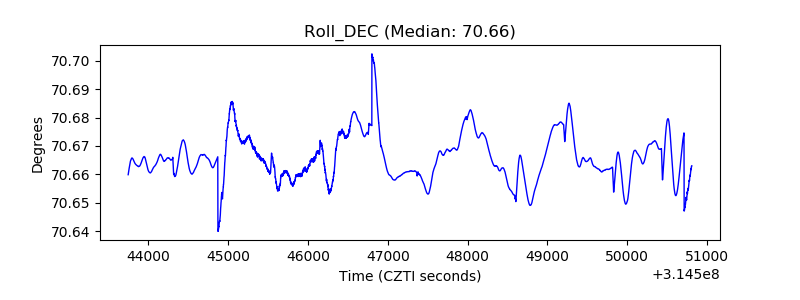 |
| _Roll_RA | 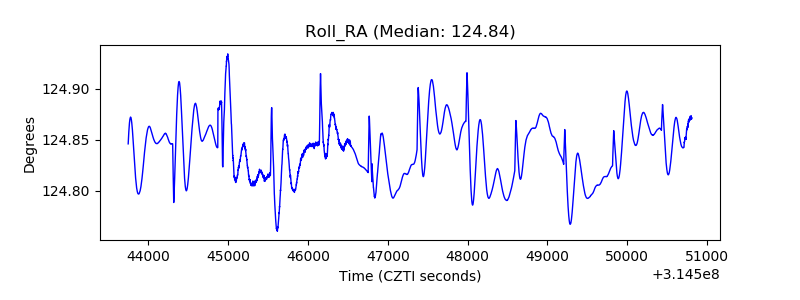 |
| Veto Counter | 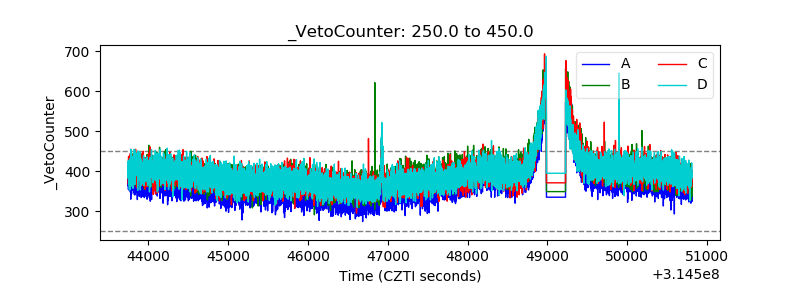 |