| Param | Original file | Final file |
|---|---|---|
| Filename | modeM0/AS1A07_054T01_9000003378_22861cztM0_level2.evt | modeM0/AS1A07_054T01_9000003378_22861cztM0_level2_quad_clean.evt |
| Size (bytes) | 511,908,480 | 126,622,080 |
| Size | 488.2 MB | 120.8 MB |
| Events in quadrant A | 3,566,911 | 870,166 |
| Events in quadrant B | 3,310,600 | 869,090 |
| Events in quadrant C | 3,143,336 | 821,333 |
| Events in quadrant D | 5,018,211 | 797,882 |
| Mode M9 | |||
|---|---|---|---|
| Quadrant | BADHDUFLAG | Total packets | Discarded packets |
| A | 0 | 3 | 0 |
| B | 0 | 3 | 0 |
| C | 0 | 3 | 0 |
| D | 0 | 3 | 0 |
| Mode SS | |||
|---|---|---|---|
| Quadrant | BADHDUFLAG | Total packets | Discarded packets |
| A | 0 | 140 | 0 |
| B | 0 | 140 | 0 |
| C | 0 | 140 | 0 |
| D | 0 | 140 | 0 |
| Mode M0 | |||
|---|---|---|---|
| Quadrant | BADHDUFLAG | Total packets | Discarded packets |
| A | 0 | 15062 | 1 |
| B | 0 | 14282 | 2 |
| C | 0 | 13870 | 1 |
| D | 0 | 19553 | 1 |
| Quadrant | Total seconds | Saturated seconds | Saturation percentage |
|---|---|---|---|
| A | 6834 | 34 | 0.497512% |
| B | 6834 | 35 | 0.512145% |
| C | 6834 | 75 | 1.097454% |
| D | 6834 | 405 | 5.926251% |
Noise dominated data is calculated using 1-second bins in cleaned event files. If a bin has >2000 counts, and if more than 50% of those come from <1% of pixels, then it is considered to be noise-dominated and hence unusable.
| Quadrant | # 1 sec bins | Bins with >0 counts | Bins with >2000 counts | High rate bins dominated by noise | Noise dominated (total time) | Noise dominated (detector-on time) | Marked lightcurve |
|---|---|---|---|---|---|---|---|
| A | 7224 | 6835 | 11 | 11 | 0.15% | 0.16% | 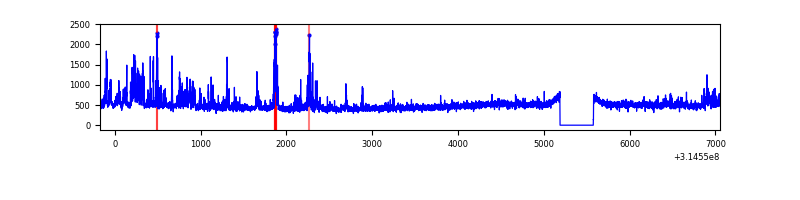 |
| B | 7224 | 6835 | 0 | 0 | 0.00% | 0.00% | 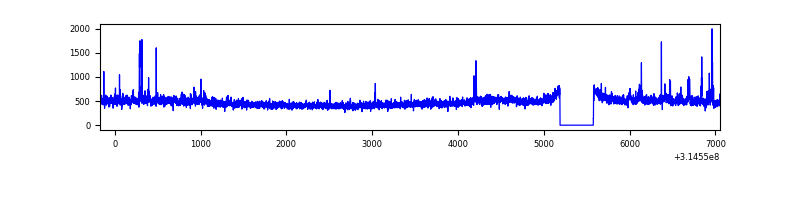 |
| C | 7224 | 6835 | 0 | 0 | 0.00% | 0.00% | 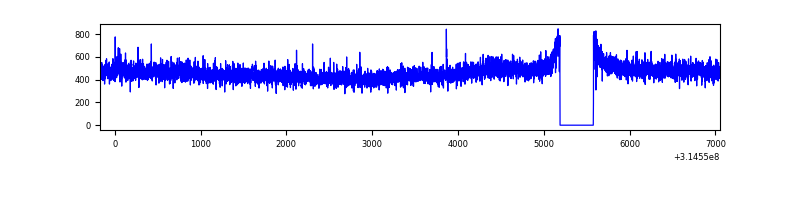 |
| D | 7224 | 6835 | 261 | 261 | 3.61% | 3.82% | 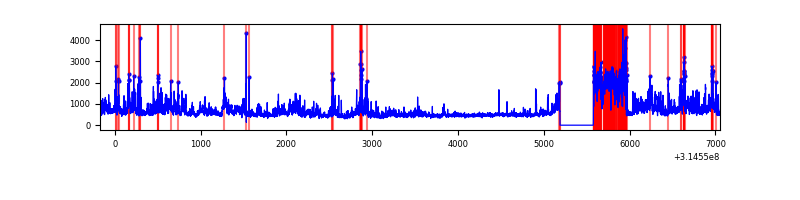 |
Top three noisy pixels from each quadrant. If the there are fewer than three noisy pixels in the level2.evt file, extra rows are filled as -1
| Pixel properties | Quadrant properties | ||||||
|---|---|---|---|---|---|---|---|
| Quadrant | DetID | PixID | Counts | Sigma | Mean | Median | Sigma |
| A | 11 | 47 | 427098 | 2602.59 | 810 | 793 | 163.8 |
| A | 13 | 254 | 11629 | 66.15 | 810 | 793 | 163.8 |
| A | 13 | 252 | 7680 | 42.05 | 810 | 793 | 163.8 |
| B | 0 | 189 | 58340 | 377.65 | 802 | 782 | 152.4 |
| B | 0 | 190 | 46218 | 298.11 | 802 | 782 | 152.4 |
| B | 0 | 228 | 30874 | 197.44 | 802 | 782 | 152.4 |
| C | 14 | 238 | 120933 | 666.07 | 771 | 772 | 180.4 |
| C | 7 | 247 | 12359 | 64.23 | 771 | 772 | 180.4 |
| C | 13 | 61 | 5341 | 25.33 | 771 | 772 | 180.4 |
| D | 7 | 238 | 1384546 | 7404.65 | 768 | 746 | 186.9 |
| D | 2 | 152 | 197652 | 1053.63 | 768 | 746 | 186.9 |
| D | 1 | 239 | 165082 | 879.35 | 768 | 746 | 186.9 |
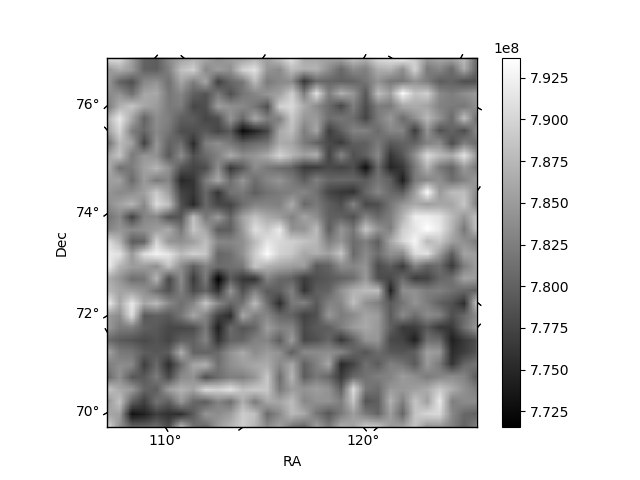
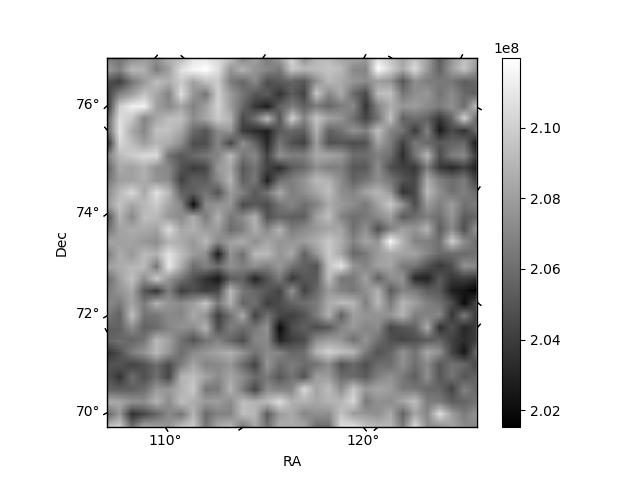
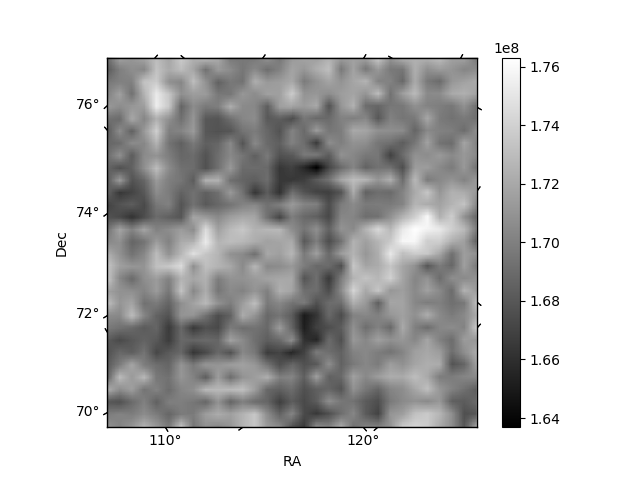
Histogram calculated using DETX and DETY for each event in the final _common_clean file
| Quadrant A | 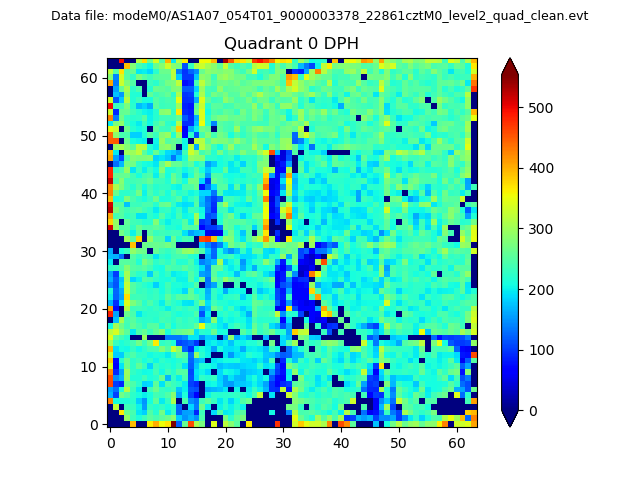 |
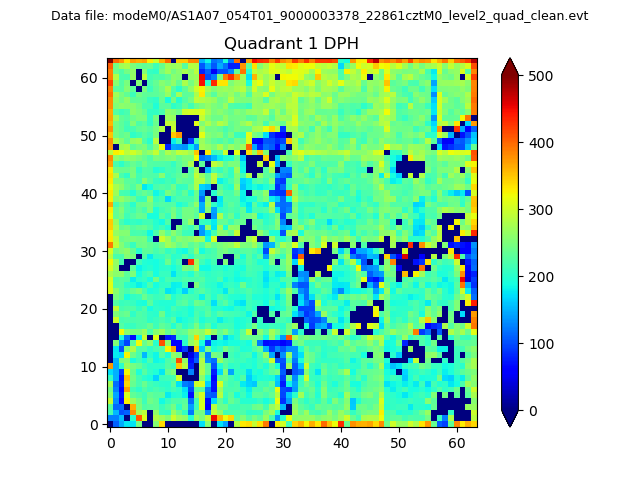 |
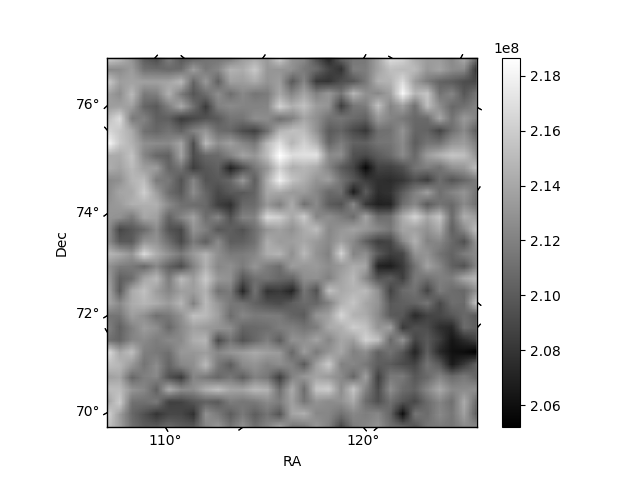
Quadrant B |
|---|---|---|---|
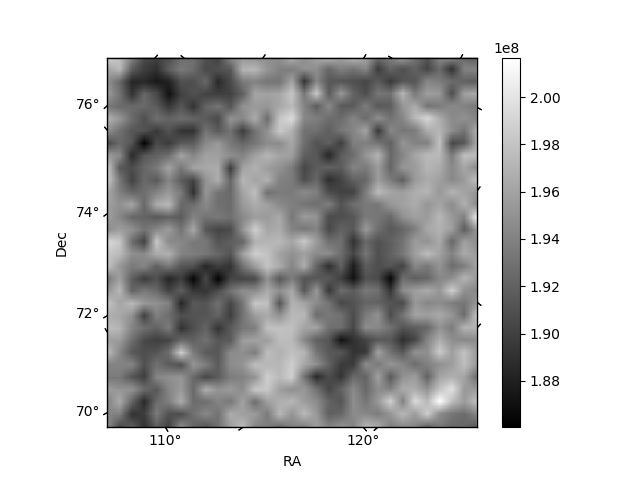
| Quadrant D | 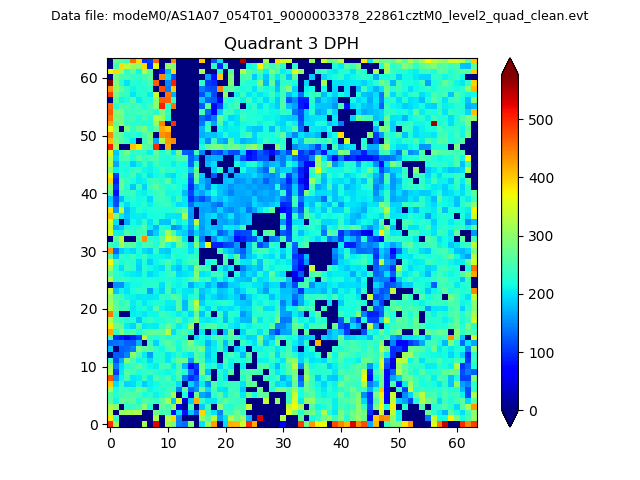 |
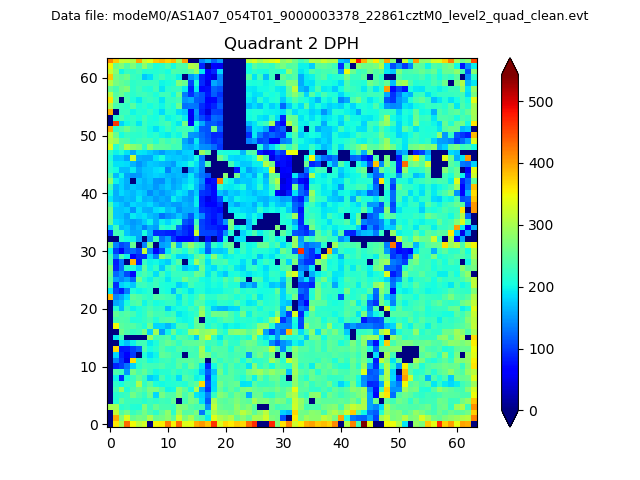 |
Quadrant C |
| Plot type | Count rate plots | Images |
|---|---|---|
| Comparison with Poisson distribution Blue bars denote a histogram of data divided into 1 sec bins. Red curve is a Poisson curve with rate = median count rate of data. |
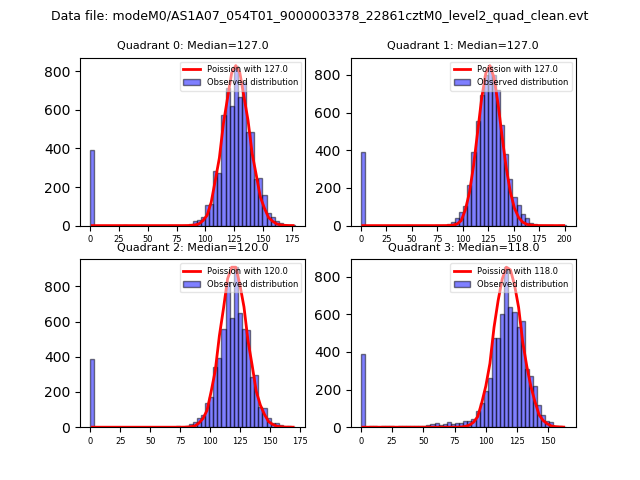 |
 |
| Quadrant-wise count rates Data is divided into 100 sec bins |
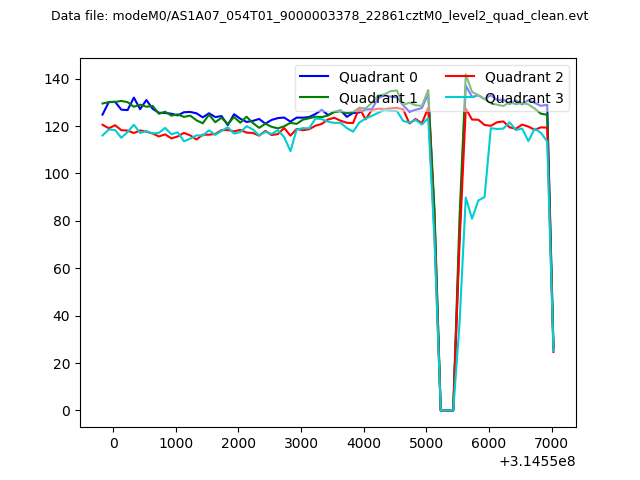 |
|
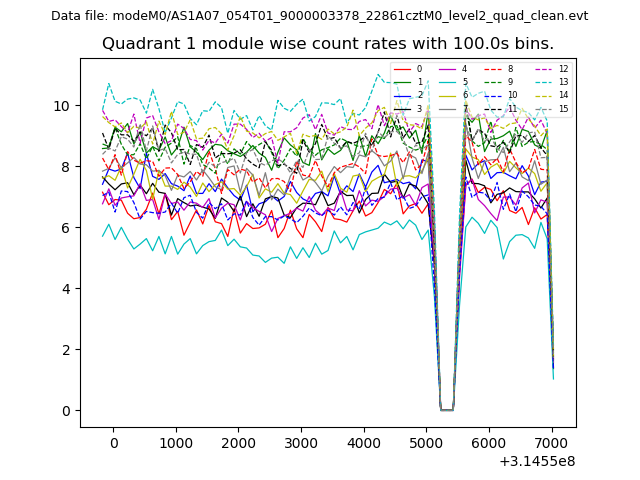
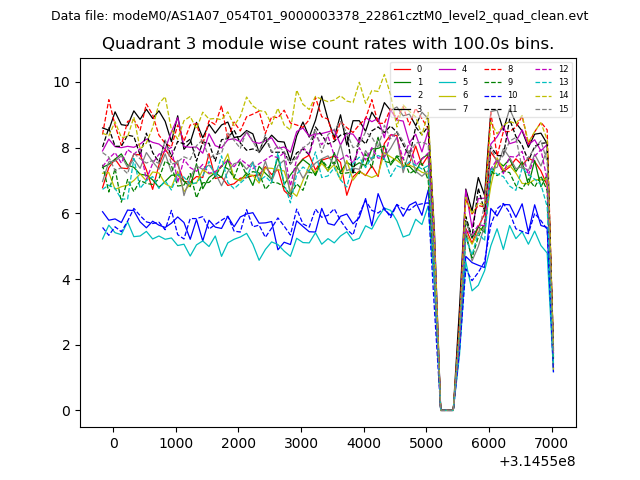
| Module-wise count rates for Quadrant A Data is divided into 100 sec bins |
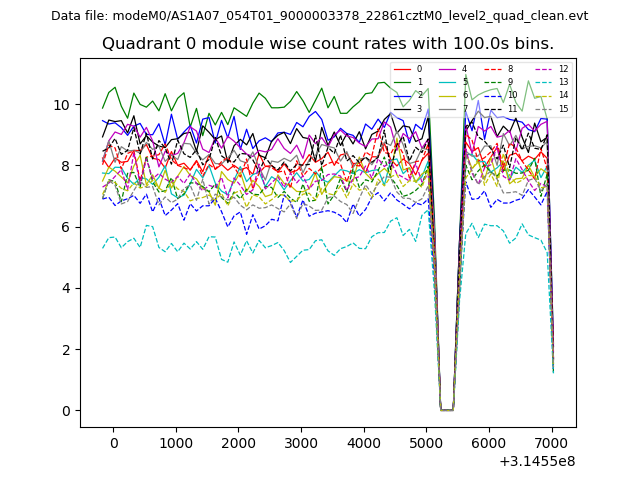 |
 |
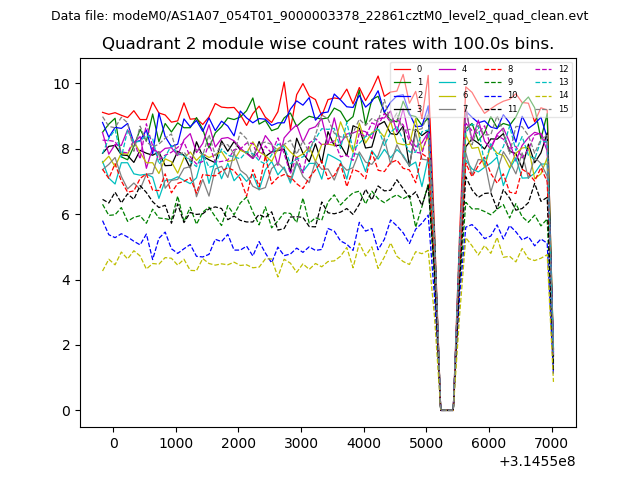
| Module-wise count rates for Quadrant B Data is divided into 100 sec bins |
 |
 |
| Module-wise count rates for Quadrant C Data is divided into 100 sec bins |
 |
 |
| Module-wise count rates for Quadrant D Data is divided into 100 sec bins |
 |
 |
| Parameter | Plot |
|---|---|
| CZT HV Monitor | 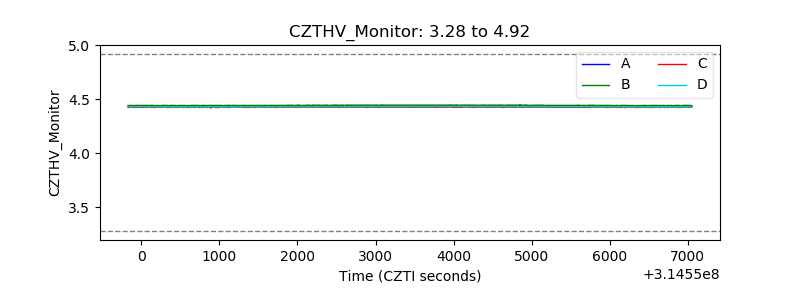 |
| D_VDD |  |
| Temperature 1 | 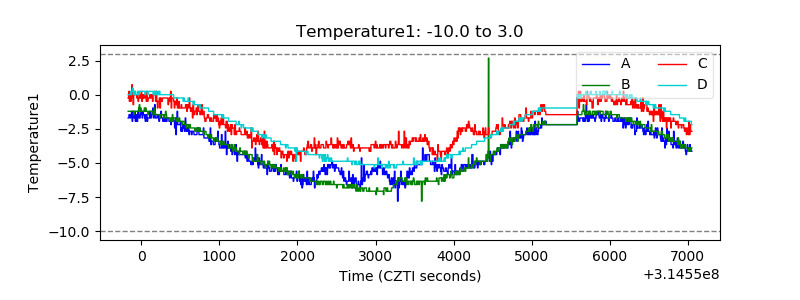 |
| Veto HV Monitor | 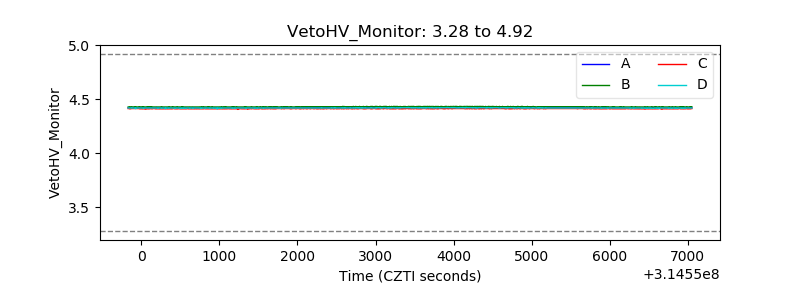 |
| Veto LLD | 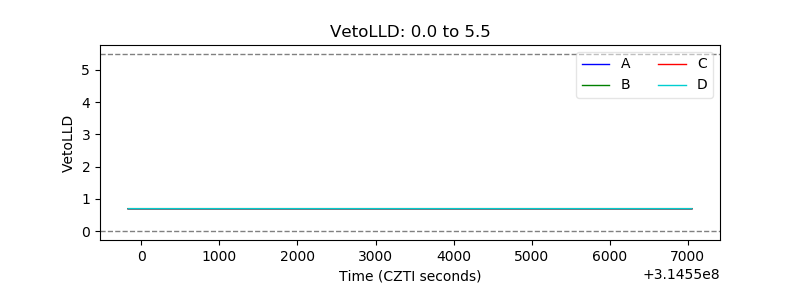 |
| Alpha Counter | 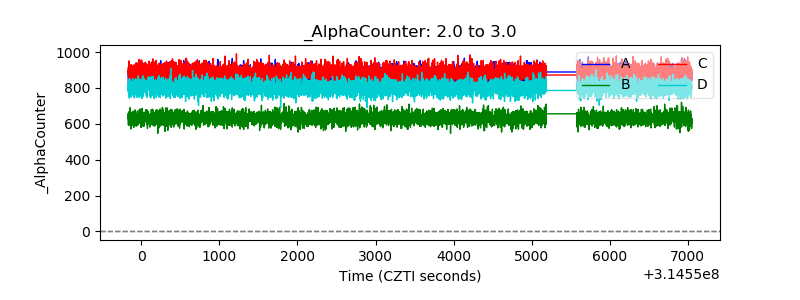 |
| _CPM_Rate | 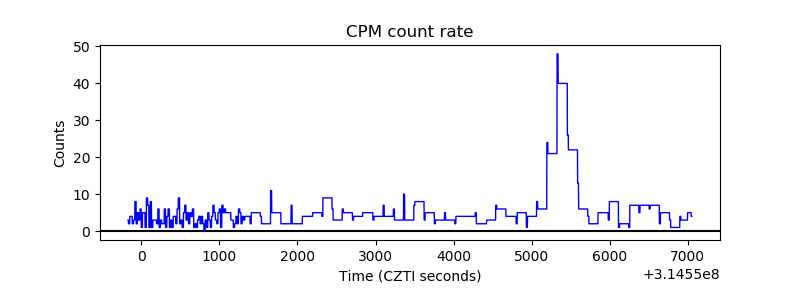 |
| CZT Counter | 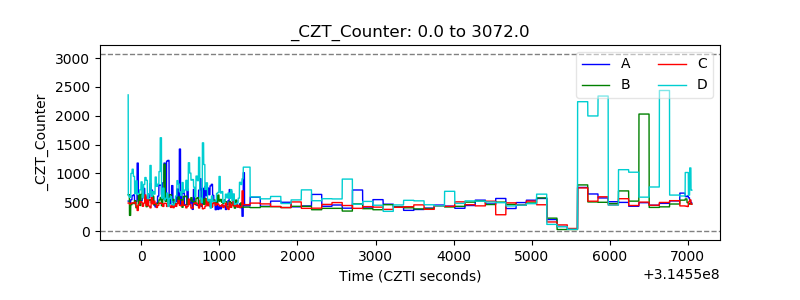 |
| +2.5 Volts monitor |  |
| +5 Volts monitor |  |
| _ROLL_ROT | 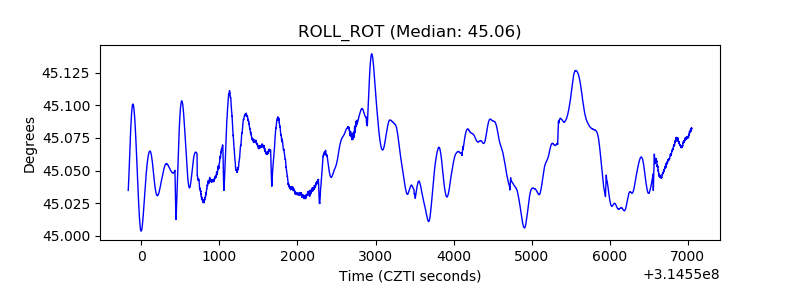 |
| _Roll_DEC | 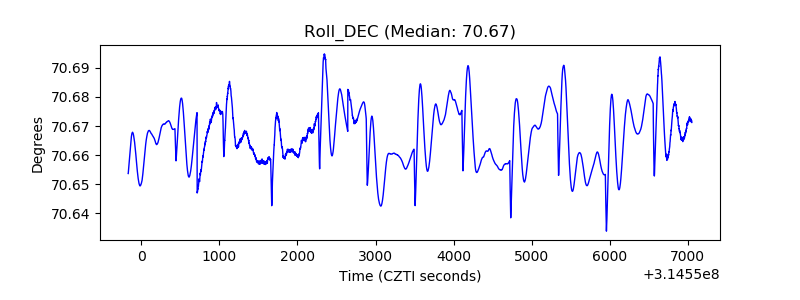 |
| _Roll_RA | 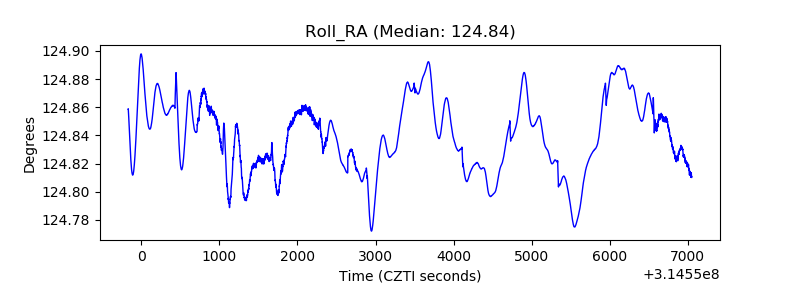 |
| Veto Counter | 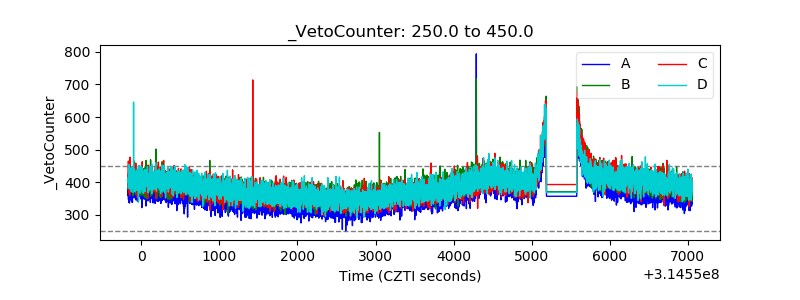 |