| Param | Original file | Final file |
|---|---|---|
| Filename | modeM0/AS1A07_054T01_9000003378_22864cztM0_level2.evt | modeM0/AS1A07_054T01_9000003378_22864cztM0_level2_quad_clean.evt |
| Size (bytes) | 1,349,873,280 | 331,148,160 |
| Size | 1.3 GB | 315.8 MB |
| Events in quadrant A | 8,346,674 | 2,268,725 |
| Events in quadrant B | 8,407,402 | 2,267,607 |
| Events in quadrant C | 8,221,922 | 2,176,252 |
| Events in quadrant D | 14,692,408 | 2,080,689 |
| Mode M9 | |||
|---|---|---|---|
| Quadrant | BADHDUFLAG | Total packets | Discarded packets |
| A | 0 | 21 | 0 |
| B | 0 | 21 | 0 |
| C | 0 | 21 | 0 |
| D | 0 | 21 | 0 |
| Mode SS | |||
|---|---|---|---|
| Quadrant | BADHDUFLAG | Total packets | Discarded packets |
| A | 0 | 366 | 0 |
| B | 0 | 366 | 0 |
| C | 0 | 366 | 0 |
| D | 0 | 366 | 0 |
| Mode M0 | |||
|---|---|---|---|
| Quadrant | BADHDUFLAG | Total packets | Discarded packets |
| A | 0 | 36863 | 2 |
| B | 0 | 37132 | 2 |
| C | 0 | 36553 | 2 |
| D | 0 | 56257 | 3 |
| Quadrant | Total seconds | Saturated seconds | Saturation percentage |
|---|---|---|---|
| A | 17949 | 42 | 0.233996% |
| B | 17950 | 76 | 0.423398% |
| C | 17950 | 151 | 0.841226% |
| D | 17949 | 1340 | 7.465597% |
Noise dominated data is calculated using 1-second bins in cleaned event files. If a bin has >2000 counts, and if more than 50% of those come from <1% of pixels, then it is considered to be noise-dominated and hence unusable.
| Quadrant | # 1 sec bins | Bins with >0 counts | Bins with >2000 counts | High rate bins dominated by noise | Noise dominated (total time) | Noise dominated (detector-on time) | Marked lightcurve |
|---|---|---|---|---|---|---|---|
| A | 20069 | 17952 | 0 | 0 | 0.00% | 0.00% | 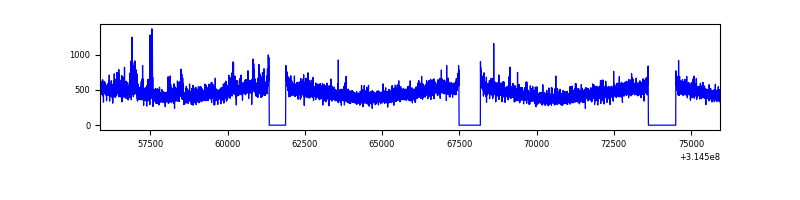 |
| B | 20070 | 17953 | 5 | 5 | 0.02% | 0.03% | 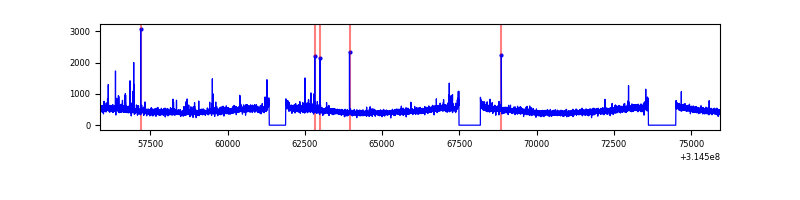 |
| C | 20070 | 17953 | 1 | 1 | 0.00% | 0.01% | 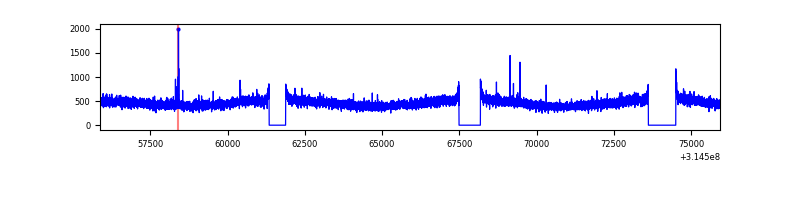 |
| D | 20069 | 17952 | 1100 | 1100 | 5.48% | 6.13% | 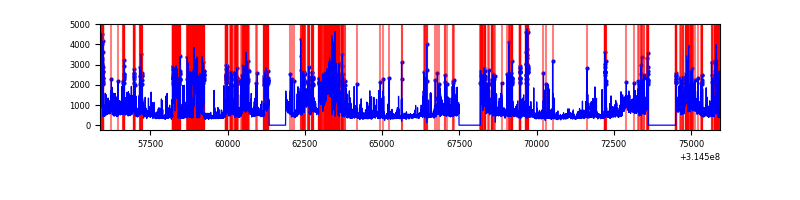 |
Top three noisy pixels from each quadrant. If the there are fewer than three noisy pixels in the level2.evt file, extra rows are filled as -1
| Pixel properties | Quadrant properties | ||||||
|---|---|---|---|---|---|---|---|
| Quadrant | DetID | PixID | Counts | Sigma | Mean | Median | Sigma |
| A | 11 | 47 | 168976 | 398.31 | 2102 | 2056 | 419.1 |
| A | 13 | 252 | 42853 | 97.35 | 2102 | 2056 | 419.1 |
| A | 13 | 254 | 30544 | 67.98 | 2102 | 2056 | 419.1 |
| B | 0 | 189 | 76921 | 190.19 | 2089 | 2035 | 393.7 |
| B | 0 | 190 | 68813 | 169.6 | 2089 | 2035 | 393.7 |
| B | 12 | 111 | 47900 | 116.49 | 2089 | 2035 | 393.7 |
| C | 14 | 238 | 316495 | 668.53 | 2016 | 2025 | 470.4 |
| C | 10 | 22 | 28196 | 55.64 | 2016 | 2025 | 470.4 |
| C | 7 | 247 | 16794 | 31.4 | 2016 | 2025 | 470.4 |
| D | 7 | 238 | 4647433 | 9673.55 | 1996 | 1943 | 480.2 |
| D | 1 | 52 | 1345172 | 2797.08 | 1996 | 1943 | 480.2 |
| D | 1 | 239 | 344985 | 714.33 | 1996 | 1943 | 480.2 |
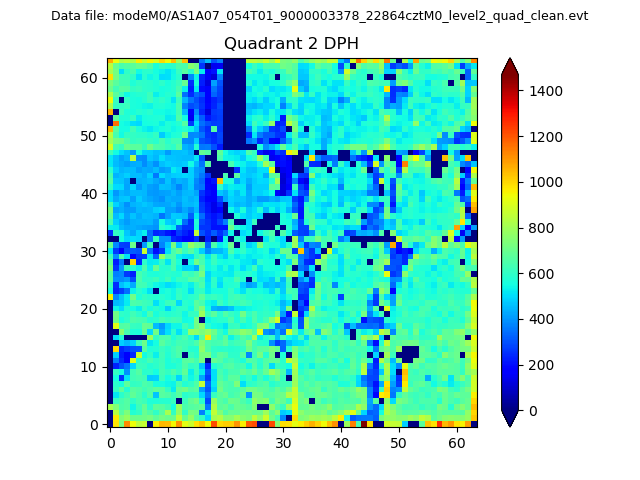
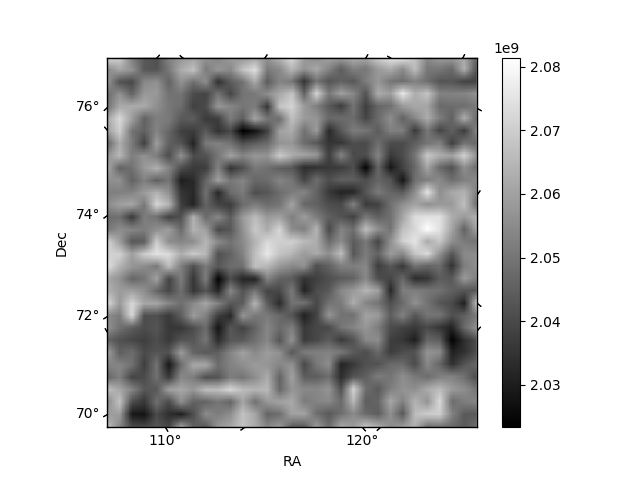
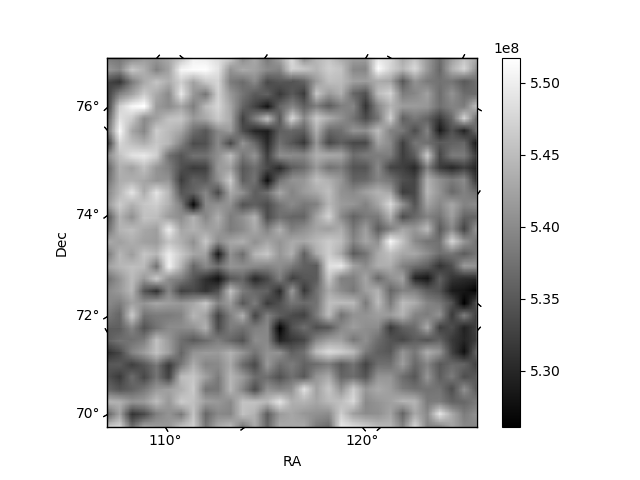
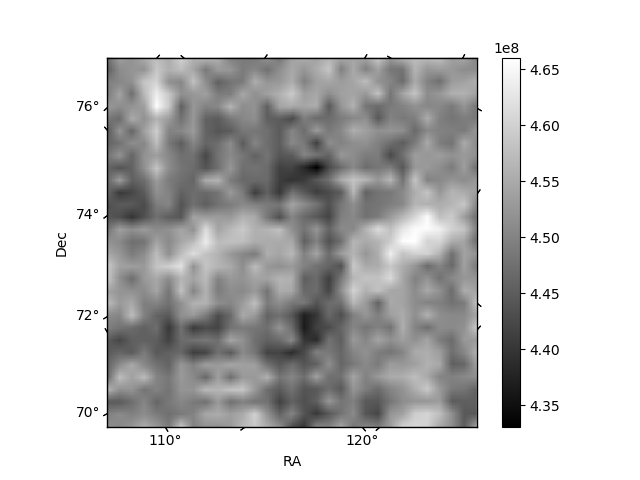
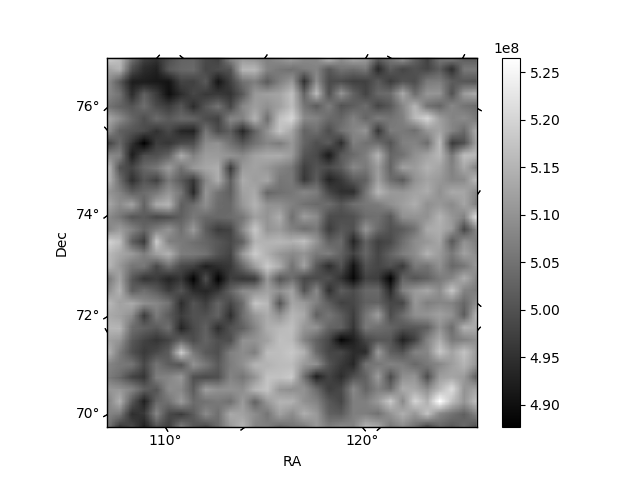
Histogram calculated using DETX and DETY for each event in the final _common_clean file
| Quadrant A | 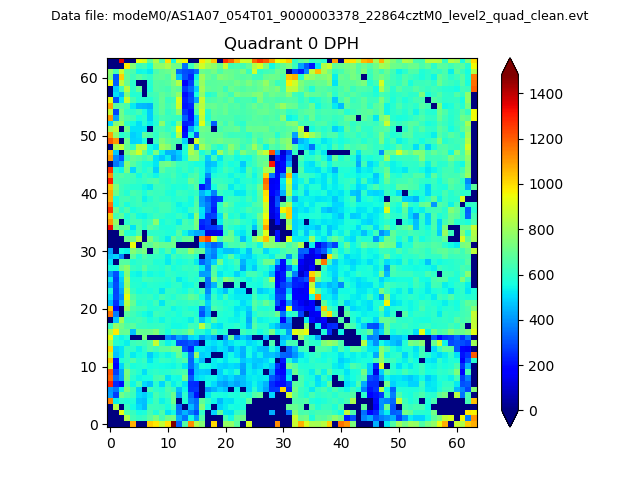 |
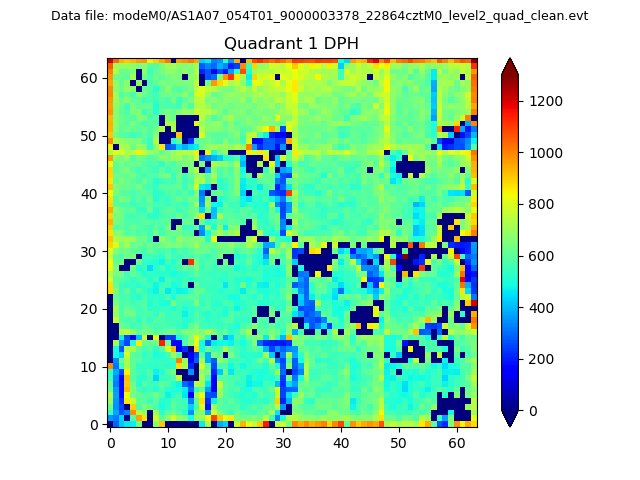 |
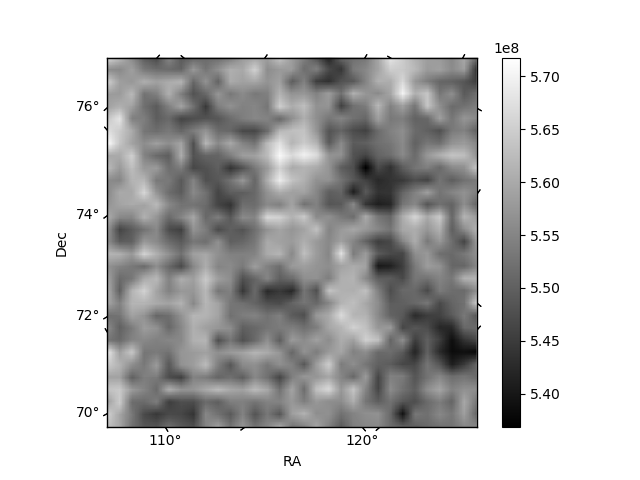
Quadrant B |
|---|---|---|---|
| Quadrant D | 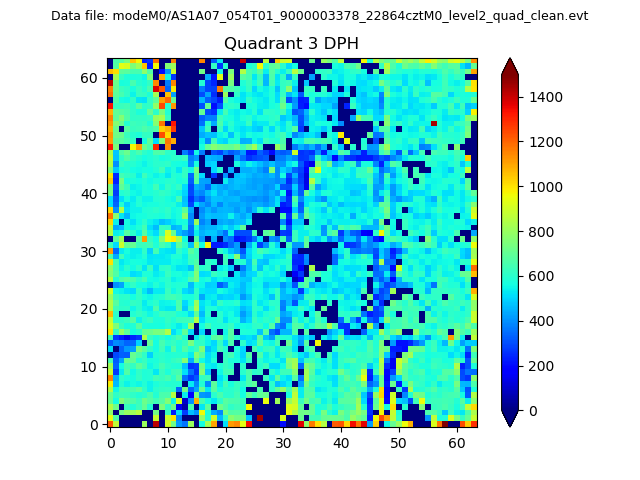 |
 |
Quadrant C |
| Plot type | Count rate plots | Images |
|---|---|---|
| Comparison with Poisson distribution Blue bars denote a histogram of data divided into 1 sec bins. Red curve is a Poisson curve with rate = median count rate of data. |
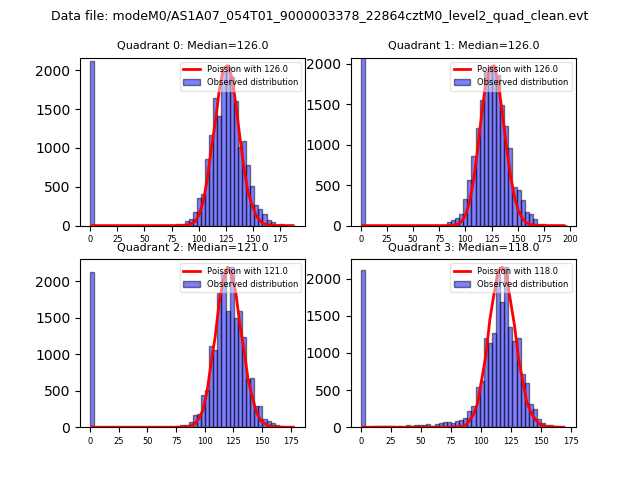 |
 |
| Quadrant-wise count rates Data is divided into 100 sec bins |
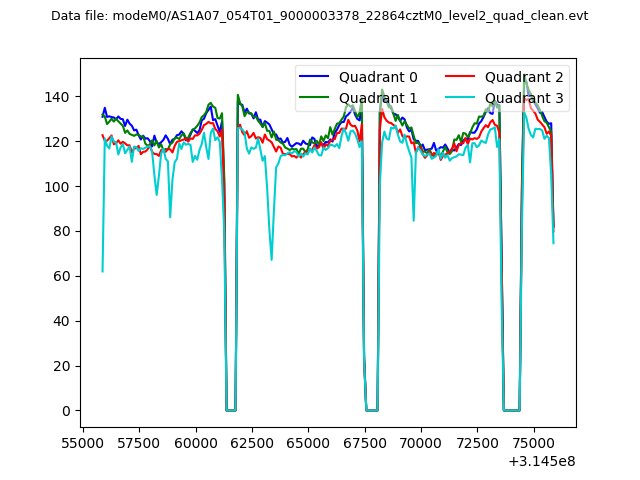 |
|
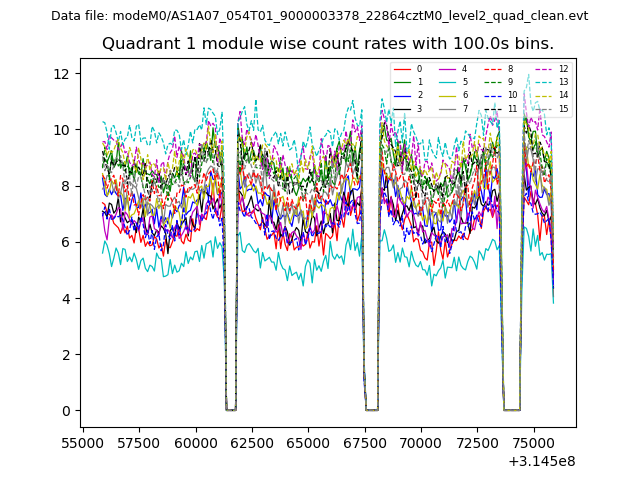
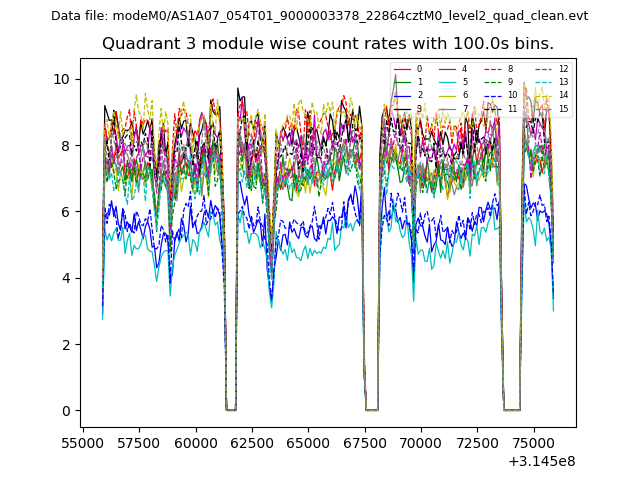
| Module-wise count rates for Quadrant A Data is divided into 100 sec bins |
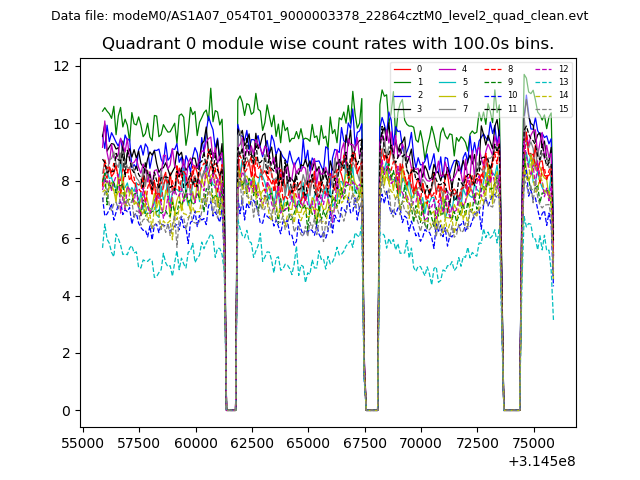 |
 |
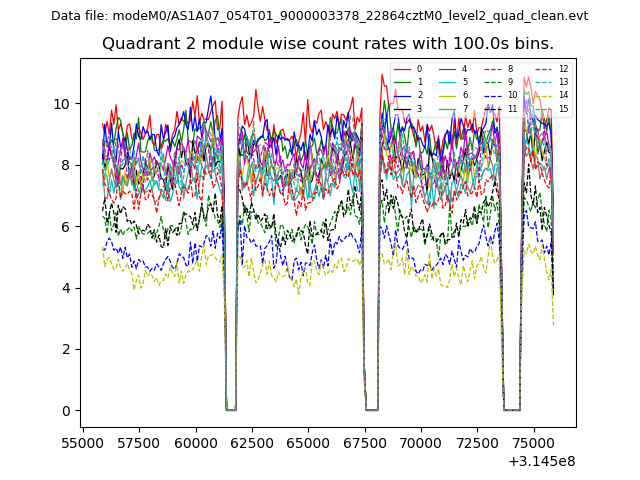
| Module-wise count rates for Quadrant B Data is divided into 100 sec bins |
 |
 |
| Module-wise count rates for Quadrant C Data is divided into 100 sec bins |
 |
 |
| Module-wise count rates for Quadrant D Data is divided into 100 sec bins |
 |
 |
| Parameter | Plot |
|---|---|
| CZT HV Monitor |  |
| D_VDD | 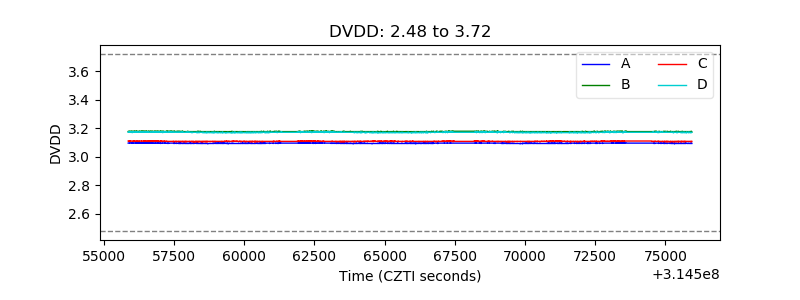 |
| Temperature 1 | 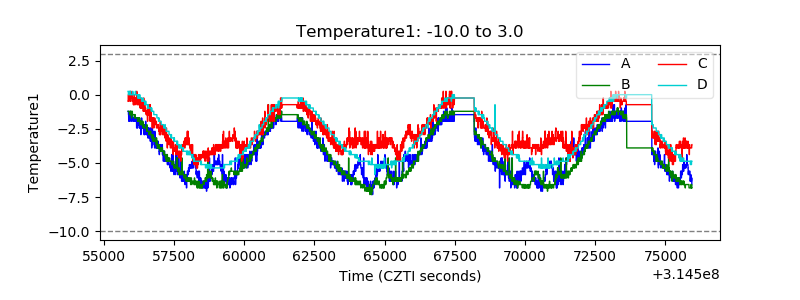 |
| Veto HV Monitor | 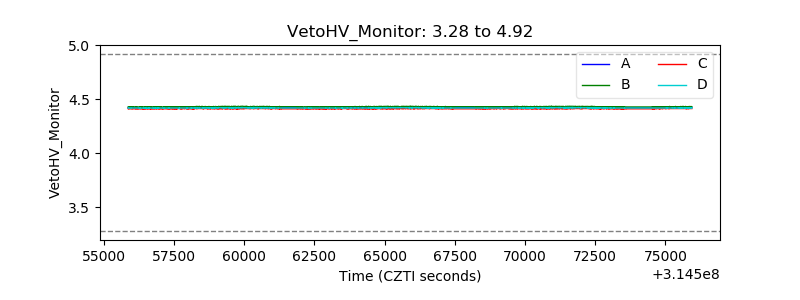 |
| Veto LLD | 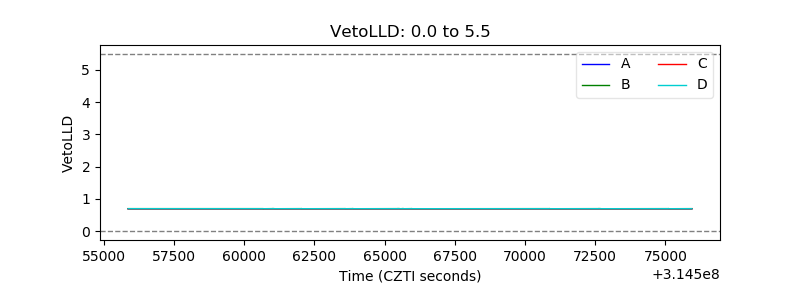 |
| Alpha Counter | 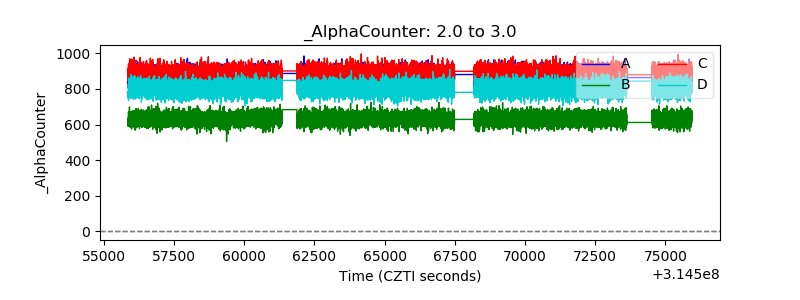 |
| _CPM_Rate |  |
| CZT Counter | 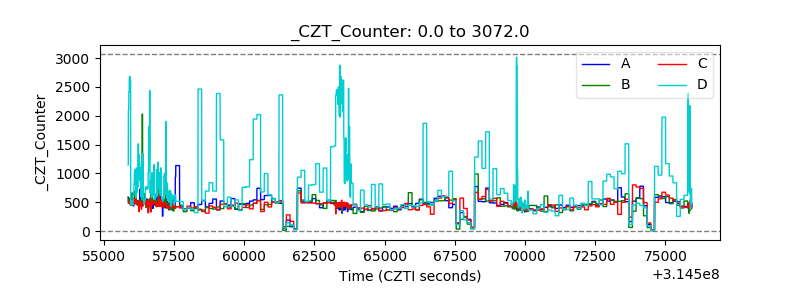 |
| +2.5 Volts monitor | 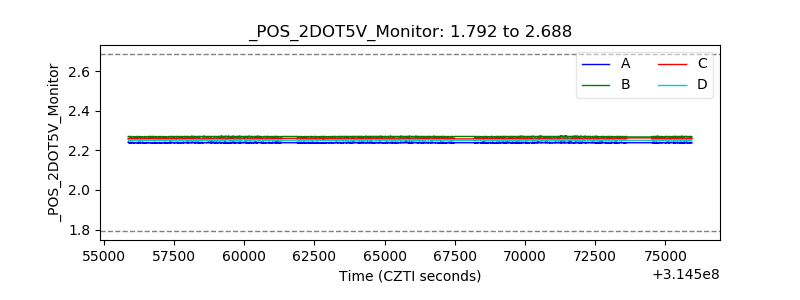 |
| +5 Volts monitor |  |
| _ROLL_ROT | 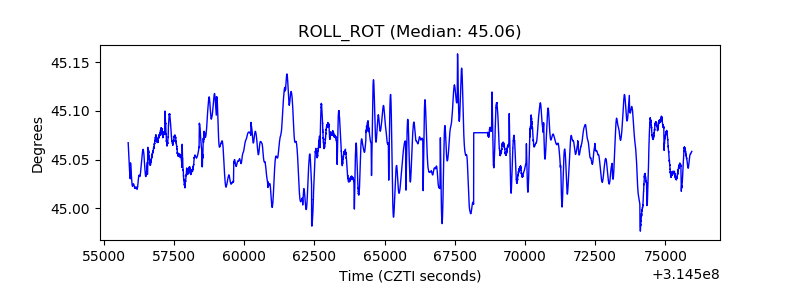 |
| _Roll_DEC | 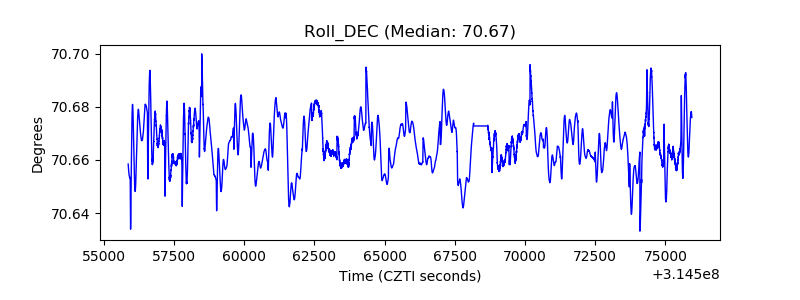 |
| _Roll_RA | 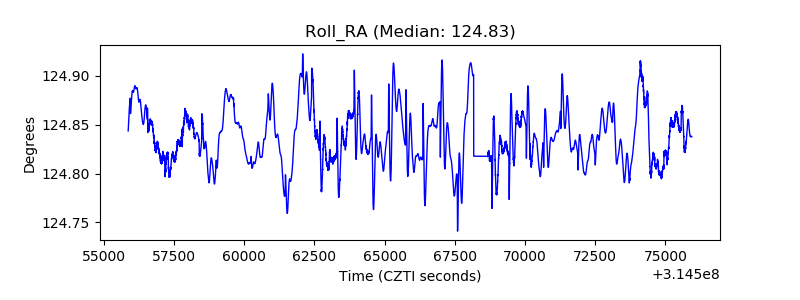 |
| Veto Counter |  |