| Param | Original file | Final file |
|---|---|---|
| Filename | modeM0/AS1A07_054T01_9000003378_22865cztM0_level2.evt | modeM0/AS1A07_054T01_9000003378_22865cztM0_level2_quad_clean.evt |
| Size (bytes) | 497,597,760 | 123,655,680 |
| Size | 474.5 MB | 117.9 MB |
| Events in quadrant A | 2,987,169 | 844,161 |
| Events in quadrant B | 3,076,515 | 851,692 |
| Events in quadrant C | 3,066,589 | 817,669 |
| Events in quadrant D | 5,499,603 | 779,451 |
| Mode M9 | |||
|---|---|---|---|
| Quadrant | BADHDUFLAG | Total packets | Discarded packets |
| A | 0 | 14 | 0 |
| B | 0 | 15 | 0 |
| C | 0 | 15 | 0 |
| D | 0 | 15 | 0 |
| Mode SS | |||
|---|---|---|---|
| Quadrant | BADHDUFLAG | Total packets | Discarded packets |
| A | 0 | 130 | 0 |
| B | 0 | 130 | 0 |
| C | 0 | 130 | 0 |
| D | 0 | 130 | 0 |
| Mode M0 | |||
|---|---|---|---|
| Quadrant | BADHDUFLAG | Total packets | Discarded packets |
| A | 0 | 13263 | 2 |
| B | 0 | 13557 | 2 |
| C | 0 | 13502 | 2 |
| D | 0 | 20887 | 2 |
| Quadrant | Total seconds | Saturated seconds | Saturation percentage |
|---|---|---|---|
| A | 6489 | 13 | 0.200339% |
| B | 6489 | 28 | 0.431499% |
| C | 6489 | 58 | 0.893820% |
| D | 6488 | 386 | 5.949445% |
Noise dominated data is calculated using 1-second bins in cleaned event files. If a bin has >2000 counts, and if more than 50% of those come from <1% of pixels, then it is considered to be noise-dominated and hence unusable.
| Quadrant | # 1 sec bins | Bins with >0 counts | Bins with >2000 counts | High rate bins dominated by noise | Noise dominated (total time) | Noise dominated (detector-on time) | Marked lightcurve |
|---|---|---|---|---|---|---|---|
| A | 7509 | 6490 | 0 | 0 | 0.00% | 0.00% | 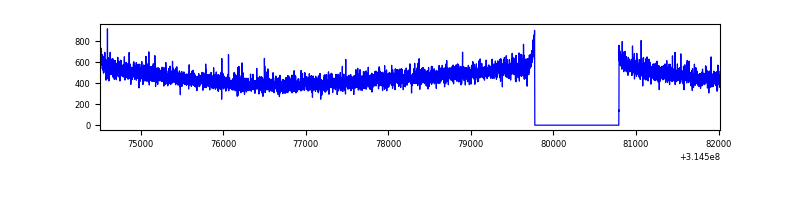 |
| B | 7509 | 6490 | 0 | 0 | 0.00% | 0.00% | 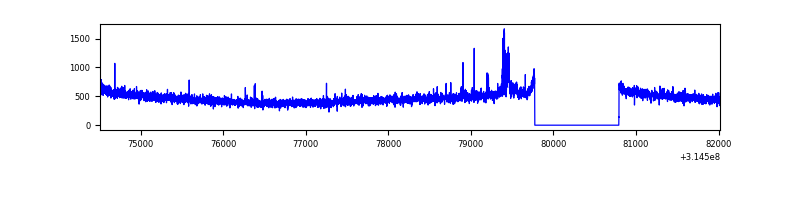 |
| C | 7509 | 6490 | 2 | 2 | 0.03% | 0.03% | 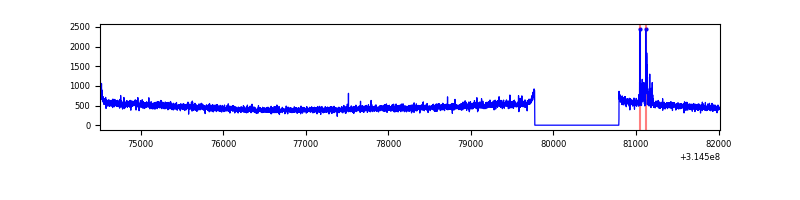 |
| D | 7508 | 6489 | 314 | 314 | 4.18% | 4.84% | 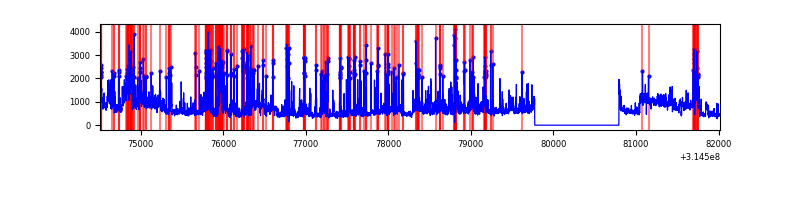 |
Top three noisy pixels from each quadrant. If the there are fewer than three noisy pixels in the level2.evt file, extra rows are filled as -1
| Pixel properties | Quadrant properties | ||||||
|---|---|---|---|---|---|---|---|
| Quadrant | DetID | PixID | Counts | Sigma | Mean | Median | Sigma |
| A | 11 | 47 | 13349 | 80.61 | 769 | 752 | 156.3 |
| A | 13 | 254 | 10418 | 61.86 | 769 | 752 | 156.3 |
| A | 6 | 16 | 8514 | 49.67 | 769 | 752 | 156.3 |
| B | 0 | 190 | 55380 | 376.5 | 767 | 749 | 145.1 |
| B | 12 | 111 | 17495 | 115.41 | 767 | 749 | 145.1 |
| B | 11 | 111 | 15304 | 100.31 | 767 | 749 | 145.1 |
| C | 14 | 238 | 116729 | 672.08 | 741 | 744 | 172.6 |
| C | 10 | 22 | 41887 | 238.41 | 741 | 744 | 172.6 |
| C | 0 | 10 | 10070 | 54.04 | 741 | 744 | 172.6 |
| D | 7 | 238 | 1753508 | 9775.93 | 735 | 712 | 179.3 |
| D | 1 | 52 | 446435 | 2485.95 | 735 | 712 | 179.3 |
| D | 2 | 152 | 206639 | 1148.52 | 735 | 712 | 179.3 |
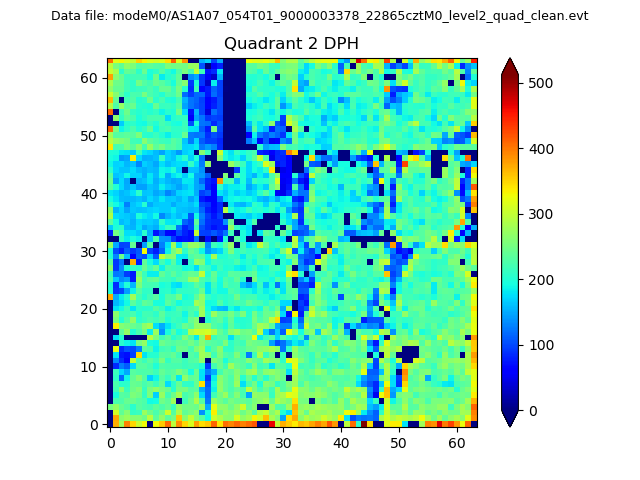
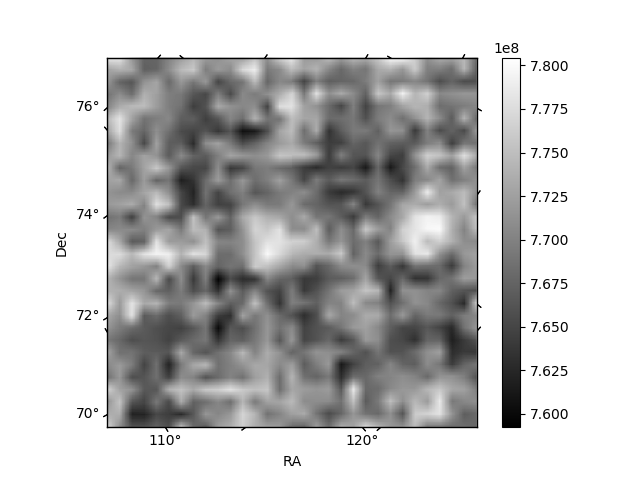
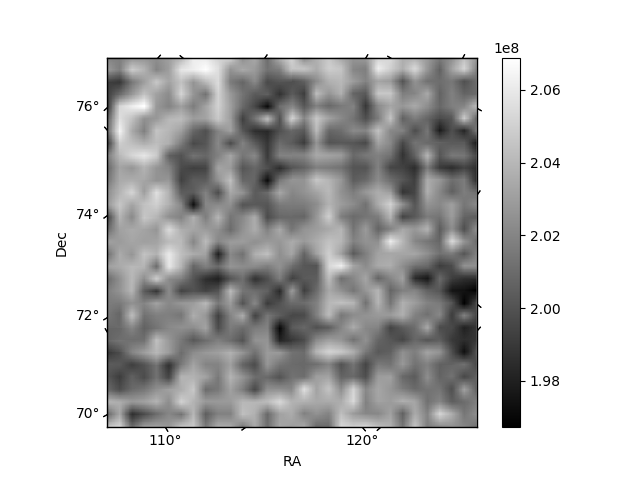
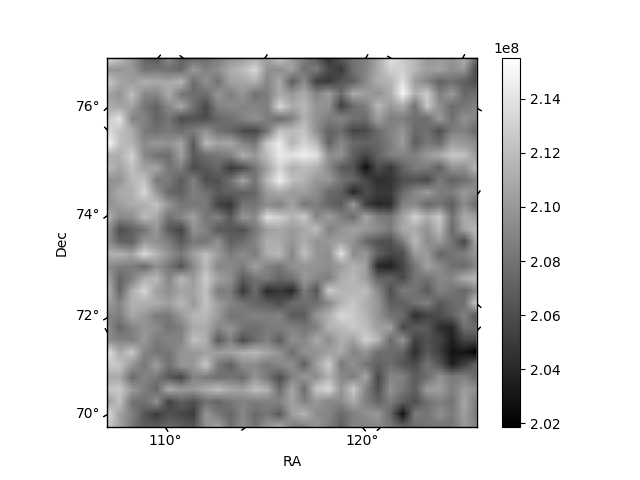
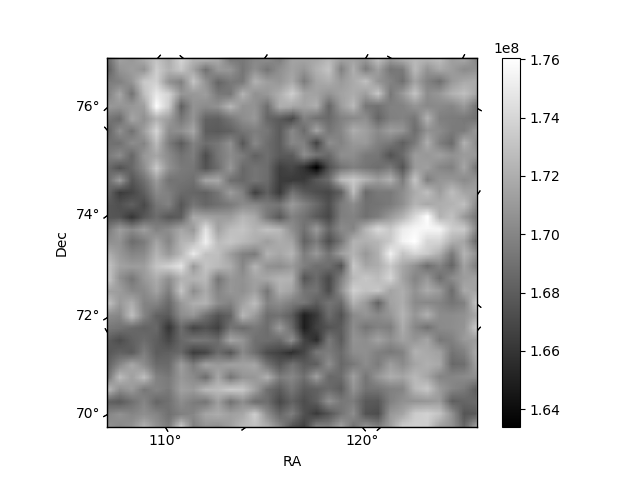
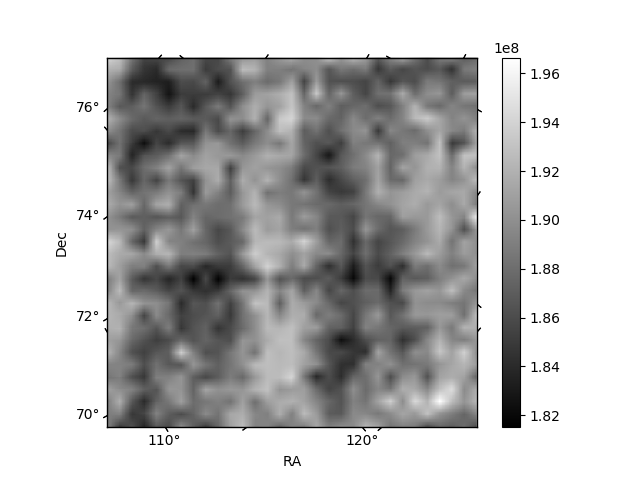
Histogram calculated using DETX and DETY for each event in the final _common_clean file
| Quadrant A | 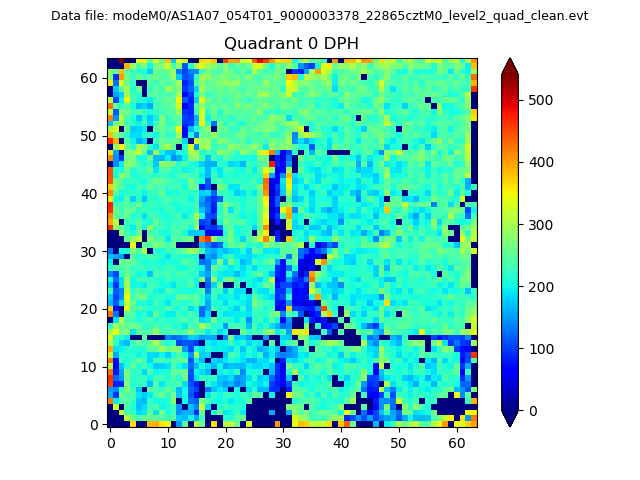 |
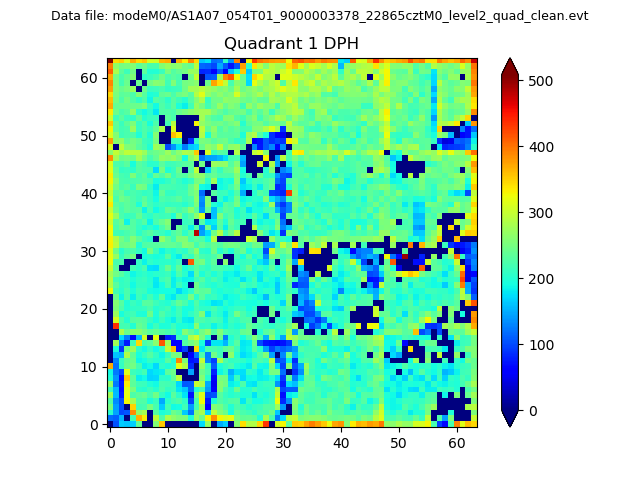 |
Quadrant B |
|---|---|---|---|
| Quadrant D | 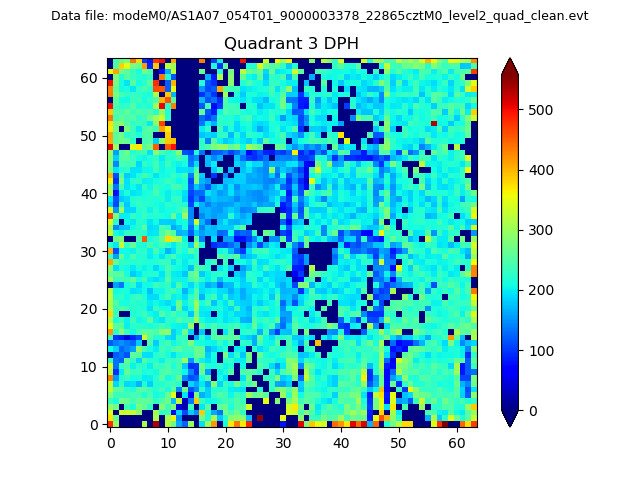 |
 |
Quadrant C |
| Plot type | Count rate plots | Images |
|---|---|---|
| Comparison with Poisson distribution Blue bars denote a histogram of data divided into 1 sec bins. Red curve is a Poisson curve with rate = median count rate of data. |
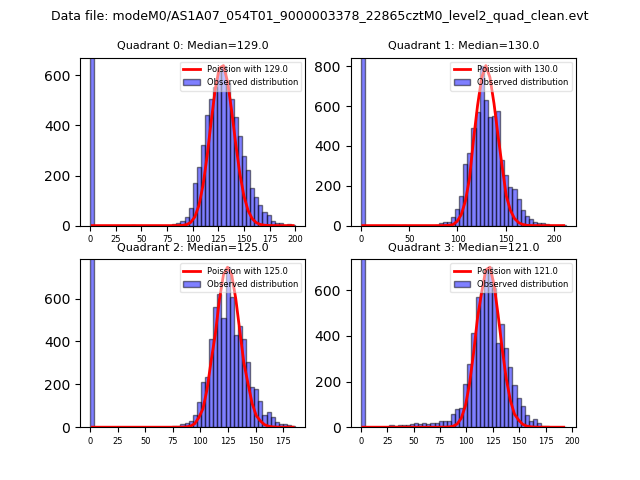 |
 |
| Quadrant-wise count rates Data is divided into 100 sec bins |
 |
|
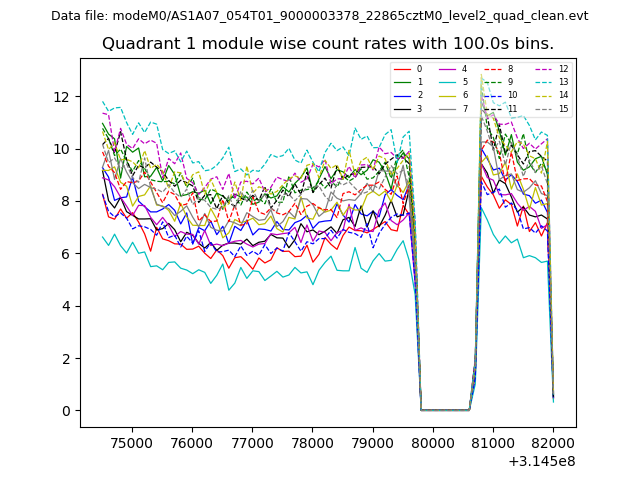
| Module-wise count rates for Quadrant A Data is divided into 100 sec bins |
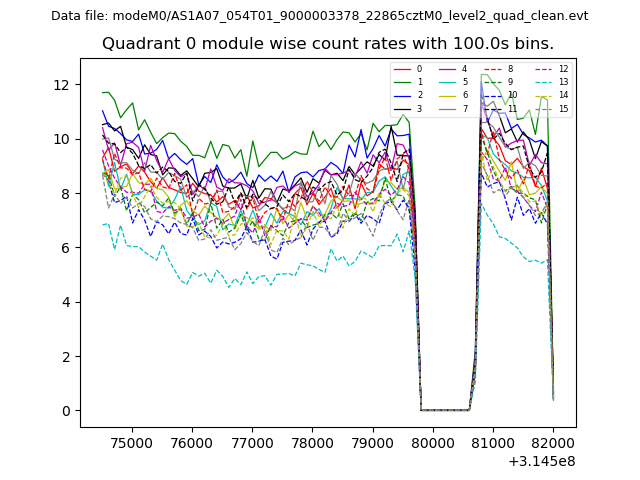 |
 |
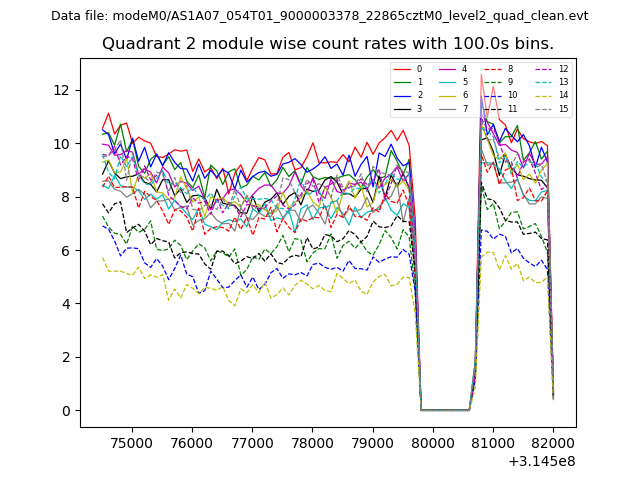
| Module-wise count rates for Quadrant B Data is divided into 100 sec bins |
 |
 |
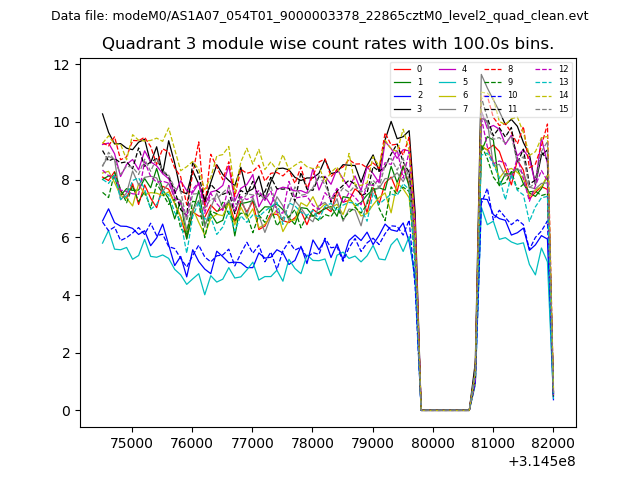
| Module-wise count rates for Quadrant C Data is divided into 100 sec bins |
 |
 |
| Module-wise count rates for Quadrant D Data is divided into 100 sec bins |
 |
 |
| Parameter | Plot |
|---|---|
| CZT HV Monitor | 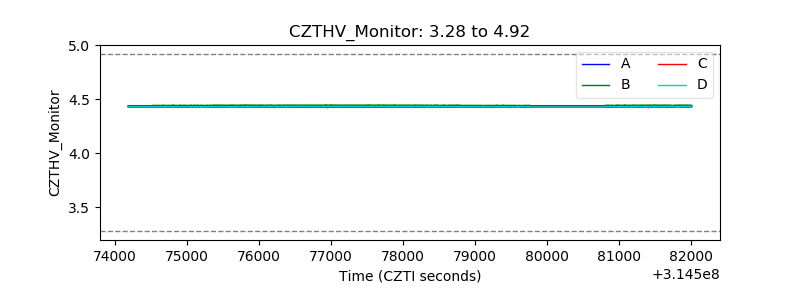 |
| D_VDD | 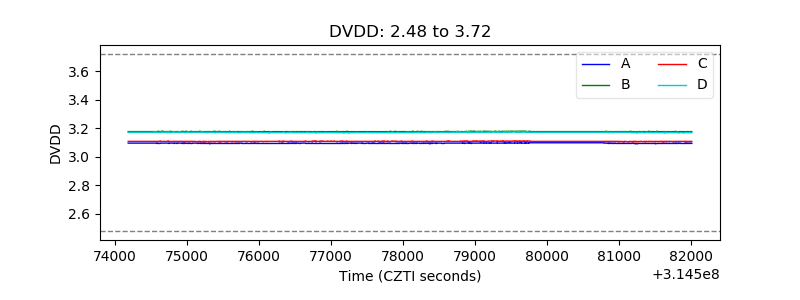 |
| Temperature 1 | 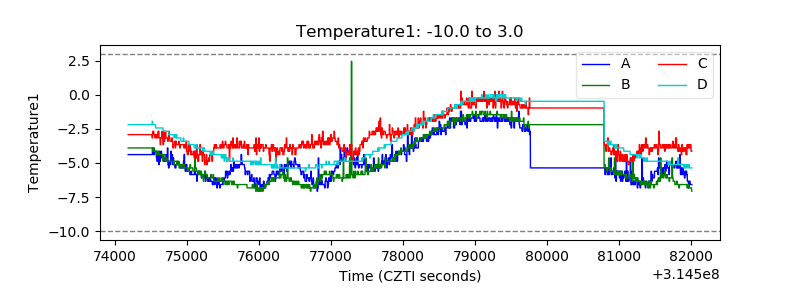 |
| Veto HV Monitor | 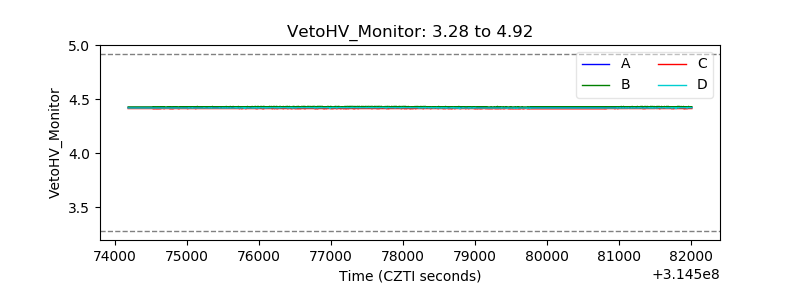 |
| Veto LLD | 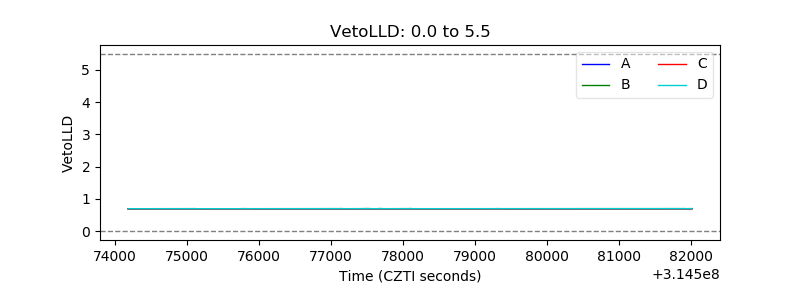 |
| Alpha Counter |  |
| _CPM_Rate | 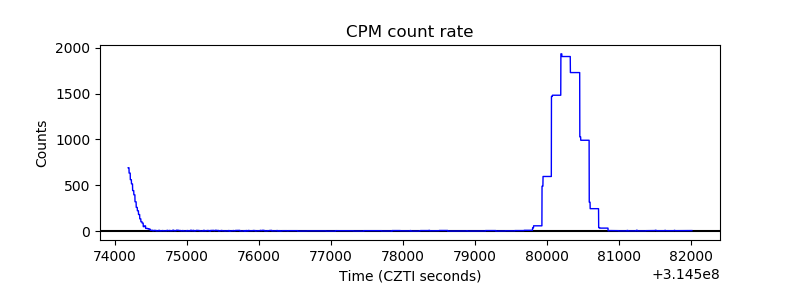 |
| CZT Counter | 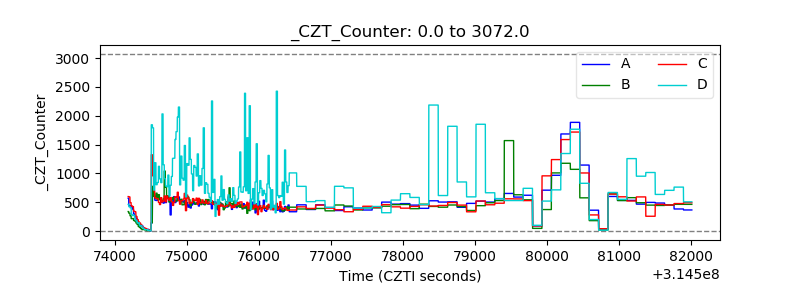 |
| +2.5 Volts monitor |  |
| +5 Volts monitor |  |
| _ROLL_ROT | 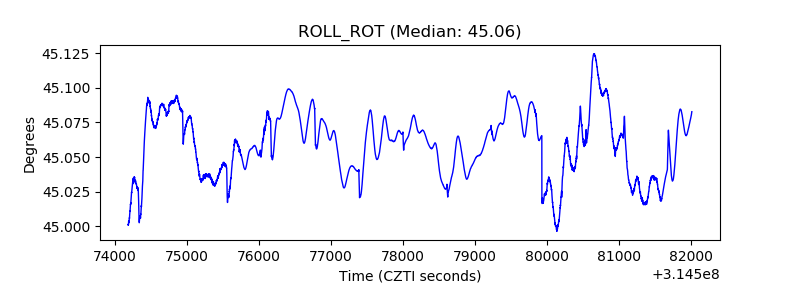 |
| _Roll_DEC | 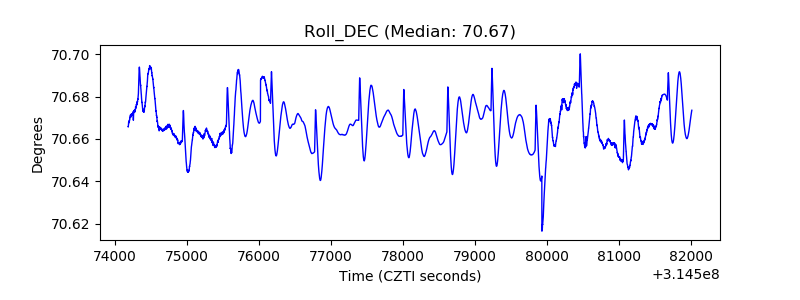 |
| _Roll_RA | 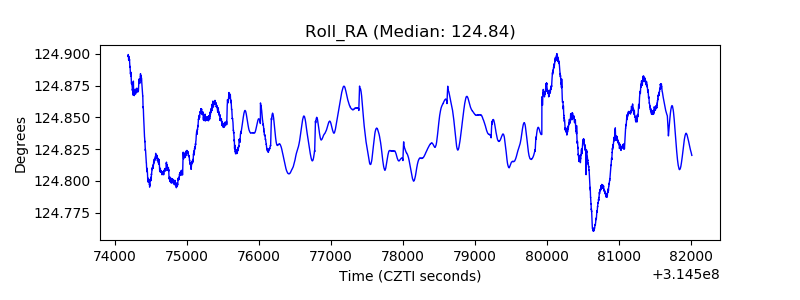 |
| Veto Counter | 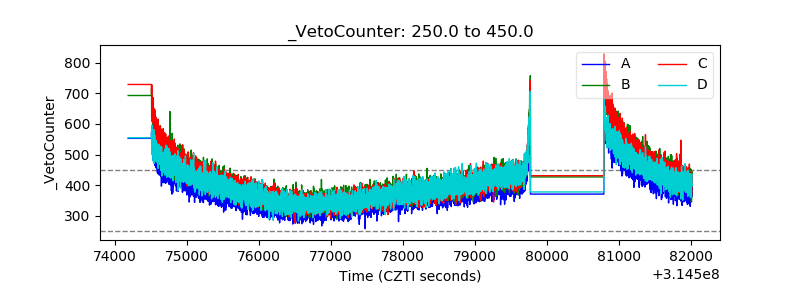 |