| Param | Original file | Final file |
|---|---|---|
| Filename | modeM0/AS1A07_054T01_9000003378_22871cztM0_level2.evt | modeM0/AS1A07_054T01_9000003378_22871cztM0_level2_quad_clean.evt |
| Size (bytes) | 652,881,600 | 181,846,080 |
| Size | 622.6 MB | 173.4 MB |
| Events in quadrant A | 4,249,598 | 1,279,195 |
| Events in quadrant B | 4,495,416 | 1,276,415 |
| Events in quadrant C | 4,167,856 | 1,184,671 |
| Events in quadrant D | 6,266,630 | 1,160,062 |
| Mode M9 | |||
|---|---|---|---|
| Quadrant | BADHDUFLAG | Total packets | Discarded packets |
| A | 0 | 14 | 0 |
| B | 0 | 14 | 0 |
| C | 0 | 14 | 0 |
| D | 0 | 14 | 0 |
| Mode SS | |||
|---|---|---|---|
| Quadrant | BADHDUFLAG | Total packets | Discarded packets |
| A | 0 | 176 | 0 |
| B | 0 | 176 | 0 |
| C | 0 | 176 | 0 |
| D | 0 | 176 | 0 |
| Mode M0 | |||
|---|---|---|---|
| Quadrant | BADHDUFLAG | Total packets | Discarded packets |
| A | 0 | 17865 | 1 |
| B | 0 | 18665 | 1 |
| C | 0 | 17831 | 1 |
| D | 0 | 24500 | 1 |
| Quadrant | Total seconds | Saturated seconds | Saturation percentage |
|---|---|---|---|
| A | 8762 | 27 | 0.308149% |
| B | 8763 | 46 | 0.524934% |
| C | 8763 | 54 | 0.616227% |
| D | 8763 | 163 | 1.860094% |
Noise dominated data is calculated using 1-second bins in cleaned event files. If a bin has >2000 counts, and if more than 50% of those come from <1% of pixels, then it is considered to be noise-dominated and hence unusable.
| Quadrant | # 1 sec bins | Bins with >0 counts | Bins with >2000 counts | High rate bins dominated by noise | Noise dominated (total time) | Noise dominated (detector-on time) | Marked lightcurve |
|---|---|---|---|---|---|---|---|
| A | 10097 | 8763 | 0 | 0 | 0.00% | 0.00% | 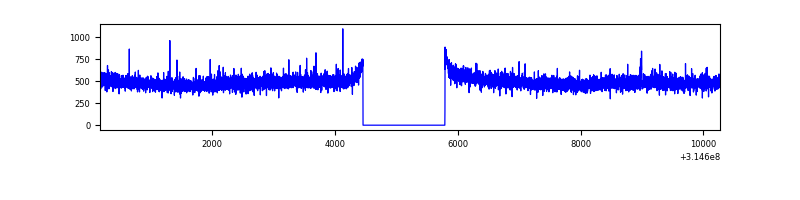 |
| B | 10098 | 8764 | 2 | 2 | 0.02% | 0.02% | 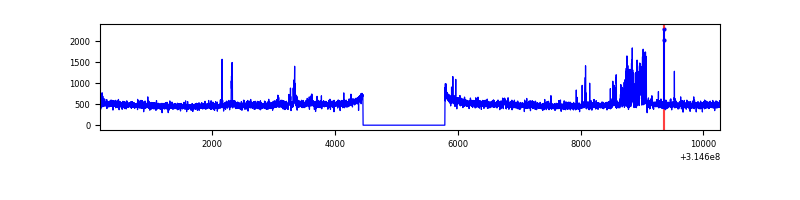 |
| C | 10098 | 8764 | 0 | 0 | 0.00% | 0.00% | 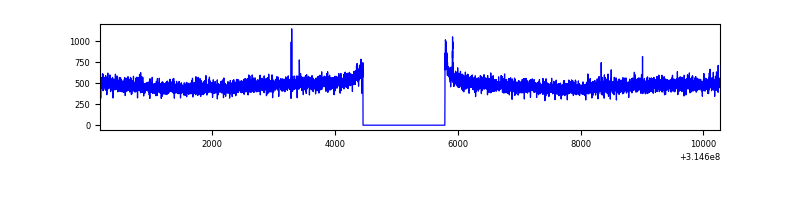 |
| D | 10098 | 8764 | 137 | 137 | 1.36% | 1.56% | 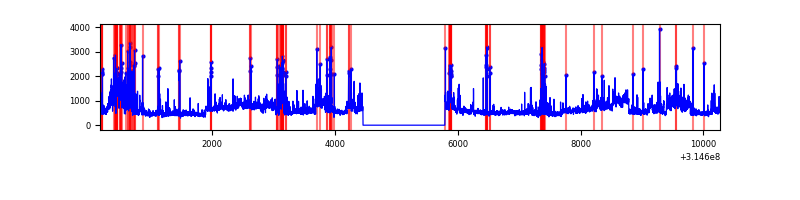 |
Top three noisy pixels from each quadrant. If the there are fewer than three noisy pixels in the level2.evt file, extra rows are filled as -1
| Pixel properties | Quadrant properties | ||||||
|---|---|---|---|---|---|---|---|
| Quadrant | DetID | PixID | Counts | Sigma | Mean | Median | Sigma |
| A | 6 | 16 | 20865 | 91.65 | 1095 | 1073 | 216.0 |
| A | 13 | 254 | 14002 | 59.87 | 1095 | 1073 | 216.0 |
| A | 0 | 226 | 9622 | 39.59 | 1095 | 1073 | 216.0 |
| B | 0 | 190 | 246062 | 1237.18 | 1076 | 1053 | 198.0 |
| B | 0 | 189 | 25008 | 120.96 | 1076 | 1053 | 198.0 |
| B | 12 | 111 | 22759 | 109.61 | 1076 | 1053 | 198.0 |
| C | 14 | 238 | 167009 | 715.63 | 1017 | 1023 | 231.9 |
| C | 7 | 247 | 18138 | 73.79 | 1017 | 1023 | 231.9 |
| C | 2 | 16 | 9853 | 38.07 | 1017 | 1023 | 231.9 |
| D | 7 | 238 | 1145451 | 4551.08 | 1046 | 1018 | 251.5 |
| D | 9 | 1 | 485522 | 1926.73 | 1046 | 1018 | 251.5 |
| D | 1 | 52 | 119527 | 471.28 | 1046 | 1018 | 251.5 |
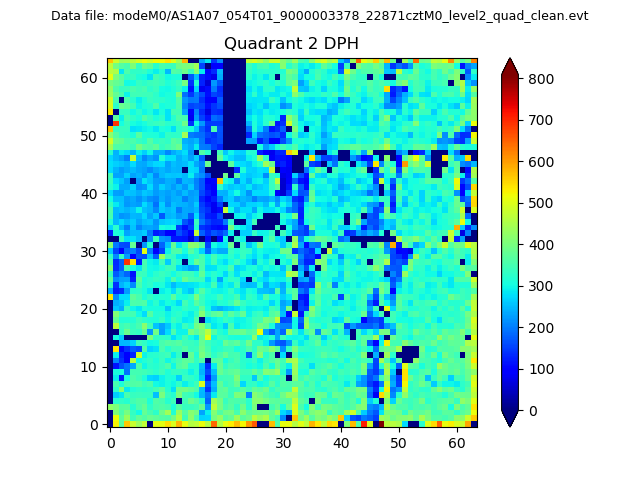
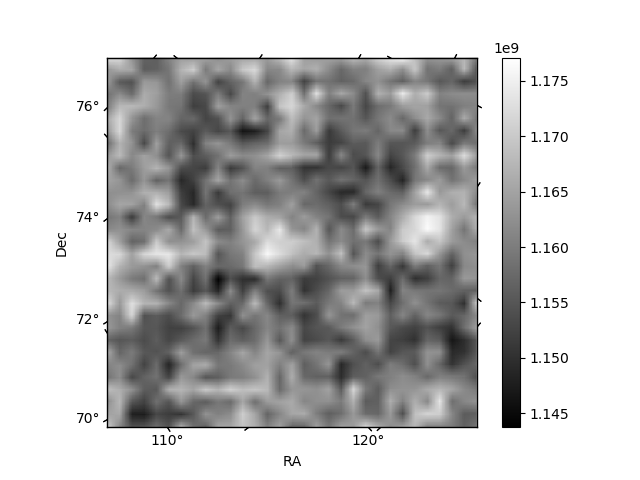
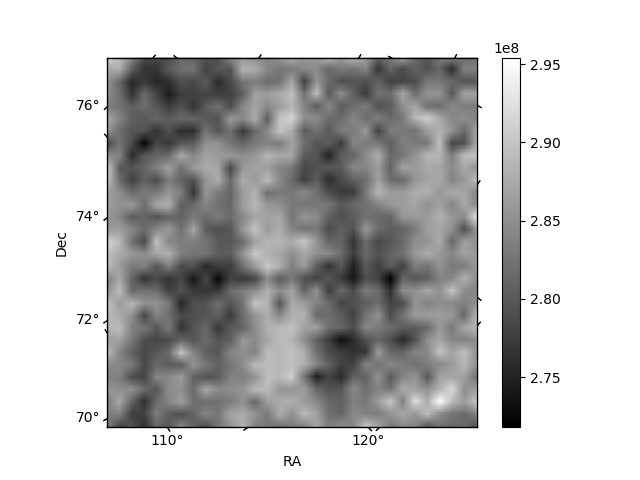
Histogram calculated using DETX and DETY for each event in the final _common_clean file
| Quadrant A | 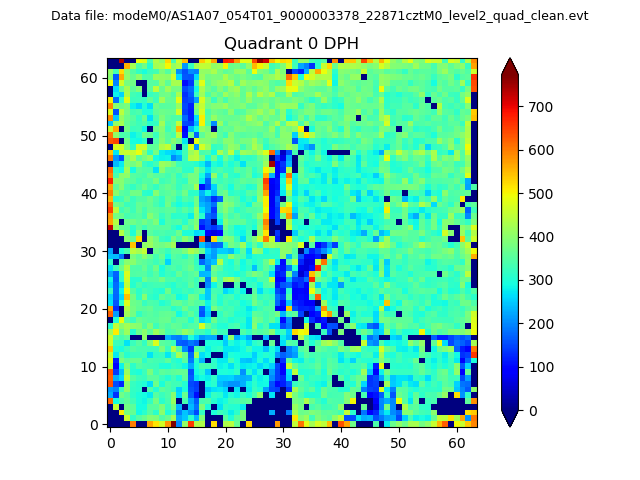 |
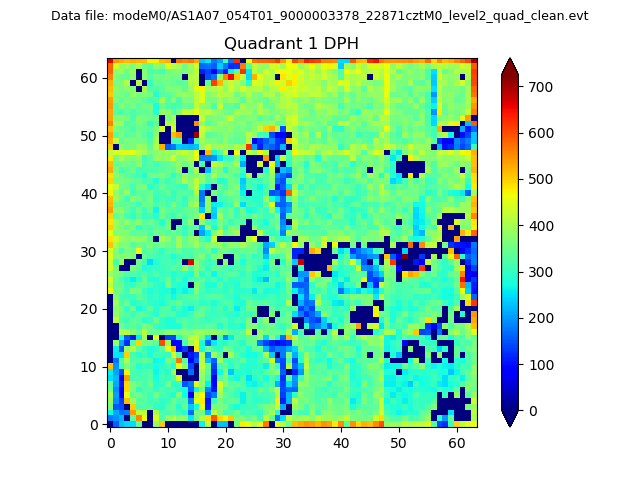 |
Quadrant B |
|---|---|---|---|
| Quadrant D | 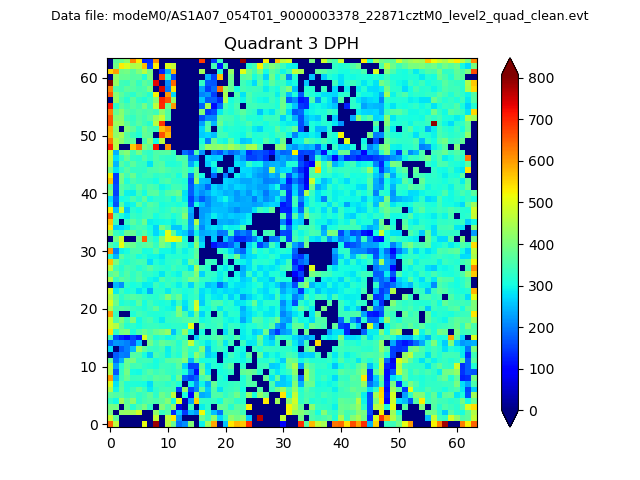 |
 |
Quadrant C |
| Plot type | Count rate plots | Images |
|---|---|---|
| Comparison with Poisson distribution Blue bars denote a histogram of data divided into 1 sec bins. Red curve is a Poisson curve with rate = median count rate of data. |
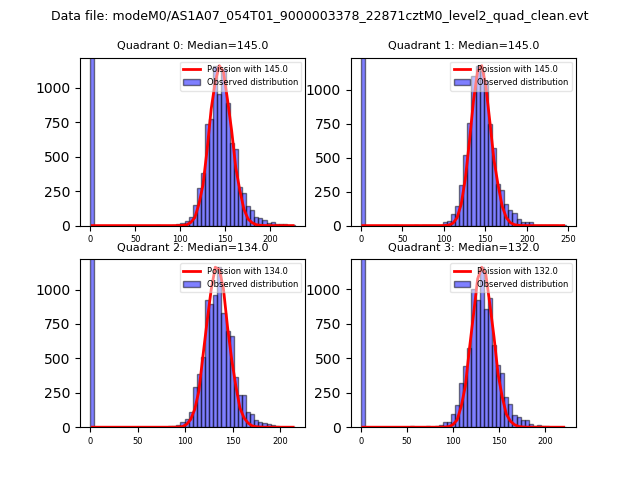 |
 |
| Quadrant-wise count rates Data is divided into 100 sec bins |
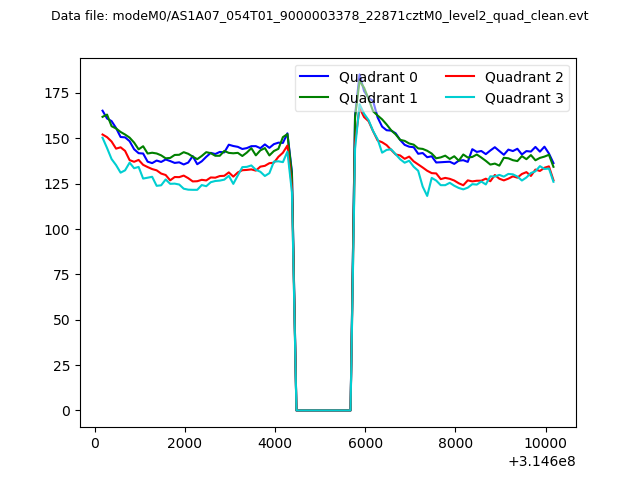 |
|
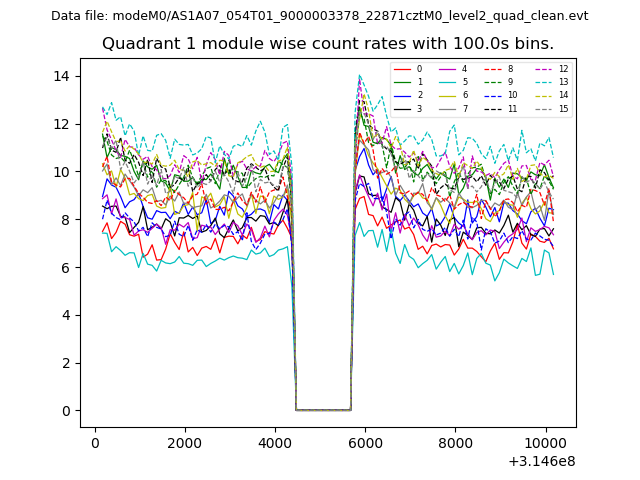
| Module-wise count rates for Quadrant A Data is divided into 100 sec bins |
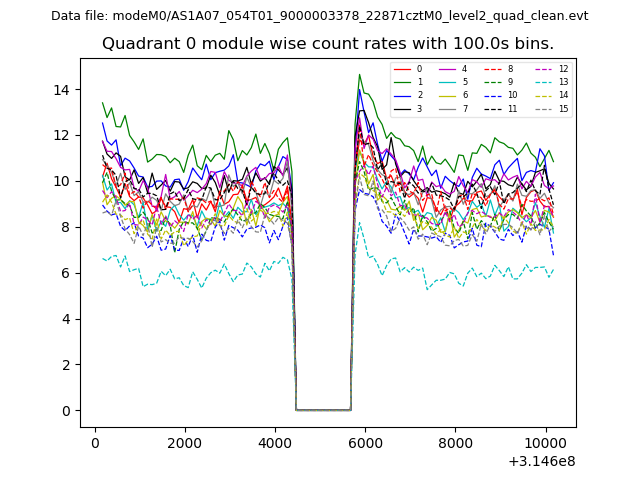 |
 |
| Module-wise count rates for Quadrant B Data is divided into 100 sec bins |
 |
 |
| Module-wise count rates for Quadrant C Data is divided into 100 sec bins |
 |
 |
| Module-wise count rates for Quadrant D Data is divided into 100 sec bins |
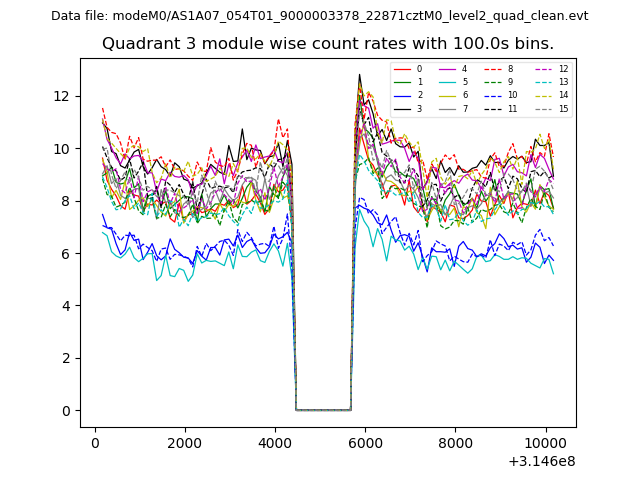 |
 |
| Parameter | Plot |
|---|---|
| CZT HV Monitor | 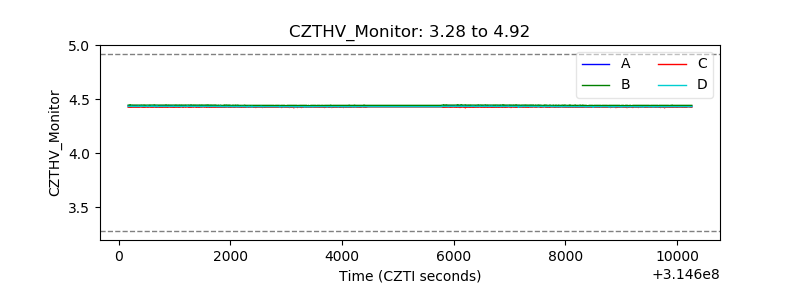 |
| D_VDD | 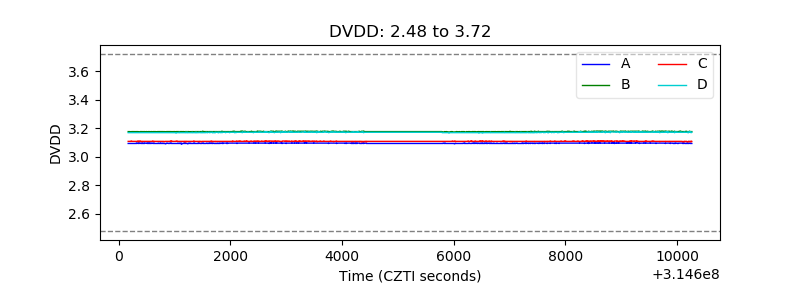 |
| Temperature 1 | 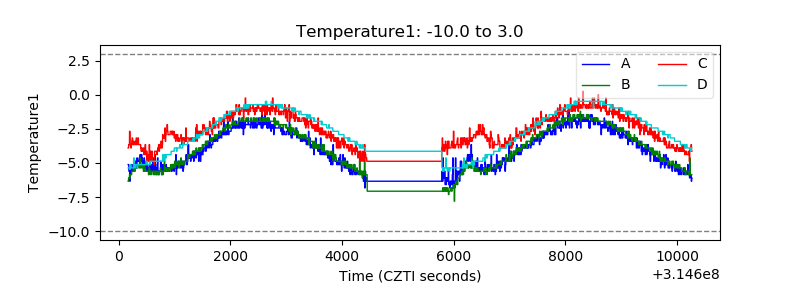 |
| Veto HV Monitor | 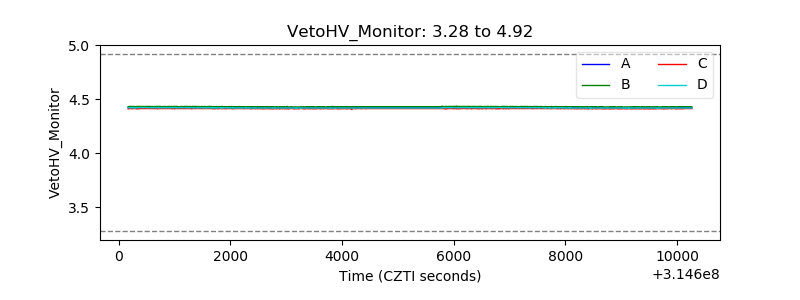 |
| Veto LLD | 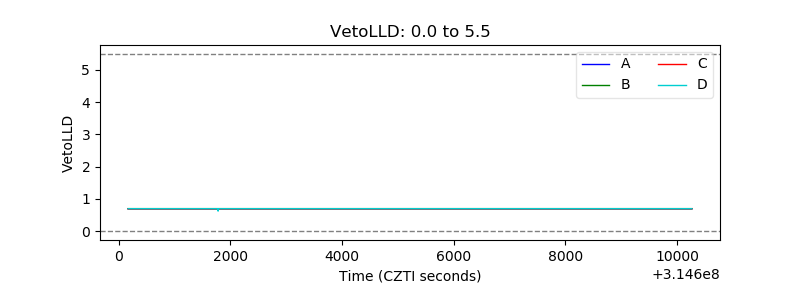 |
| Alpha Counter | 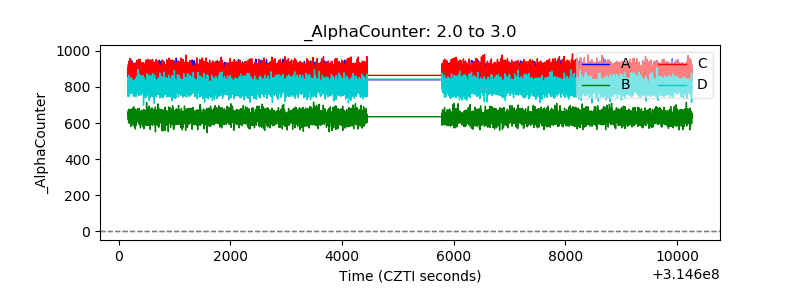 |
| _CPM_Rate | 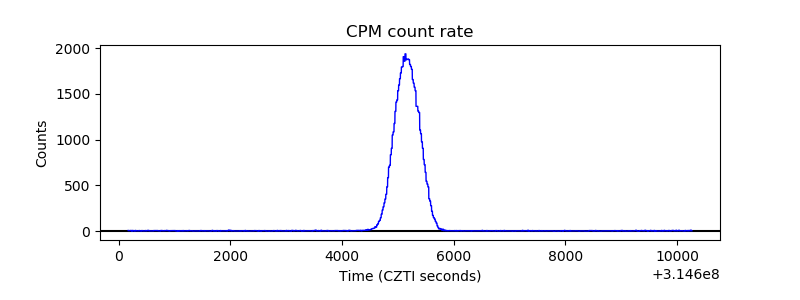 |
| CZT Counter | 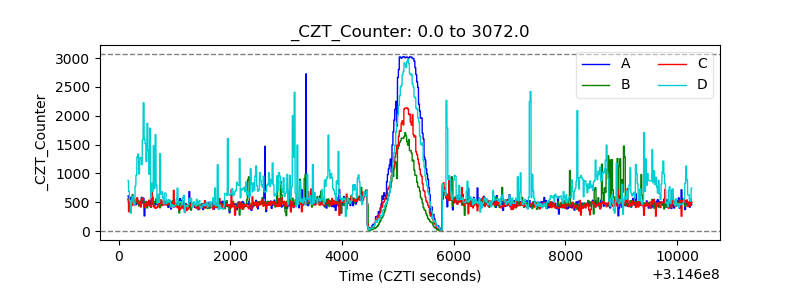 |
| +2.5 Volts monitor |  |
| +5 Volts monitor |  |
| _ROLL_ROT | 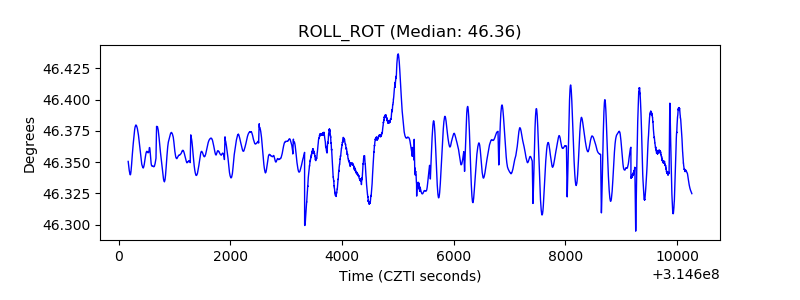 |
| _Roll_DEC | 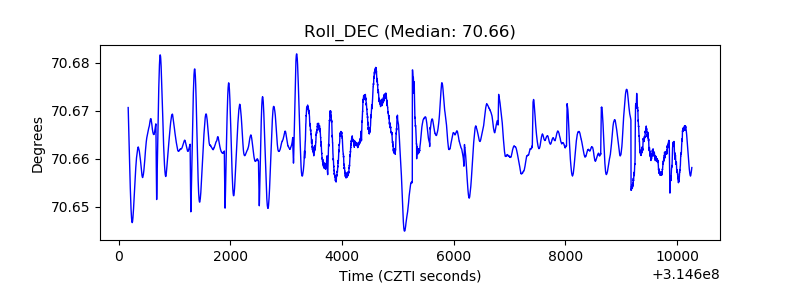 |
| _Roll_RA | 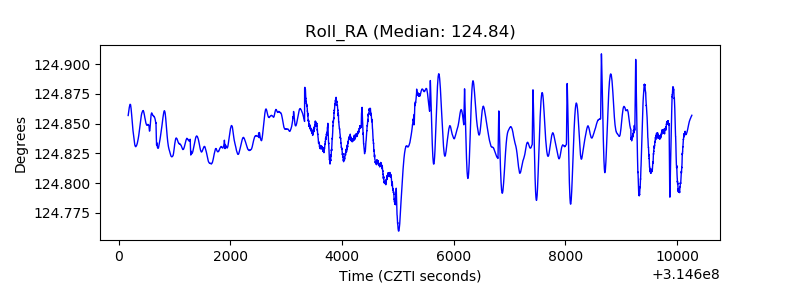 |
| Veto Counter | 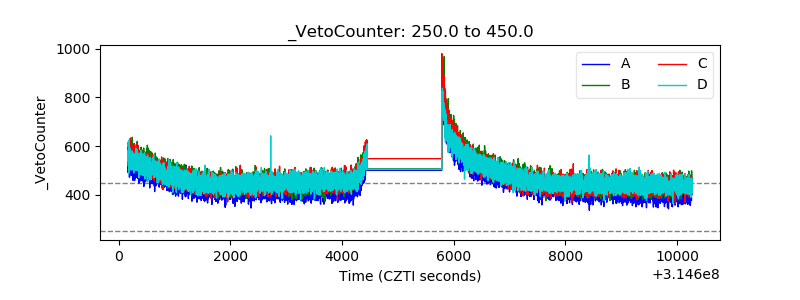 |