| Param | Original file | Final file |
|---|---|---|
| Filename | modeM0/AS1C05_013T03_9000003376cztM0_level2.fits | modeM0/AS1C05_013T03_9000003376cztM0_level2_quad_clean.evt |
| Size (bytes) | 76,386,240 | 74,332,800 |
| Size | 72.8 MB | 70.9 MB |
| Events in quadrant A | 467,098 | 439,935 |
| Events in quadrant B | 447,194 | 440,493 |
| Events in quadrant C | 456,724 | 423,502 |
| Events in quadrant D | 363,992 | 368,554 |
| Mode M9 | |||
|---|---|---|---|
| Quadrant | BADHDUFLAG | Total packets | Discarded packets |
| A | 0 | 14 | 0 |
| B | 0 | 14 | 0 |
| C | 0 | 14 | 0 |
| D | 0 | 14 | 0 |
| Mode M0 | |||
|---|---|---|---|
| Quadrant | BADHDUFLAG | Total packets | Discarded packets |
| A | 0 | 17145 | 0 |
| B | 0 | 17293 | 0 |
| C | 0 | 17108 | 0 |
| D | 0 | 30483 | 0 |
| Mode SS | |||
|---|---|---|---|
| Quadrant | BADHDUFLAG | Total packets | Discarded packets |
| A | 0 | 170 | 0 |
| B | 0 | 170 | 0 |
| C | 0 | 170 | 0 |
| D | 0 | 170 | 0 |
| Quadrant | Total seconds | Saturated seconds | Saturation percentage |
|---|---|---|---|
| A | 8320 | 25 | 0.300481% |
| B | 8320 | 46 | 0.552885% |
| C | 8320 | 69 | 0.829327% |
| D | 8320 | 1629 | 19.579327% |
Noise dominated data is calculated using 1-second bins in cleaned event files. If a bin has >2000 counts, and if more than 50% of those come from <1% of pixels, then it is considered to be noise-dominated and hence unusable.
| Quadrant | # 1 sec bins | Bins with >0 counts | Bins with >2000 counts | High rate bins dominated by noise | Noise dominated (total time) | Noise dominated (detector-on time) | Marked lightcurve |
|---|---|---|---|---|---|---|---|
| A | 9090 | 8320 | 0 | 0 | 0.00% | 0.00% | 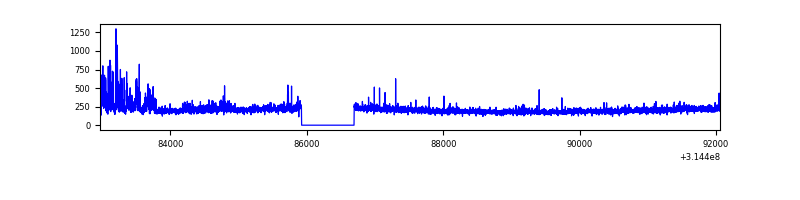 |
| B | 9090 | 8320 | 0 | 0 | 0.00% | 0.00% | 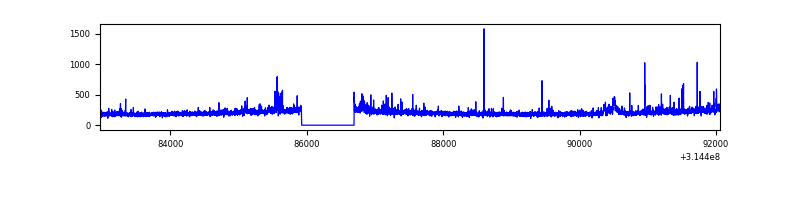 |
| C | 9090 | 8320 | 0 | 0 | 0.00% | 0.00% | 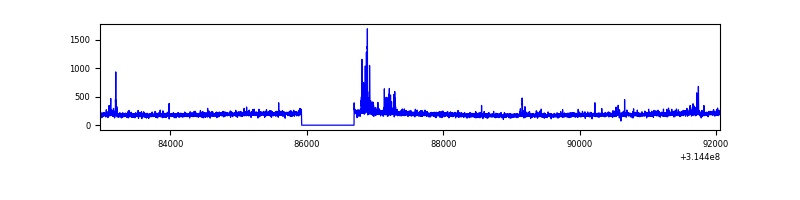 |
| D | 9090 | 8320 | 0 | 0 | 0.00% | 0.00% | 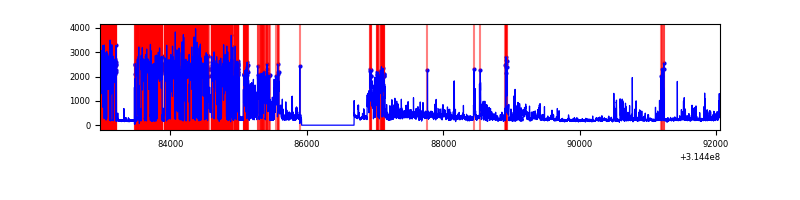 |
Top three noisy pixels from each quadrant. If the there are fewer than three noisy pixels in the level2.evt file, extra rows are filled as -1
| Pixel properties | Quadrant properties | ||||||
|---|---|---|---|---|---|---|---|
| Quadrant | DetID | PixID | Counts | Sigma | Mean | Median | Sigma |
| A | 0 | 29 | 430 | 9.82 | 121 | 114 | 32.2 |
| A | 7 | 110 | 394 | 8.7 | 121 | 114 | 32.2 |
| A | 9 | 19 | 363 | 7.74 | 121 | 114 | 32.2 |
| B | 2 | 9 | 371 | 10.05 | 118 | 112 | 25.8 |
| B | 2 | 8 | 312 | 7.76 | 118 | 112 | 25.8 |
| B | 5 | 232 | 312 | 7.76 | 118 | 112 | 25.8 |
| C | 1 | 81 | 370 | 7.91 | 120 | 113 | 32.5 |
| C | 1 | 80 | 359 | 7.58 | 120 | 113 | 32.5 |
| C | 2 | 191 | 332 | 6.74 | 120 | 113 | 32.5 |
| D | 3 | 14 | 285 | 6.43 | 103 | 94 | 29.7 |
| D | 15 | 46 | 280 | 6.26 | 103 | 94 | 29.7 |
| D | 10 | 189 | 280 | 6.26 | 103 | 94 | 29.7 |
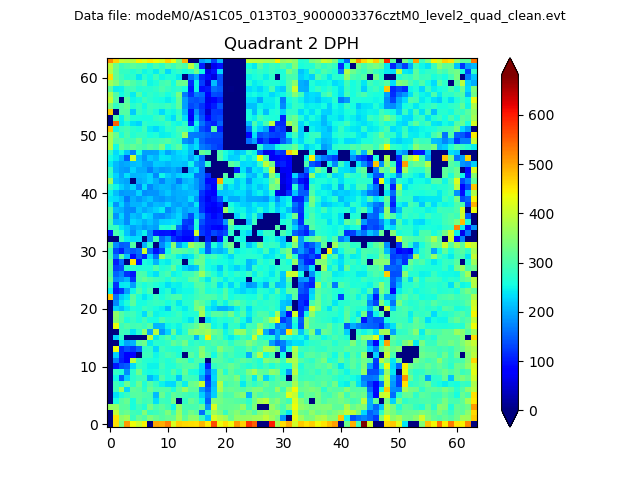
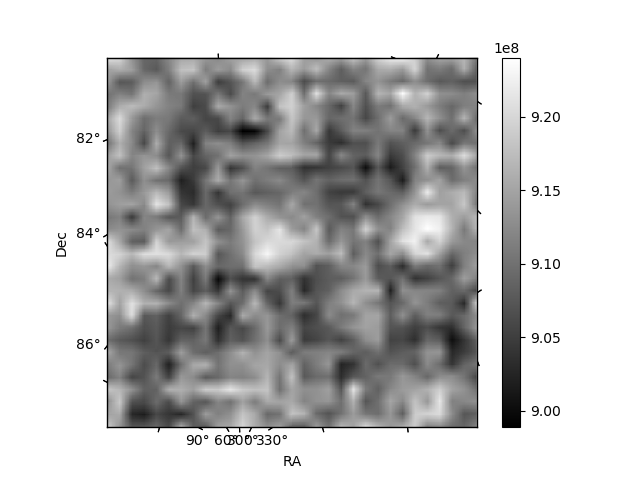
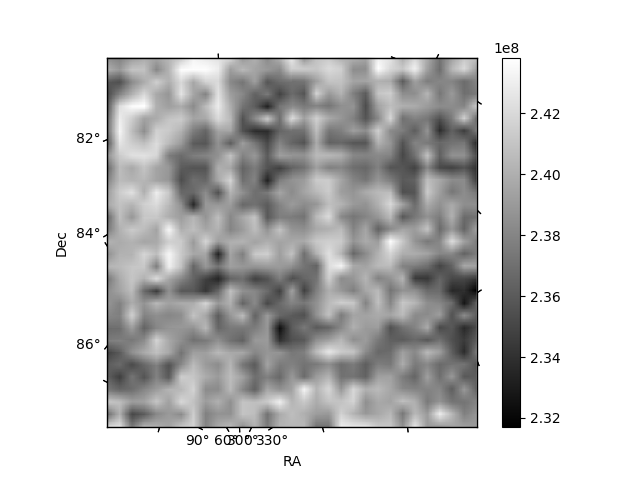
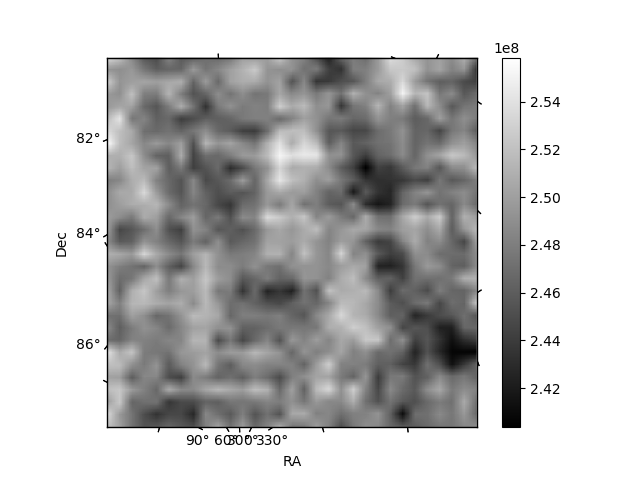
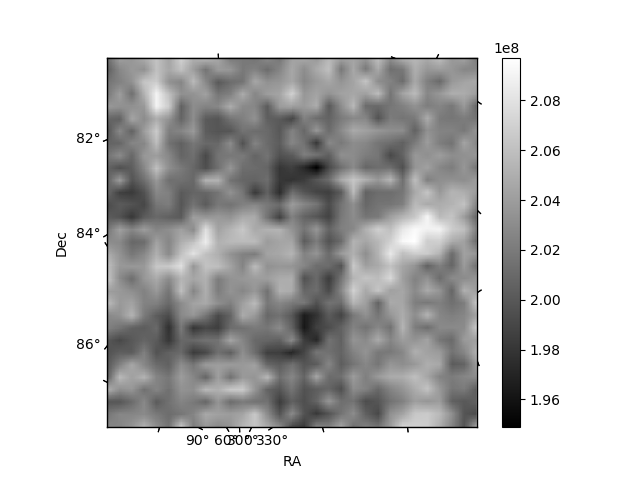
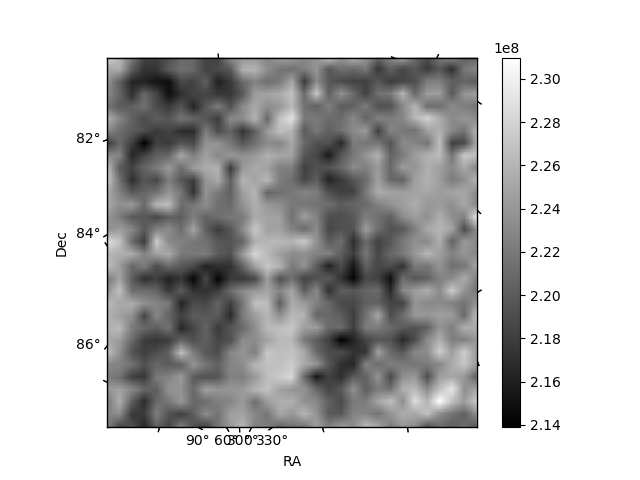
Histogram calculated using DETX and DETY for each event in the final _common_clean file
| Quadrant A | 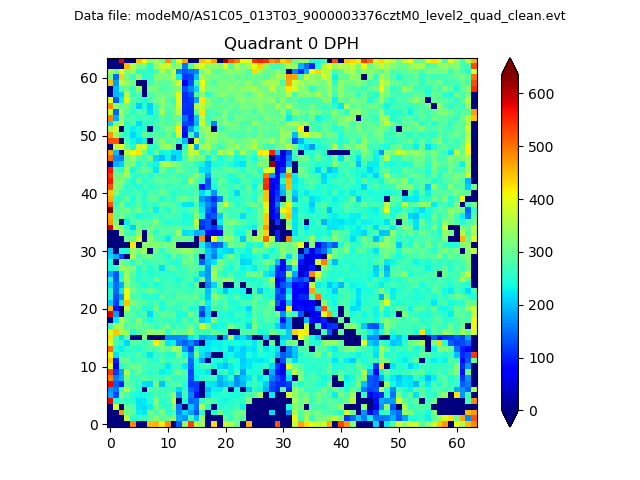 |
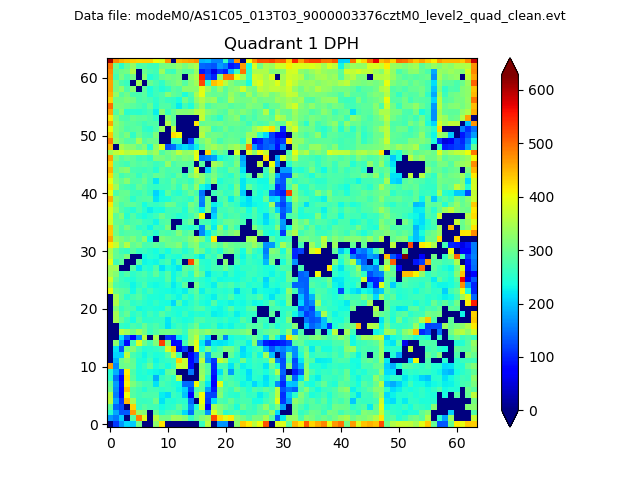 |
Quadrant B |
|---|---|---|---|
| Quadrant D | 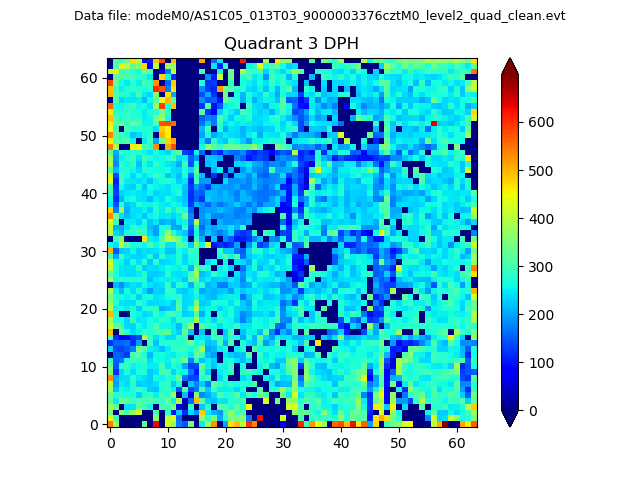 |
 |
Quadrant C |
| Plot type | Count rate plots | Images |
|---|---|---|
| Comparison with Poisson distribution Blue bars denote a histogram of data divided into 1 sec bins. Red curve is a Poisson curve with rate = median count rate of data. |
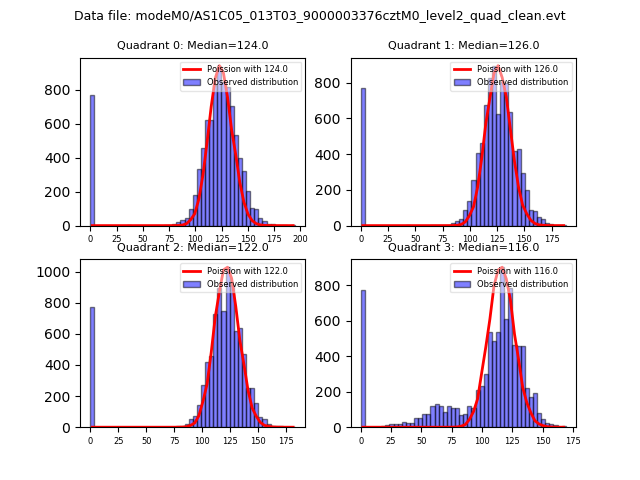 |
 |
| Quadrant-wise count rates Data is divided into 100 sec bins |
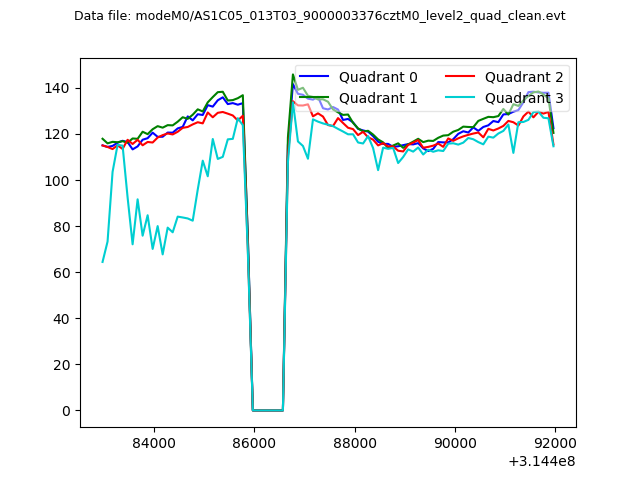 |
|
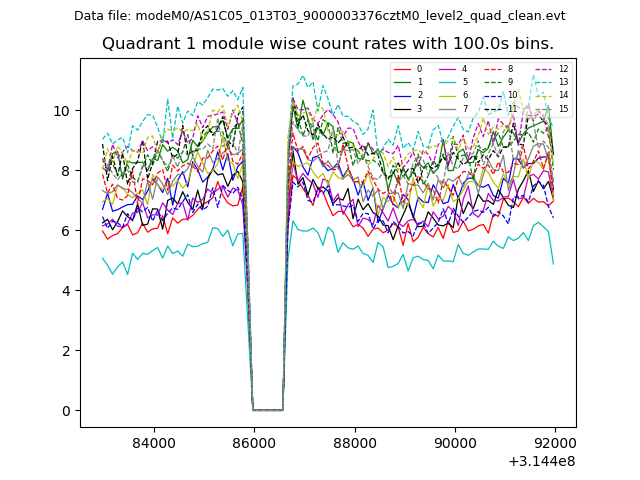
| Module-wise count rates for Quadrant A Data is divided into 100 sec bins |
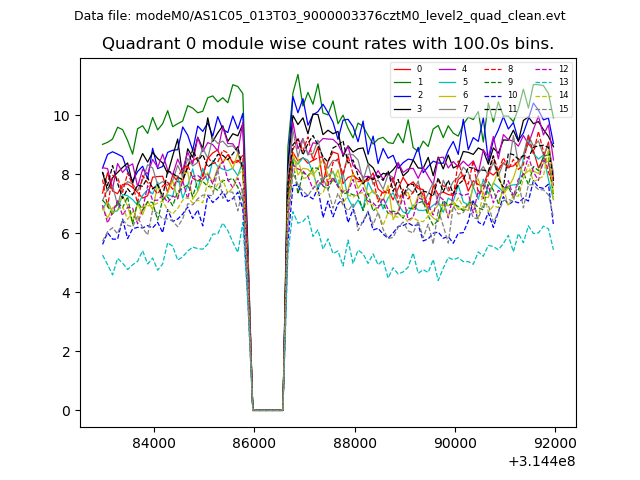 |
 |
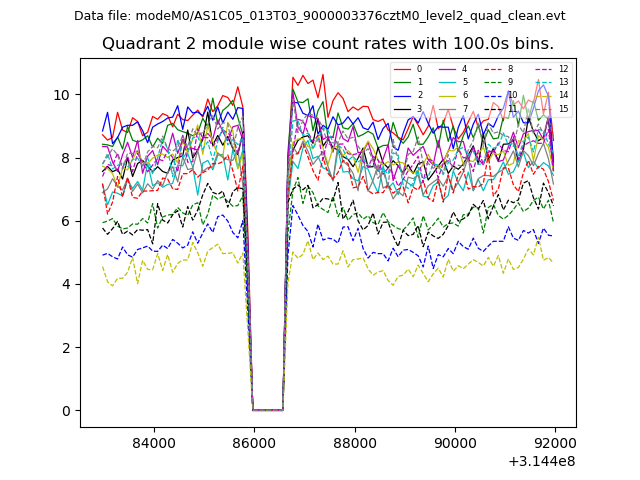
| Module-wise count rates for Quadrant B Data is divided into 100 sec bins |
 |
 |
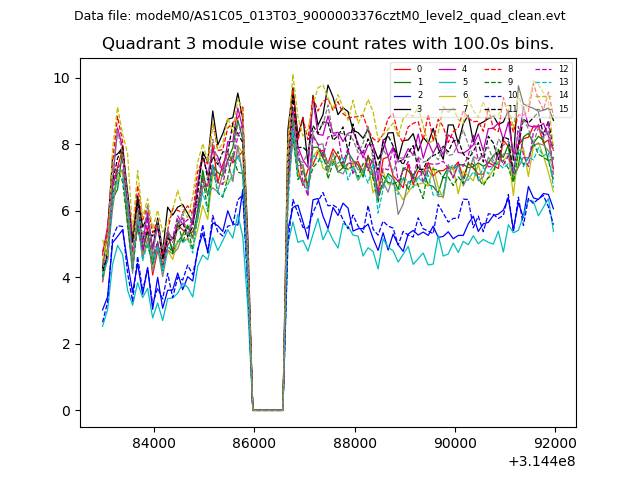
| Module-wise count rates for Quadrant C Data is divided into 100 sec bins |
 |
 |
| Module-wise count rates for Quadrant D Data is divided into 100 sec bins |
 |
 |
| Parameter | Plot |
|---|---|
| CZT HV Monitor | 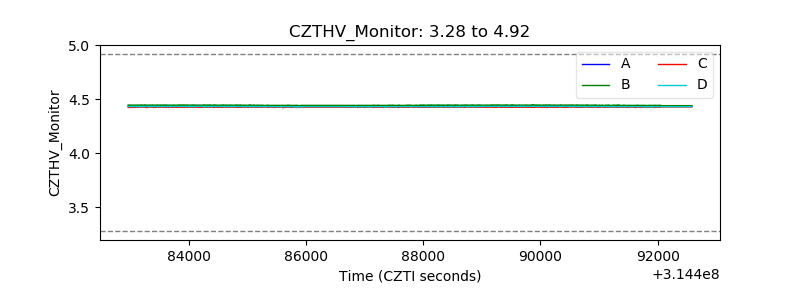 |
| D_VDD | 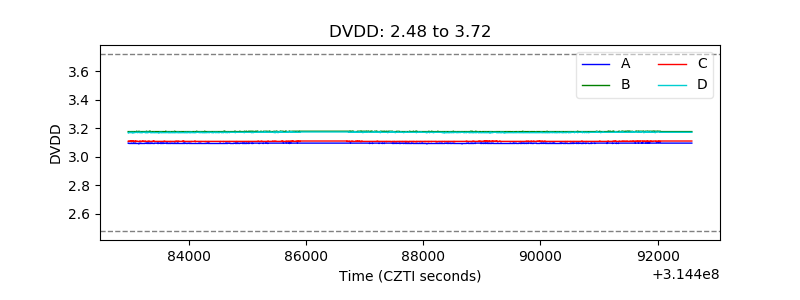 |
| Temperature 1 | 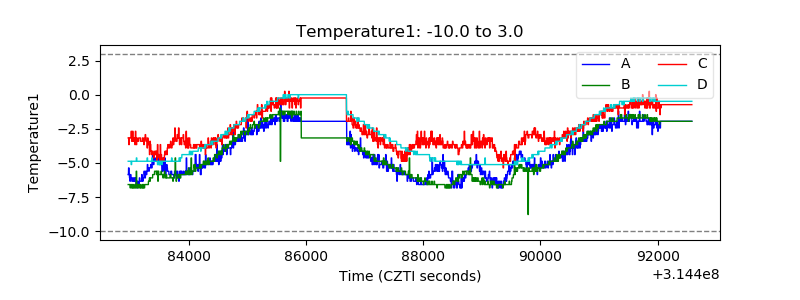 |
| Veto HV Monitor | 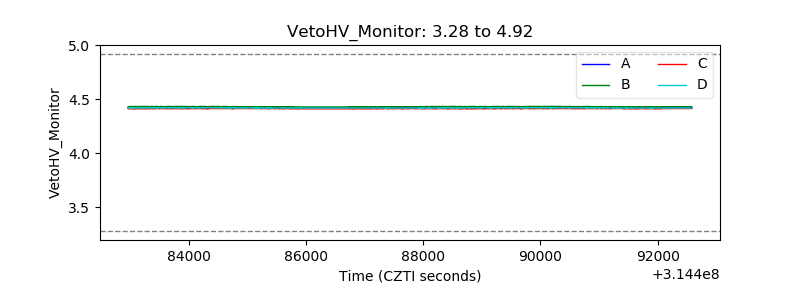 |
| Veto LLD | 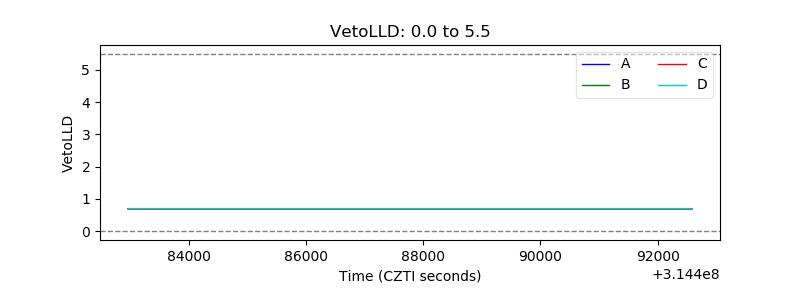 |
| Alpha Counter | 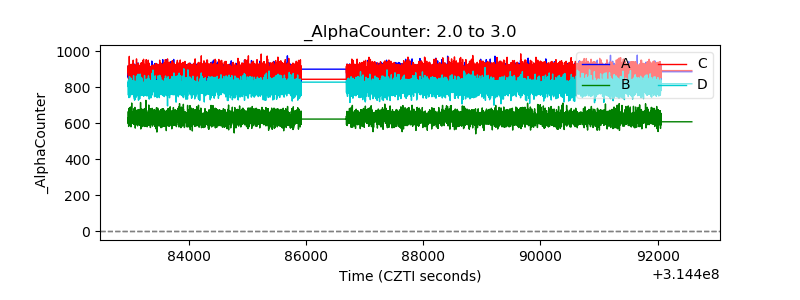 |
| _CPM_Rate | 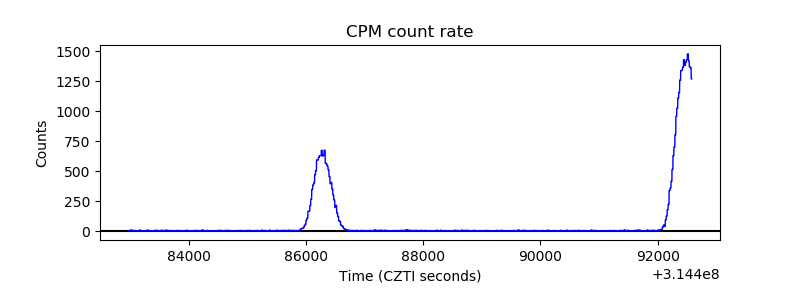 |
| CZT Counter | 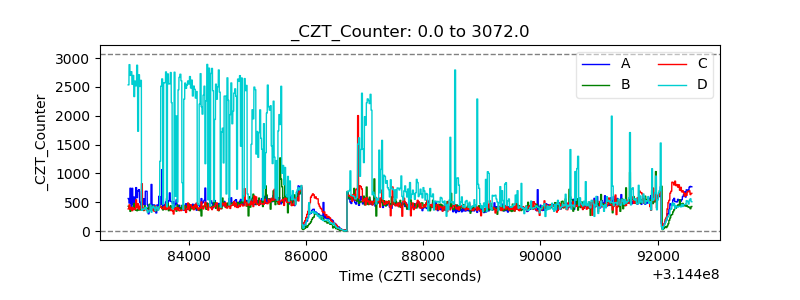 |
| +2.5 Volts monitor | 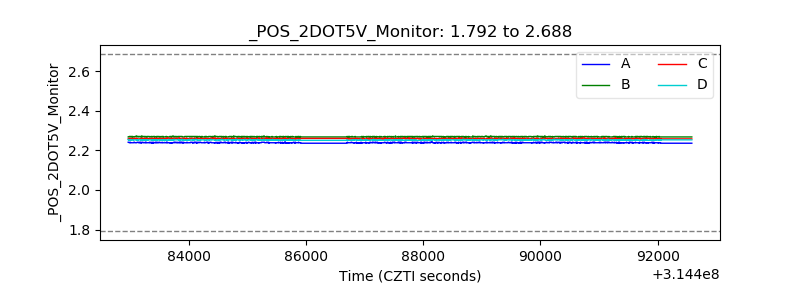 |
| +5 Volts monitor | 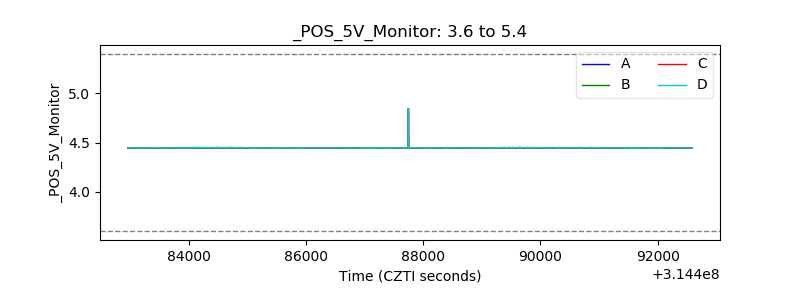 |
| _ROLL_ROT | 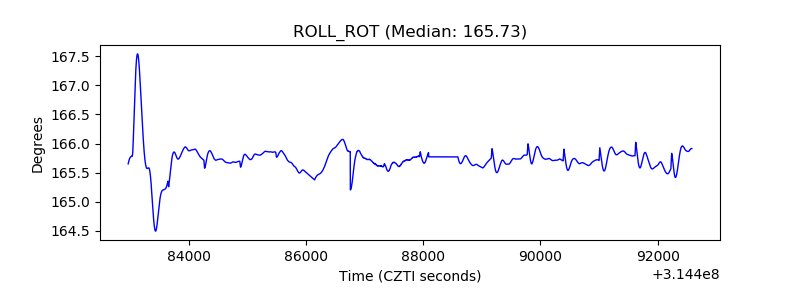 |
| _Roll_DEC | 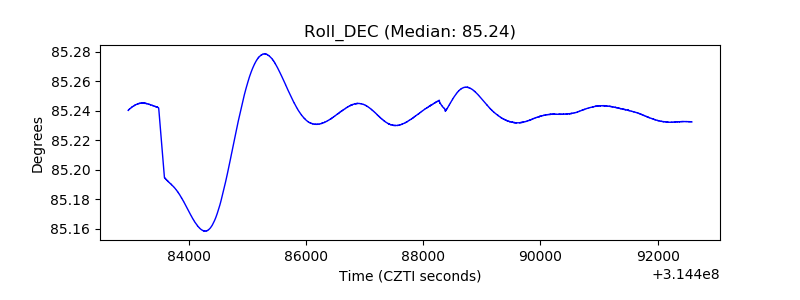 |
| _Roll_RA | 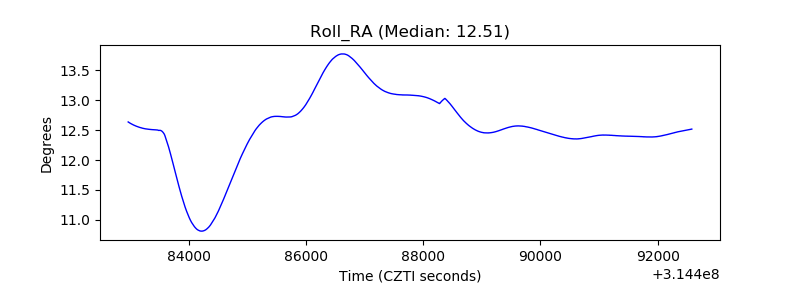 |
| Veto Counter | 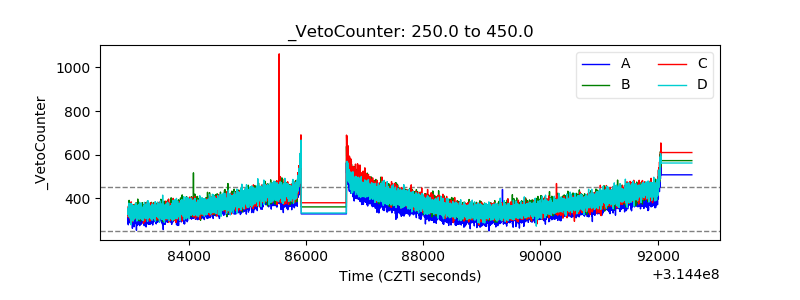 |