| Param | Original file | Final file |
|---|---|---|
| Filename | modeM0/AS1C05_013T03_9000003376_22849cztM0_level2.evt | modeM0/AS1C05_013T03_9000003376_22849cztM0_level2_quad_clean.evt |
| Size (bytes) | 428,958,720 | 82,512,000 |
| Size | 409.1 MB | 78.7 MB |
| Events in quadrant A | 2,235,825 | 571,766 |
| Events in quadrant B | 2,163,208 | 580,913 |
| Events in quadrant C | 2,152,873 | 558,175 |
| Events in quadrant D | 6,131,751 | 469,756 |
| Mode M9 | |||
|---|---|---|---|
| Quadrant | BADHDUFLAG | Total packets | Discarded packets |
| A | 0 | 8 | 0 |
| B | 0 | 8 | 0 |
| C | 0 | 8 | 0 |
| D | 0 | 8 | 0 |
| Mode M0 | |||
|---|---|---|---|
| Quadrant | BADHDUFLAG | Total packets | Discarded packets |
| A | 0 | 9453 | 1 |
| B | 0 | 9416 | 1 |
| C | 0 | 9378 | 1 |
| D | 0 | 21420 | 1 |
| Mode SS | |||
|---|---|---|---|
| Quadrant | BADHDUFLAG | Total packets | Discarded packets |
| A | 0 | 92 | 0 |
| B | 0 | 92 | 0 |
| C | 0 | 92 | 0 |
| D | 0 | 92 | 0 |
| Quadrant | Total seconds | Saturated seconds | Saturation percentage |
|---|---|---|---|
| A | 4516 | 16 | 0.354296% |
| B | 4516 | 30 | 0.664305% |
| C | 4516 | 38 | 0.841453% |
| D | 4516 | 1567 | 34.698849% |
Noise dominated data is calculated using 1-second bins in cleaned event files. If a bin has >2000 counts, and if more than 50% of those come from <1% of pixels, then it is considered to be noise-dominated and hence unusable.
| Quadrant | # 1 sec bins | Bins with >0 counts | Bins with >2000 counts | High rate bins dominated by noise | Noise dominated (total time) | Noise dominated (detector-on time) | Marked lightcurve |
|---|---|---|---|---|---|---|---|
| A | 5286 | 4517 | 0 | 0 | 0.00% | 0.00% | 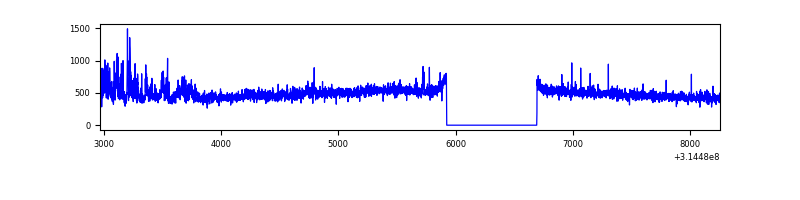 |
| B | 5286 | 4517 | 0 | 0 | 0.00% | 0.00% | 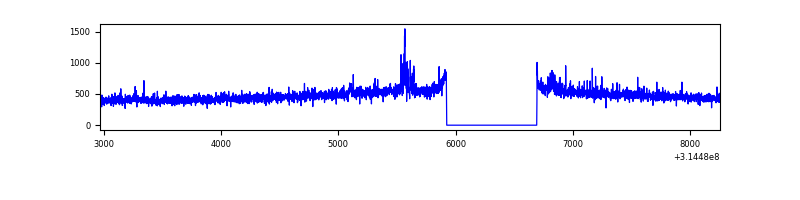 |
| C | 5286 | 4517 | 1 | 1 | 0.02% | 0.02% | 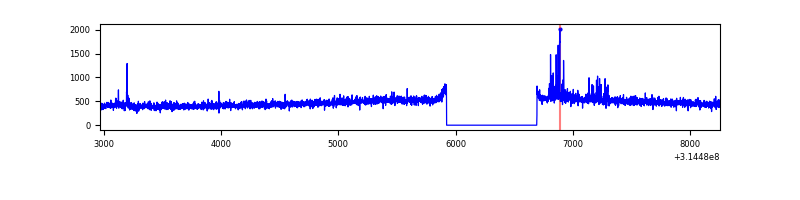 |
| D | 5286 | 4517 | 1385 | 1385 | 26.20% | 30.66% | 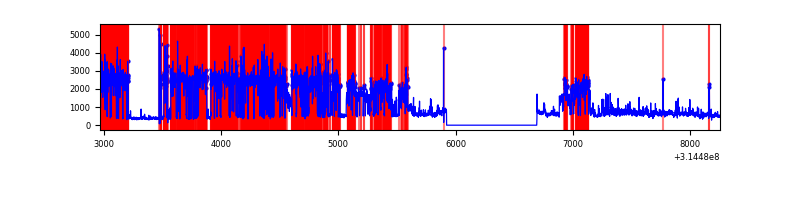 |
Top three noisy pixels from each quadrant. If the there are fewer than three noisy pixels in the level2.evt file, extra rows are filled as -1
| Pixel properties | Quadrant properties | ||||||
|---|---|---|---|---|---|---|---|
| Quadrant | DetID | PixID | Counts | Sigma | Mean | Median | Sigma |
| A | 11 | 47 | 131924 | 1198.86 | 539 | 528 | 109.6 |
| A | 13 | 252 | 20432 | 181.61 | 539 | 528 | 109.6 |
| A | 13 | 254 | 7993 | 68.11 | 539 | 528 | 109.6 |
| B | 0 | 190 | 35338 | 338.26 | 537 | 524 | 102.9 |
| B | 12 | 111 | 12325 | 114.66 | 537 | 524 | 102.9 |
| B | 11 | 111 | 10632 | 98.21 | 537 | 524 | 102.9 |
| C | 14 | 238 | 81648 | 669.51 | 517 | 519 | 121.2 |
| C | 7 | 247 | 40636 | 331.06 | 517 | 519 | 121.2 |
| C | 2 | 16 | 15306 | 122.03 | 517 | 519 | 121.2 |
| D | 1 | 52 | 3851559 | 32766.33 | 472 | 457 | 117.5 |
| D | 1 | 239 | 312511 | 2655.05 | 472 | 457 | 117.5 |
| D | 9 | 85 | 43316 | 364.66 | 472 | 457 | 117.5 |
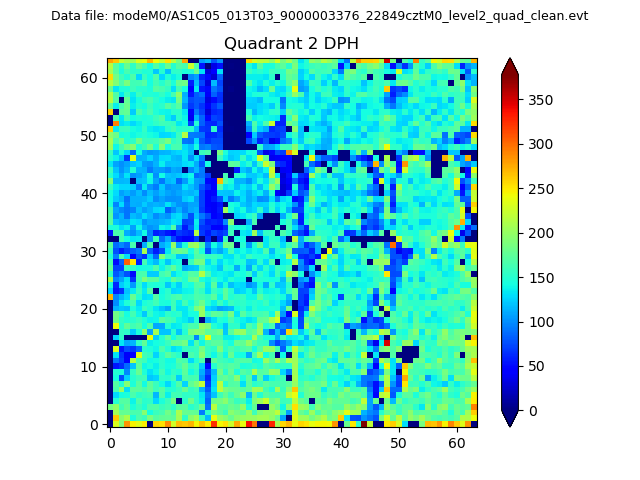
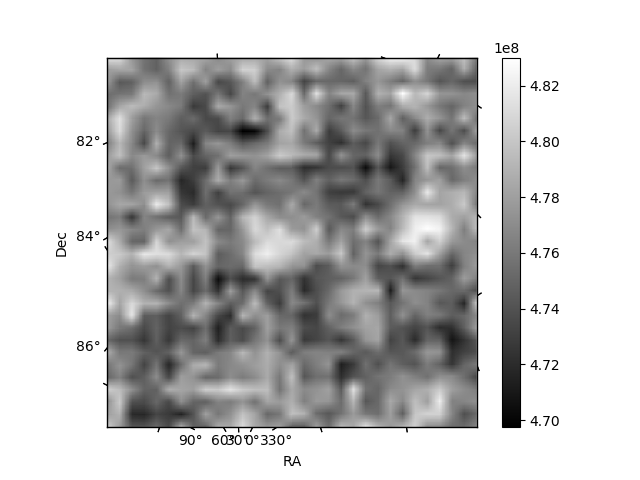
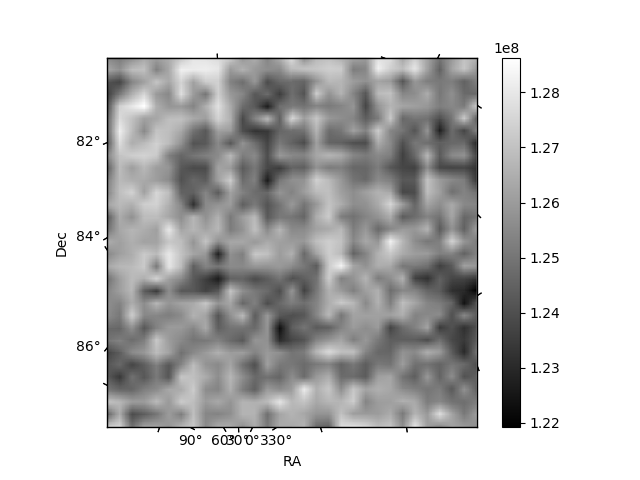
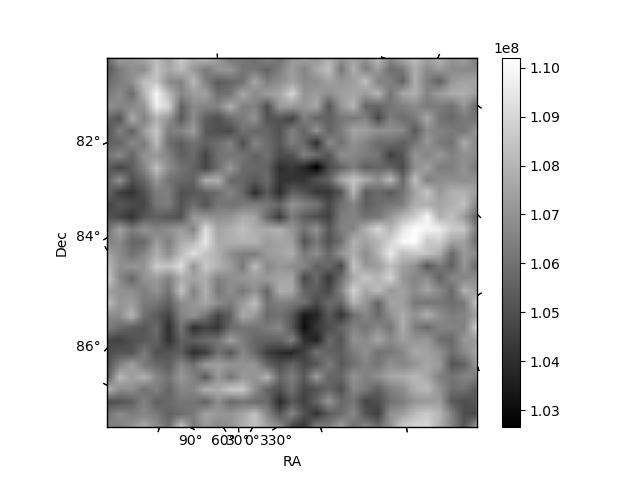
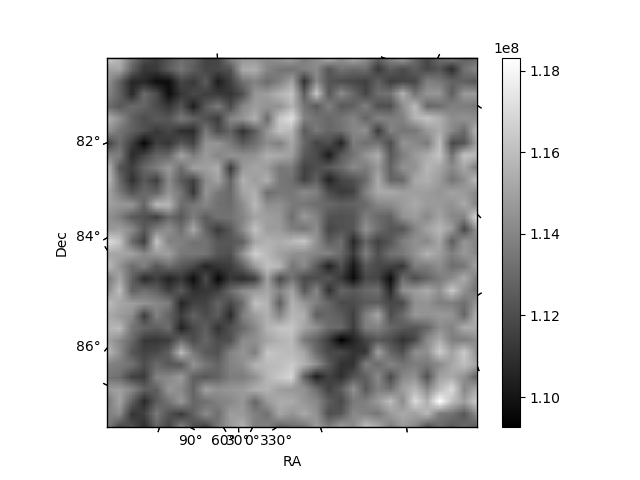
Histogram calculated using DETX and DETY for each event in the final _common_clean file
| Quadrant A | 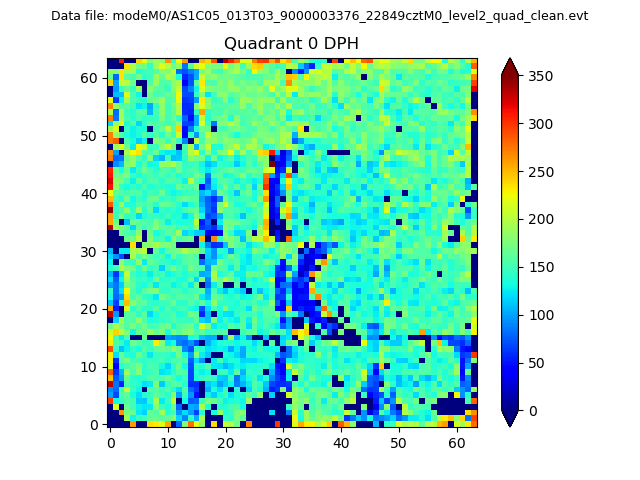 |
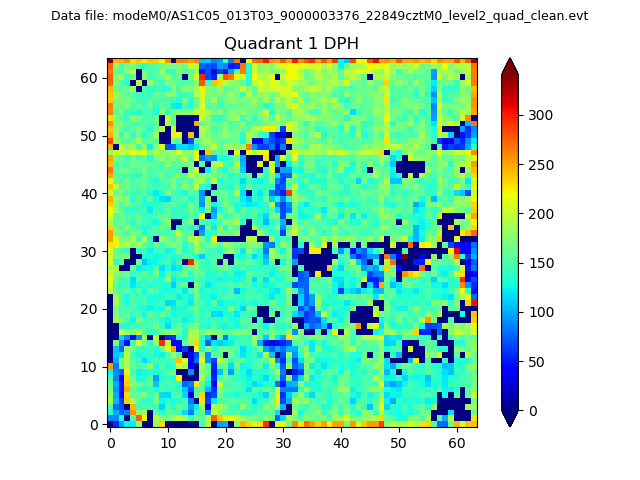 |
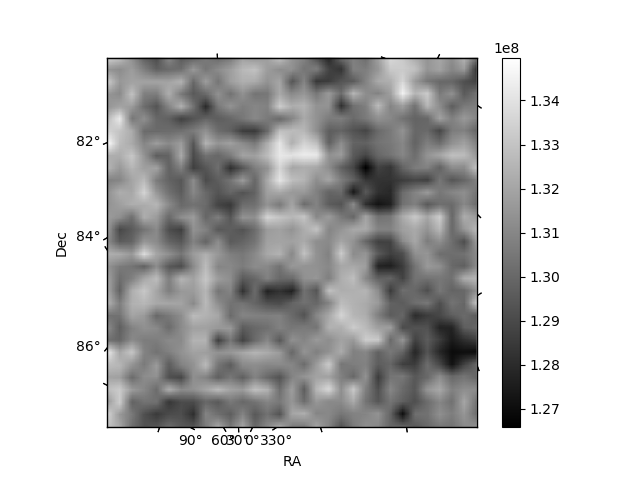
Quadrant B |
|---|---|---|---|
| Quadrant D | 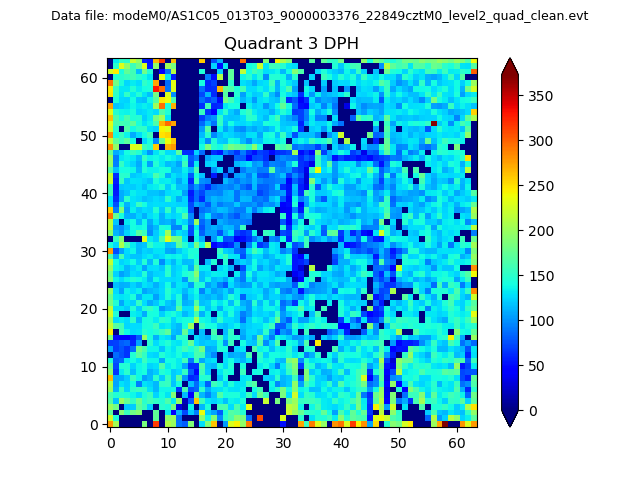 |
 |
Quadrant C |
| Plot type | Count rate plots | Images |
|---|---|---|
| Comparison with Poisson distribution Blue bars denote a histogram of data divided into 1 sec bins. Red curve is a Poisson curve with rate = median count rate of data. |
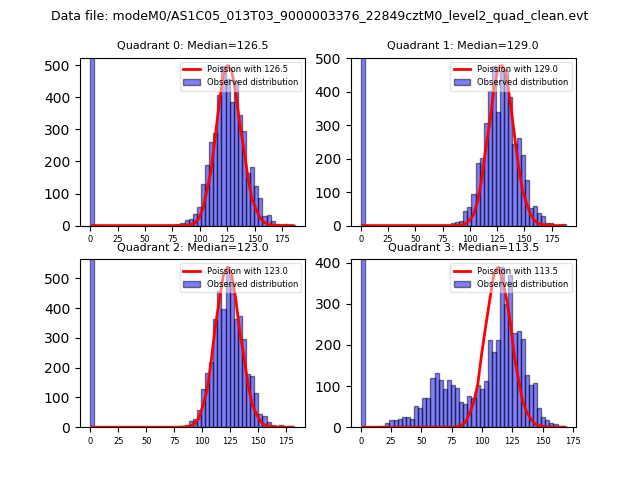 |
 |
| Quadrant-wise count rates Data is divided into 100 sec bins |
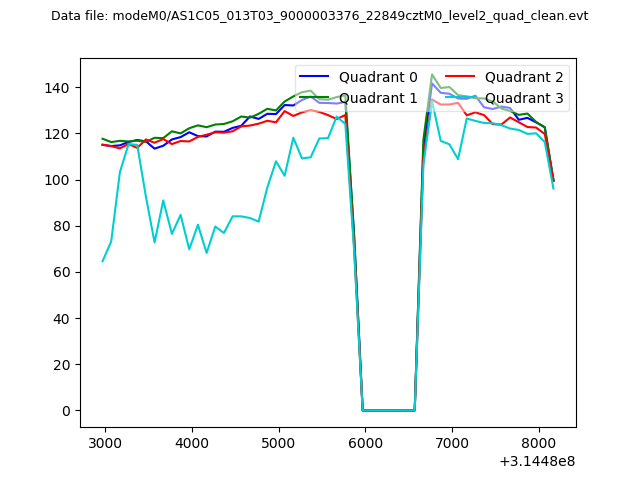 |
|
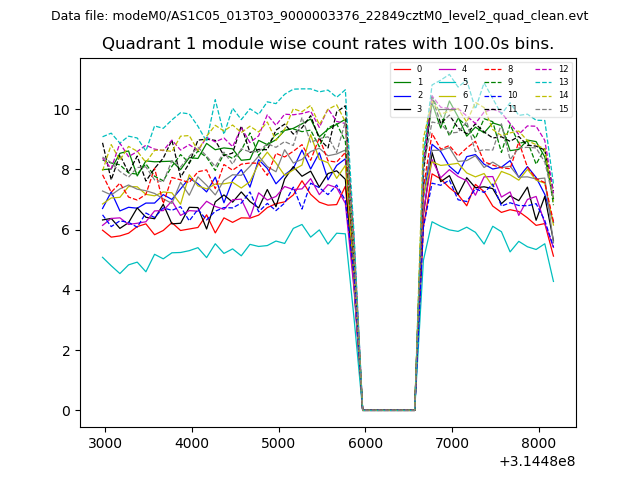
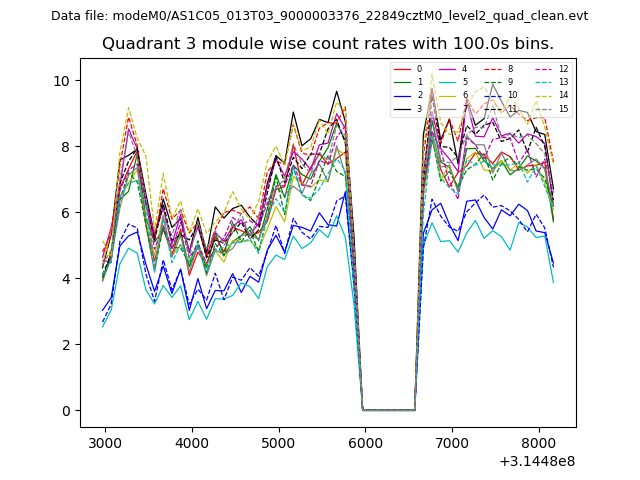
| Module-wise count rates for Quadrant A Data is divided into 100 sec bins |
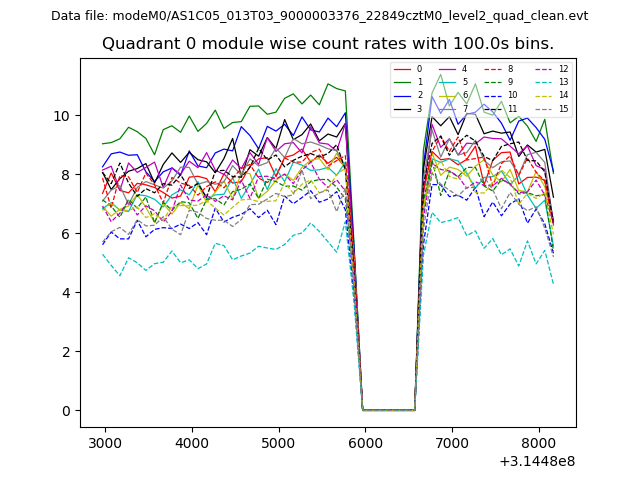 |
 |
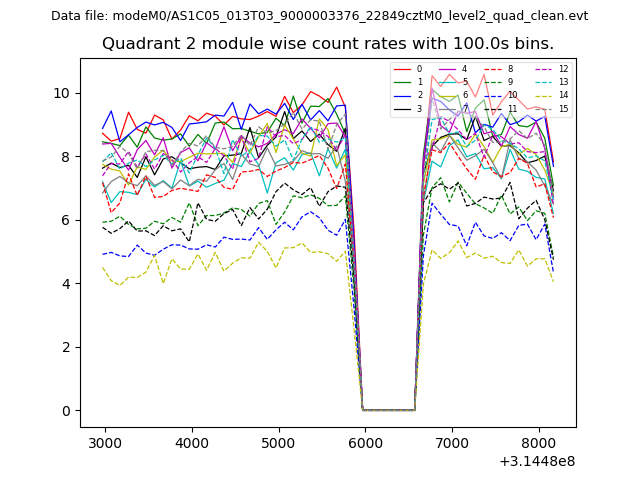
| Module-wise count rates for Quadrant B Data is divided into 100 sec bins |
 |
 |
| Module-wise count rates for Quadrant C Data is divided into 100 sec bins |
 |
 |
| Module-wise count rates for Quadrant D Data is divided into 100 sec bins |
 |
 |
| Parameter | Plot |
|---|---|
| CZT HV Monitor | 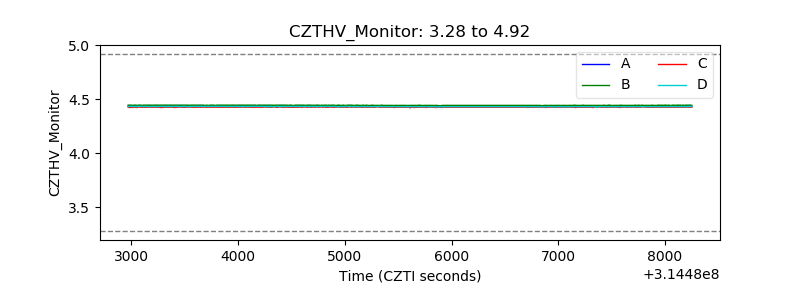 |
| D_VDD | 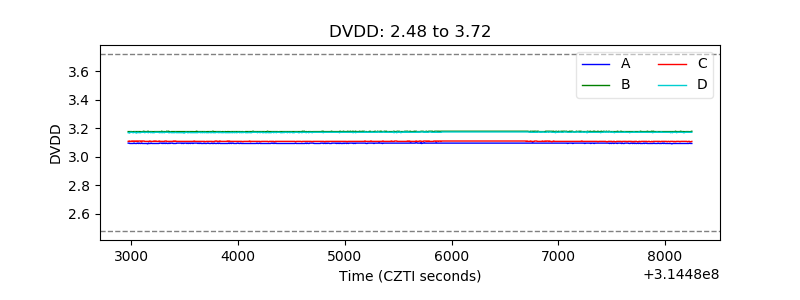 |
| Temperature 1 | 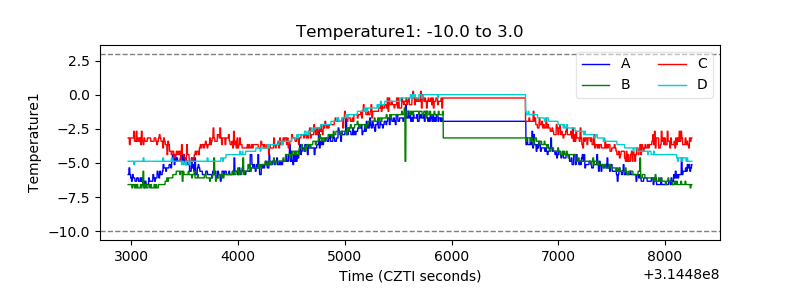 |
| Veto HV Monitor | 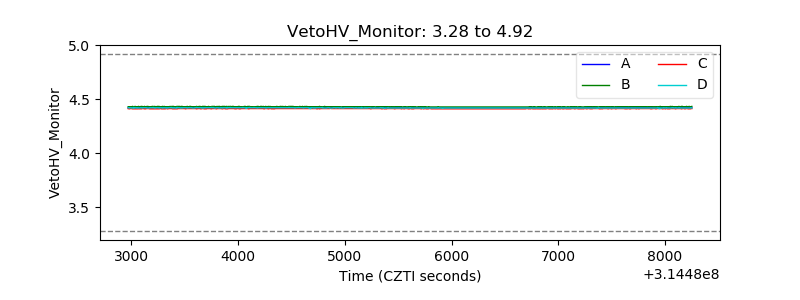 |
| Veto LLD | 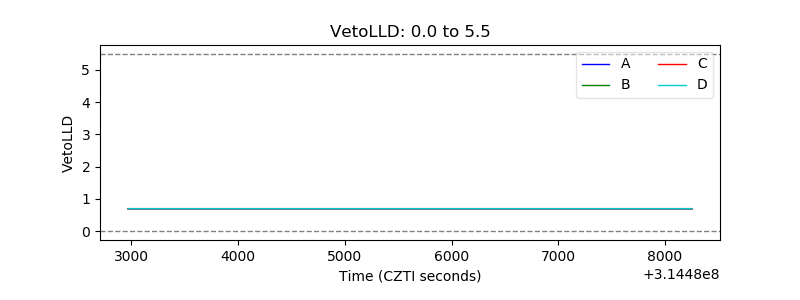 |
| Alpha Counter |  |
| _CPM_Rate | 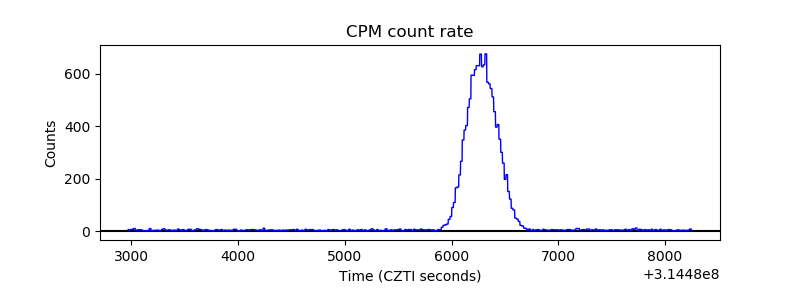 |
| CZT Counter | 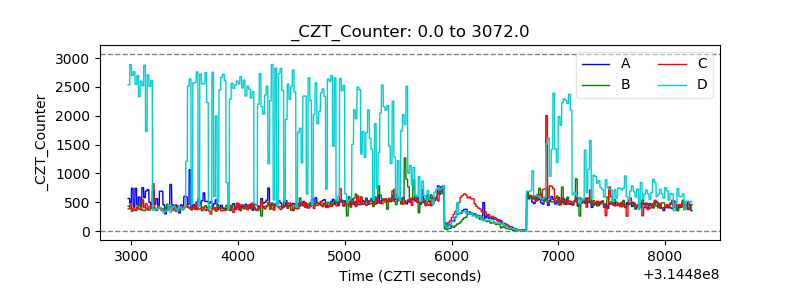 |
| +2.5 Volts monitor |  |
| +5 Volts monitor |  |
| _ROLL_ROT | 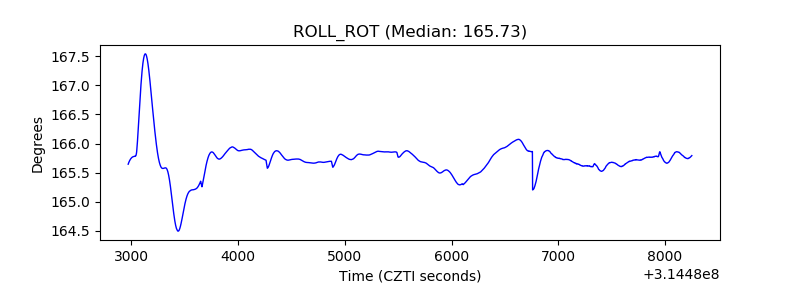 |
| _Roll_DEC | 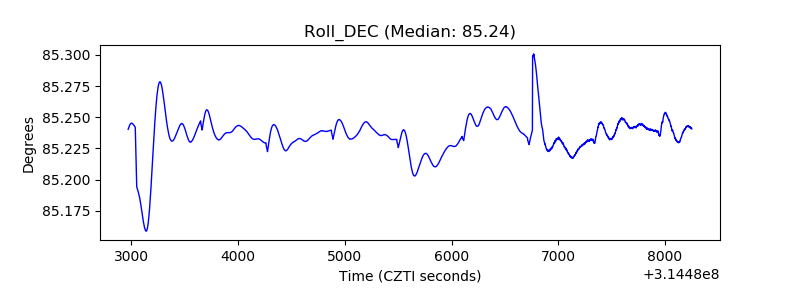 |
| _Roll_RA | 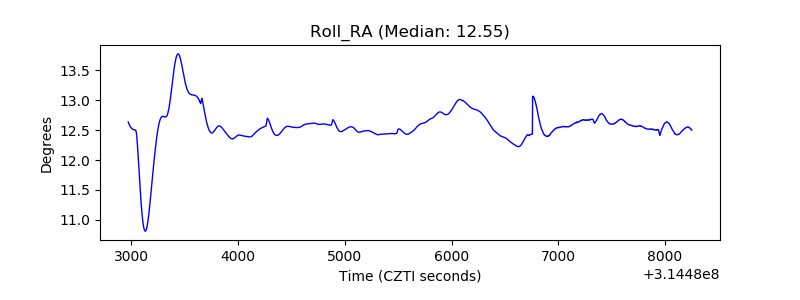 |
| Veto Counter | 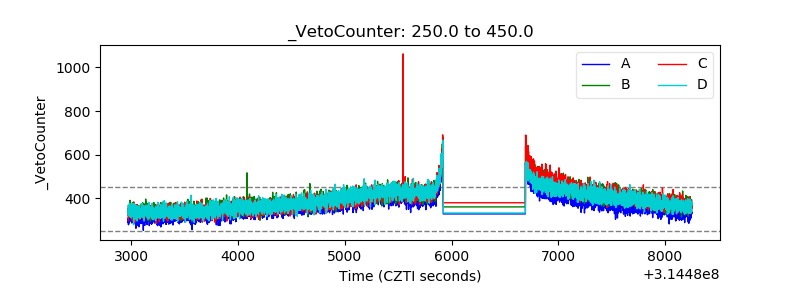 |