| Param | Original file | Final file |
|---|---|---|
| Filename | modeM0/AS1C05_013T03_9000003376_22850cztM0_level2.evt | modeM0/AS1C05_013T03_9000003376_22850cztM0_level2_quad_clean.evt |
| Size (bytes) | 677,597,760 | 151,920,000 |
| Size | 646.2 MB | 144.9 MB |
| Events in quadrant A | 3,906,798 | 1,039,242 |
| Events in quadrant B | 3,909,956 | 1,053,200 |
| Events in quadrant C | 3,825,233 | 1,014,289 |
| Events in quadrant D | 8,315,313 | 916,346 |
| Mode M9 | |||
|---|---|---|---|
| Quadrant | BADHDUFLAG | Total packets | Discarded packets |
| A | 0 | 12 | 0 |
| B | 0 | 12 | 0 |
| C | 0 | 12 | 0 |
| D | 0 | 12 | 0 |
| Mode M0 | |||
|---|---|---|---|
| Quadrant | BADHDUFLAG | Total packets | Discarded packets |
| A | 0 | 17145 | 0 |
| B | 0 | 17293 | 0 |
| C | 0 | 17108 | 0 |
| D | 0 | 30483 | 0 |
| Mode SS | |||
|---|---|---|---|
| Quadrant | BADHDUFLAG | Total packets | Discarded packets |
| A | 0 | 168 | 0 |
| B | 0 | 168 | 0 |
| C | 0 | 168 | 0 |
| D | 0 | 168 | 0 |
| Quadrant | Total seconds | Saturated seconds | Saturation percentage |
|---|---|---|---|
| A | 8320 | 25 | 0.300481% |
| B | 8320 | 46 | 0.552885% |
| C | 8320 | 69 | 0.829327% |
| D | 8320 | 1629 | 19.579327% |
Noise dominated data is calculated using 1-second bins in cleaned event files. If a bin has >2000 counts, and if more than 50% of those come from <1% of pixels, then it is considered to be noise-dominated and hence unusable.
| Quadrant | # 1 sec bins | Bins with >0 counts | Bins with >2000 counts | High rate bins dominated by noise | Noise dominated (total time) | Noise dominated (detector-on time) | Marked lightcurve |
|---|---|---|---|---|---|---|---|
| A | 9090 | 8321 | 0 | 0 | 0.00% | 0.00% | 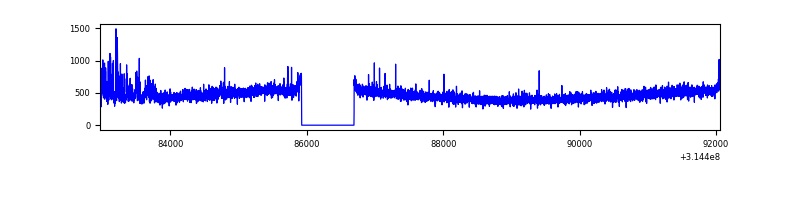 |
| B | 9090 | 8321 | 1 | 1 | 0.01% | 0.01% | 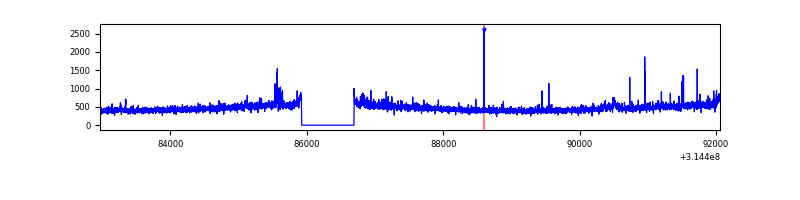 |
| C | 9090 | 8321 | 1 | 1 | 0.01% | 0.01% | 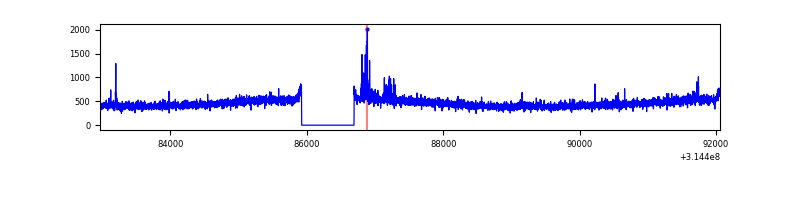 |
| D | 9090 | 8321 | 1431 | 1431 | 15.74% | 17.20% | 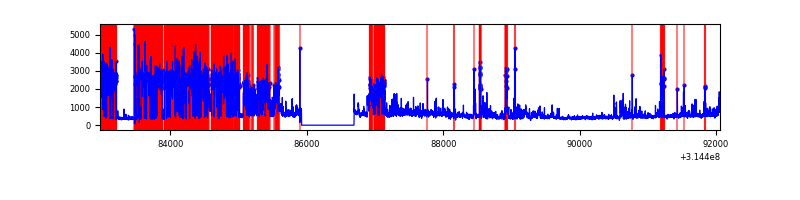 |
Top three noisy pixels from each quadrant. If the there are fewer than three noisy pixels in the level2.evt file, extra rows are filled as -1
| Pixel properties | Quadrant properties | ||||||
|---|---|---|---|---|---|---|---|
| Quadrant | DetID | PixID | Counts | Sigma | Mean | Median | Sigma |
| A | 11 | 47 | 132597 | 675.29 | 971 | 952 | 194.9 |
| A | 13 | 252 | 21167 | 103.7 | 971 | 952 | 194.9 |
| A | 13 | 254 | 14742 | 70.74 | 971 | 952 | 194.9 |
| B | 0 | 190 | 60668 | 322.93 | 966 | 943 | 184.9 |
| B | 0 | 229 | 36419 | 191.81 | 966 | 943 | 184.9 |
| B | 12 | 111 | 21987 | 113.78 | 966 | 943 | 184.9 |
| C | 14 | 238 | 146769 | 676.83 | 927 | 933 | 215.5 |
| C | 7 | 247 | 52153 | 237.71 | 927 | 933 | 215.5 |
| C | 2 | 16 | 16759 | 73.45 | 927 | 933 | 215.5 |
| D | 1 | 52 | 4188487 | 19388.15 | 887 | 861 | 216.0 |
| D | 1 | 239 | 403313 | 1863.3 | 887 | 861 | 216.0 |
| D | 9 | 85 | 116169 | 533.86 | 887 | 861 | 216.0 |
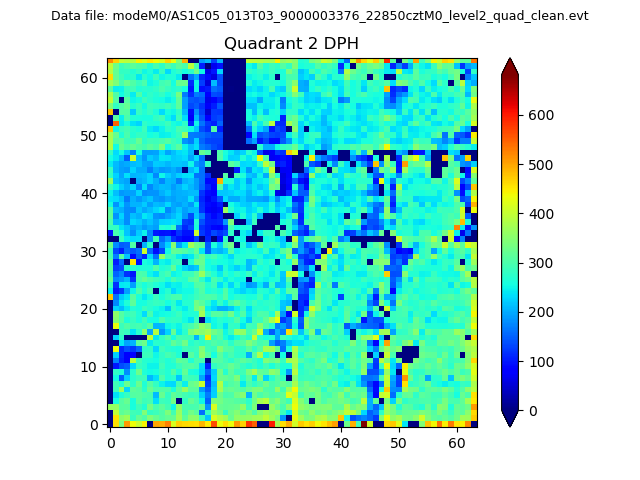
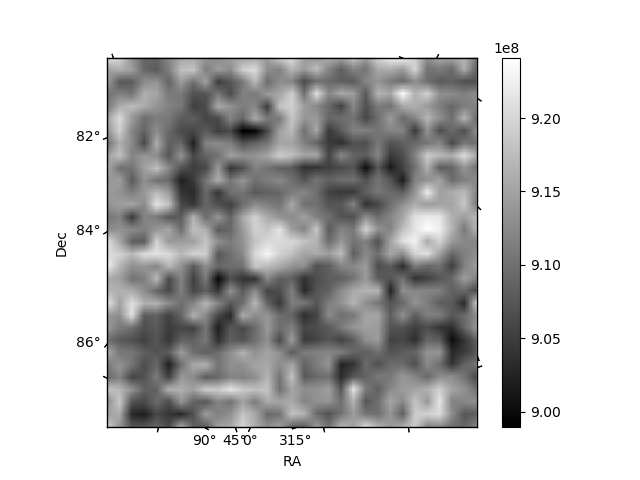
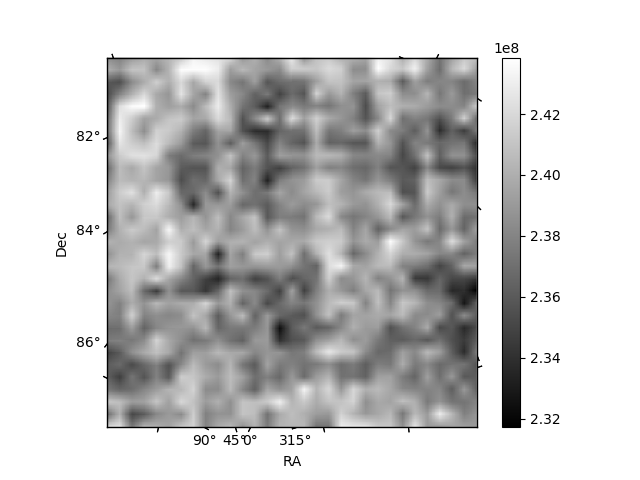
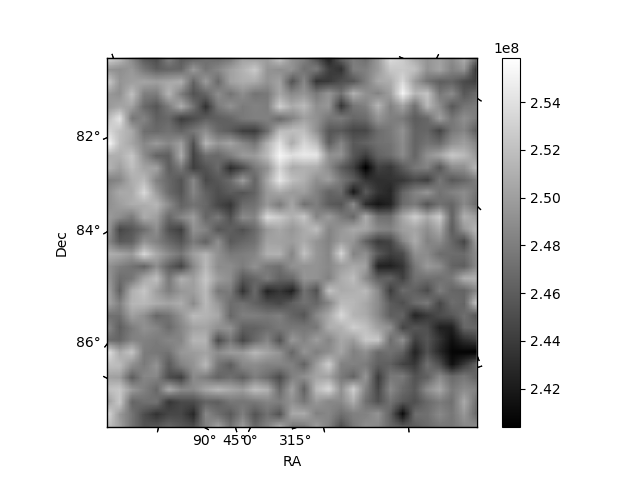
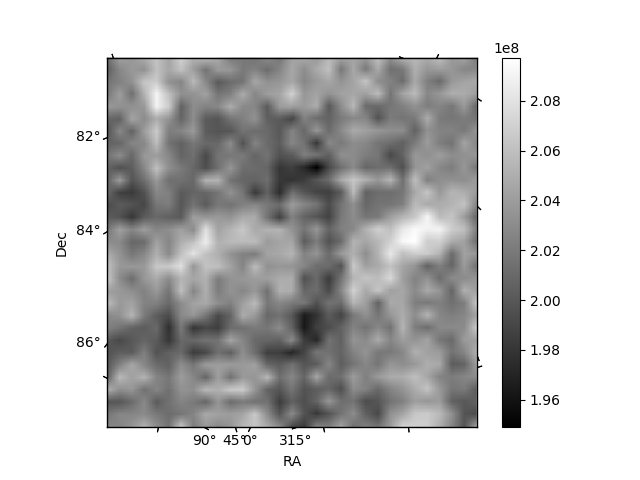
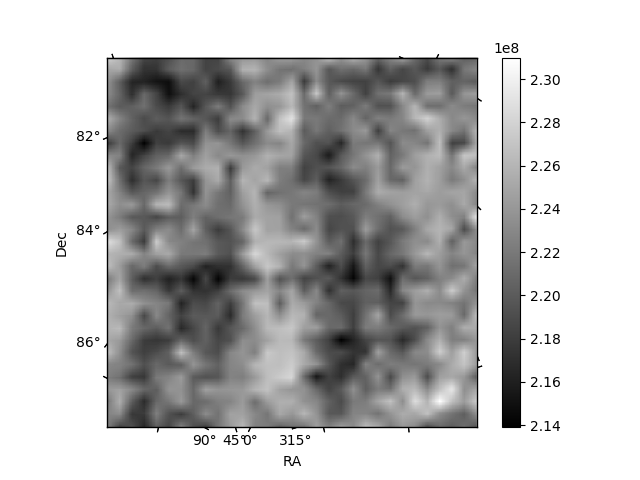
Histogram calculated using DETX and DETY for each event in the final _common_clean file
| Quadrant A | 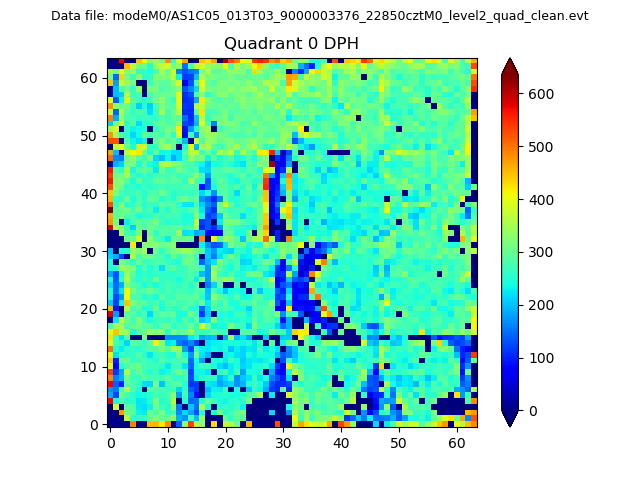 |
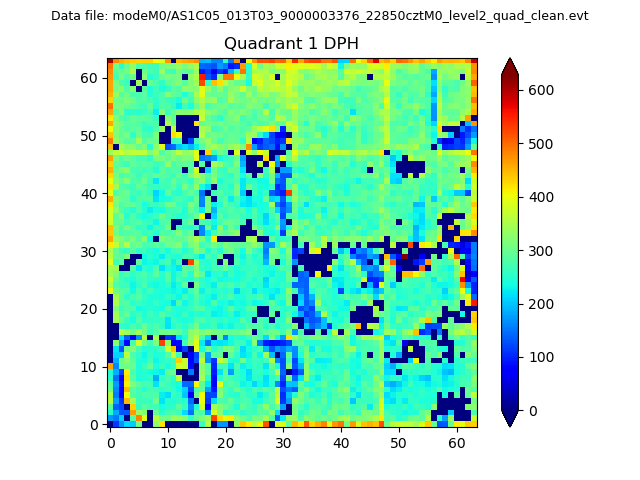 |
Quadrant B |
|---|---|---|---|
| Quadrant D | 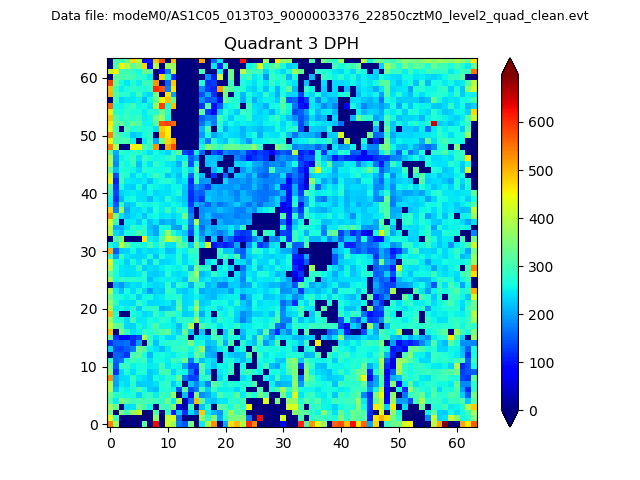 |
 |
Quadrant C |
| Plot type | Count rate plots | Images |
|---|---|---|
| Comparison with Poisson distribution Blue bars denote a histogram of data divided into 1 sec bins. Red curve is a Poisson curve with rate = median count rate of data. |
 |
 |
| Quadrant-wise count rates Data is divided into 100 sec bins |
 |
|
| Module-wise count rates for Quadrant A Data is divided into 100 sec bins |
 |
 |
| Module-wise count rates for Quadrant B Data is divided into 100 sec bins |
 |
 |
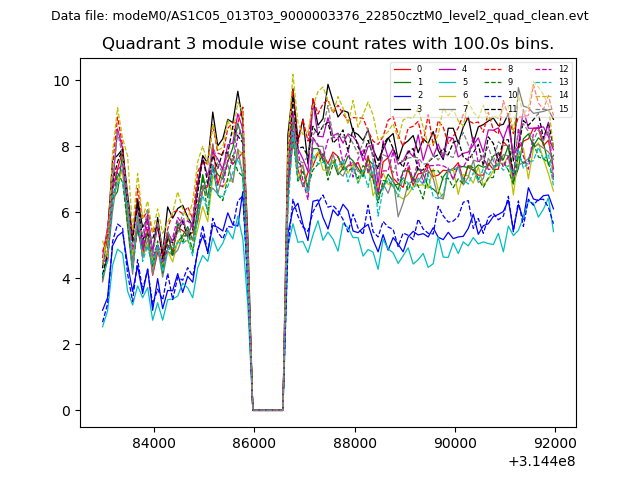
| Module-wise count rates for Quadrant C Data is divided into 100 sec bins |
 |
 |
| Module-wise count rates for Quadrant D Data is divided into 100 sec bins |
 |
 |
| Parameter | Plot |
|---|---|
| CZT HV Monitor |  |
| D_VDD | 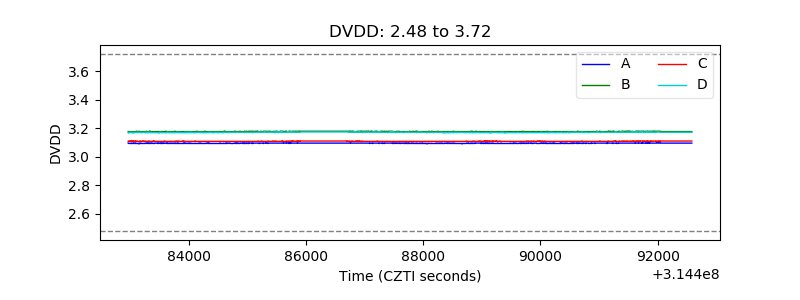 |
| Temperature 1 | 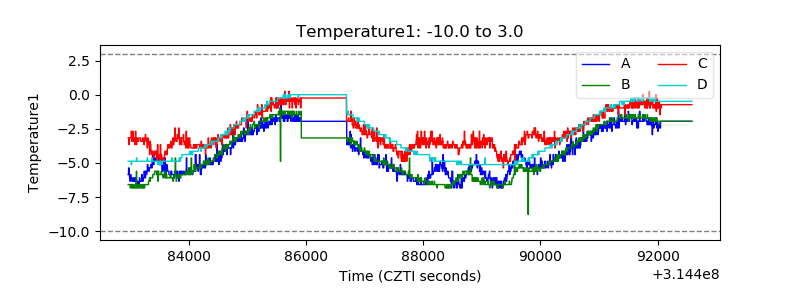 |
| Veto HV Monitor | 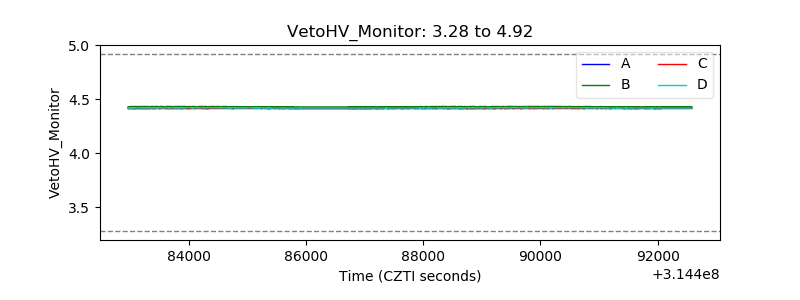 |
| Veto LLD | 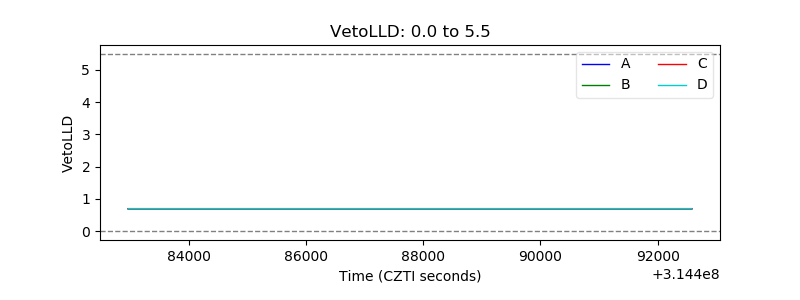 |
| Alpha Counter |  |
| _CPM_Rate |  |
| CZT Counter | 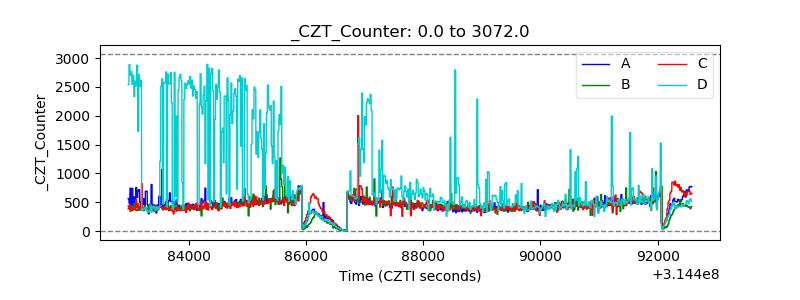 |
| +2.5 Volts monitor |  |
| +5 Volts monitor |  |
| _ROLL_ROT |  |
| _Roll_DEC | 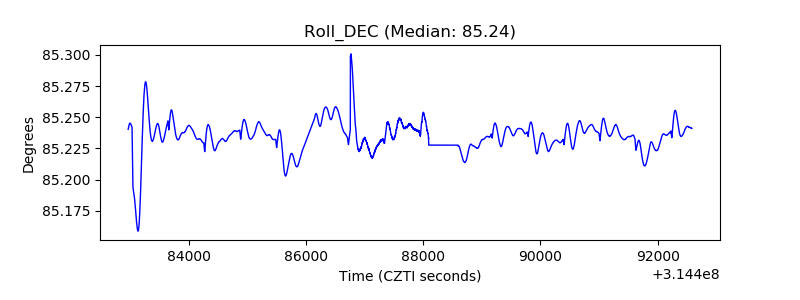 |
| _Roll_RA | 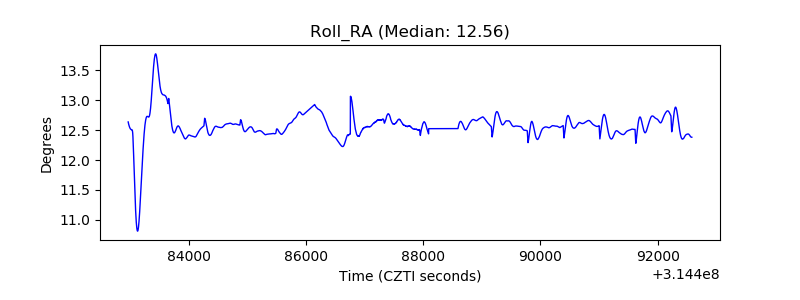 |
| Veto Counter | 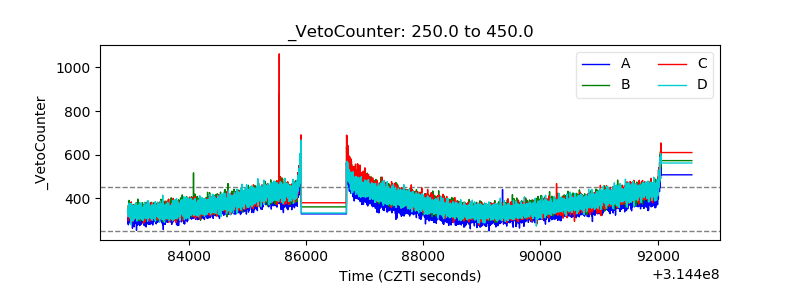 |