| Param | Original file | Final file |
|---|---|---|
| Filename | modeM0/AS1A07_049T01_9000003380_22871cztM0_level2.evt | modeM0/AS1A07_049T01_9000003380_22871cztM0_level2_quad_clean.evt |
| Size (bytes) | 110,799,360 | 24,364,800 |
| Size | 105.7 MB | 23.2 MB |
| Events in quadrant A | 789,008 | 159,492 |
| Events in quadrant B | 786,098 | 163,871 |
| Events in quadrant C | 773,263 | 153,353 |
| Events in quadrant D | 904,636 | 151,652 |
| Mode M0 | |||
|---|---|---|---|
| Quadrant | BADHDUFLAG | Total packets | Discarded packets |
| A | 0 | 3146 | 1 |
| B | 0 | 3150 | 1 |
| C | 0 | 3141 | 1 |
| D | 0 | 3641 | 4 |
| Mode M9 | |||
|---|---|---|---|
| Quadrant | BADHDUFLAG | Total packets | Discarded packets |
| A | 0 | 9 | 0 |
| B | 0 | 9 | 0 |
| C | 0 | 9 | 0 |
| D | 0 | 9 | 0 |
| Mode SS | |||
|---|---|---|---|
| Quadrant | BADHDUFLAG | Total packets | Discarded packets |
| A | 0 | 30 | 0 |
| B | 0 | 30 | 0 |
| C | 0 | 30 | 0 |
| D | 0 | 30 | 0 |
| Quadrant | Total seconds | Saturated seconds | Saturation percentage |
|---|---|---|---|
| A | 1466 | 9 | 0.613915% |
| B | 1466 | 10 | 0.682128% |
| C | 1466 | 26 | 1.773533% |
| D | 1465 | 17 | 1.160410% |
Noise dominated data is calculated using 1-second bins in cleaned event files. If a bin has >2000 counts, and if more than 50% of those come from <1% of pixels, then it is considered to be noise-dominated and hence unusable.
| Quadrant | # 1 sec bins | Bins with >0 counts | Bins with >2000 counts | High rate bins dominated by noise | Noise dominated (total time) | Noise dominated (detector-on time) | Marked lightcurve |
|---|---|---|---|---|---|---|---|
| A | 1466 | 1466 | 0 | 0 | 0.00% | 0.00% | 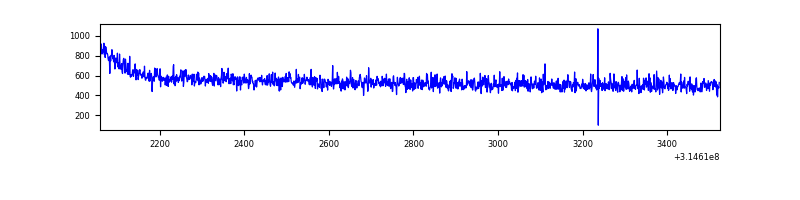 |
| B | 1466 | 1466 | 0 | 0 | 0.00% | 0.00% | 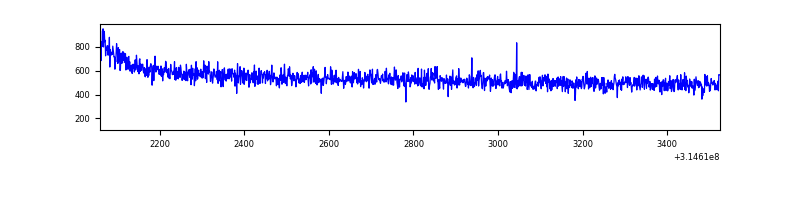 |
| C | 1466 | 1466 | 0 | 0 | 0.00% | 0.00% | 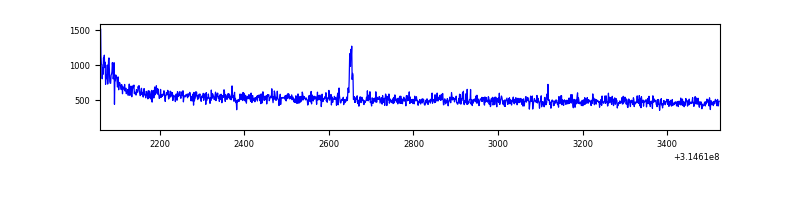 |
| D | 1466 | 1466 | 1 | 1 | 0.07% | 0.07% | 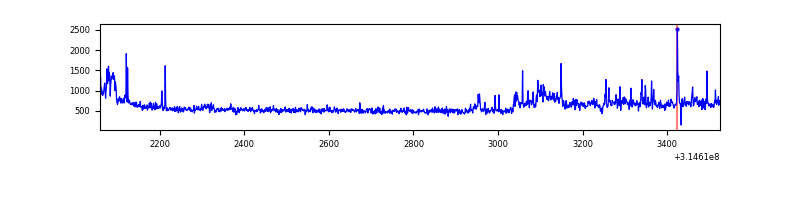 |
Top three noisy pixels from each quadrant. If the there are fewer than three noisy pixels in the level2.evt file, extra rows are filled as -1
| Pixel properties | Quadrant properties | ||||||
|---|---|---|---|---|---|---|---|
| Quadrant | DetID | PixID | Counts | Sigma | Mean | Median | Sigma |
| A | 6 | 16 | 2775 | 60.11 | 203 | 200 | 42.8 |
| A | 13 | 254 | 2158 | 45.71 | 203 | 200 | 42.8 |
| A | 0 | 226 | 1778 | 36.84 | 203 | 200 | 42.8 |
| B | 12 | 111 | 4677 | 110.35 | 200 | 195 | 40.6 |
| B | 11 | 111 | 4253 | 99.91 | 200 | 195 | 40.6 |
| B | 14 | 111 | 3777 | 88.19 | 200 | 195 | 40.6 |
| C | 14 | 238 | 31404 | 687.96 | 187 | 188 | 45.4 |
| C | 0 | 10 | 7179 | 154.07 | 187 | 188 | 45.4 |
| C | 10 | 22 | 5538 | 117.91 | 187 | 188 | 45.4 |
| D | 7 | 238 | 119218 | 2461.46 | 191 | 186 | 48.4 |
| D | 13 | 153 | 24682 | 506.55 | 191 | 186 | 48.4 |
| D | 12 | 233 | 12288 | 250.26 | 191 | 186 | 48.4 |
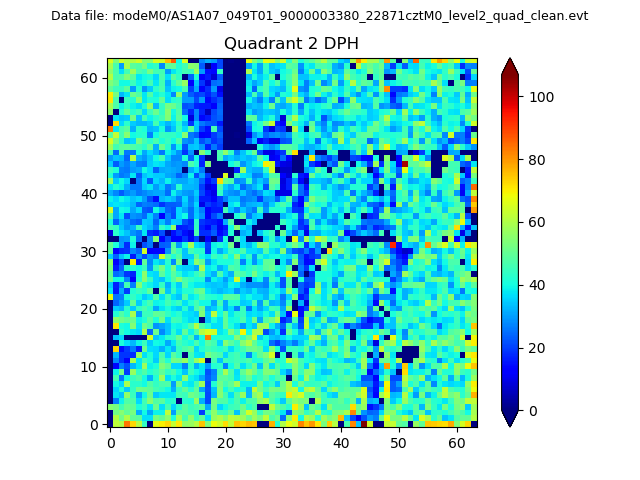
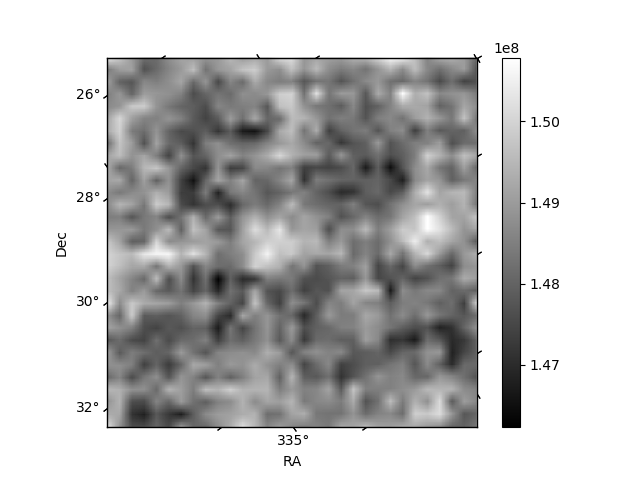
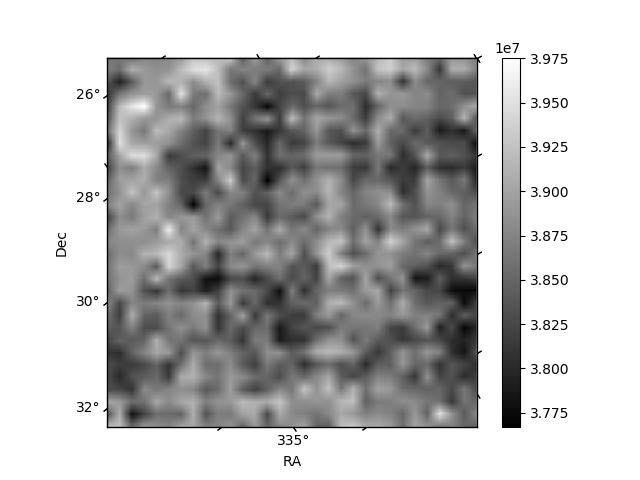
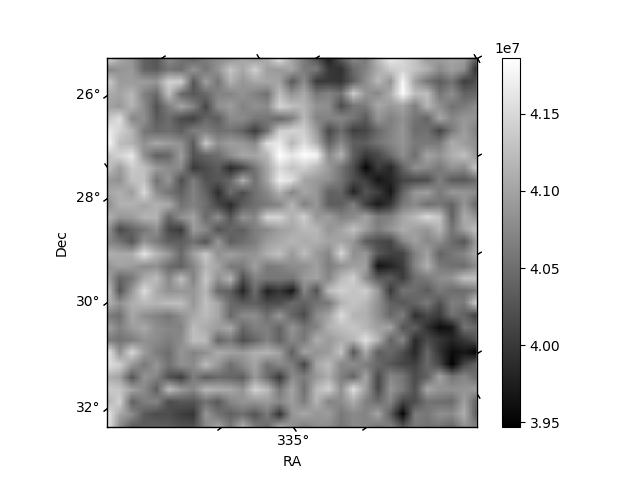
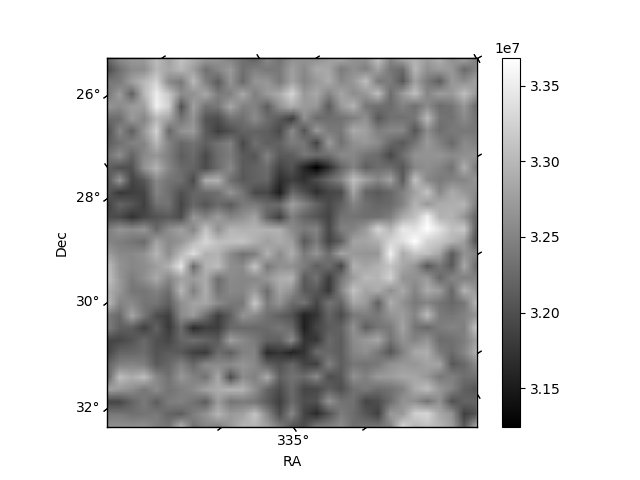
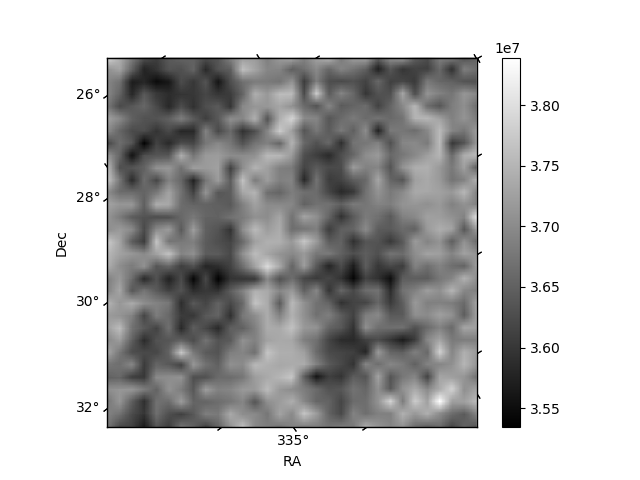
Histogram calculated using DETX and DETY for each event in the final _common_clean file
| Quadrant A | 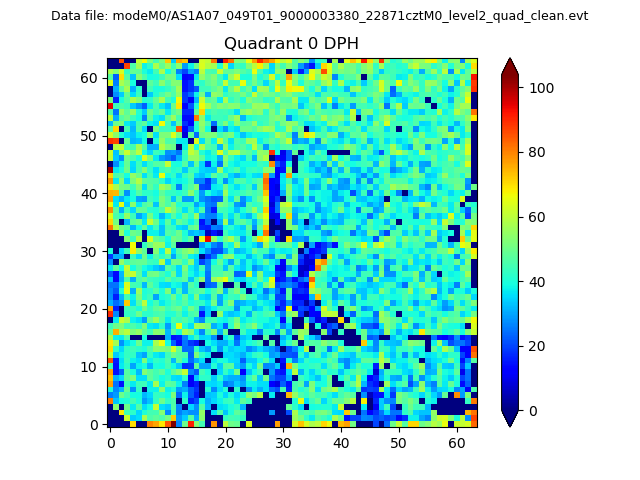 |
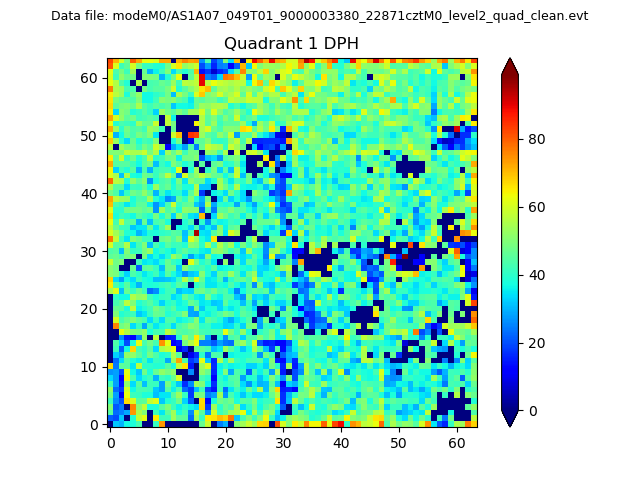 |
Quadrant B |
|---|---|---|---|
| Quadrant D | 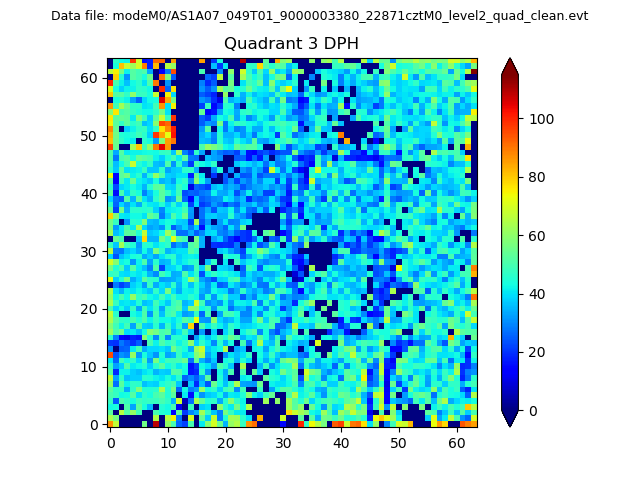 |
 |
Quadrant C |
| Plot type | Count rate plots | Images |
|---|---|---|
| Comparison with Poisson distribution Blue bars denote a histogram of data divided into 1 sec bins. Red curve is a Poisson curve with rate = median count rate of data. |
 |
 |
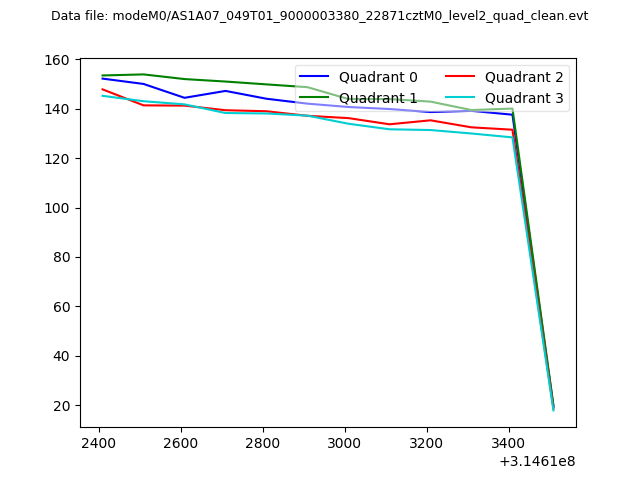
| Quadrant-wise count rates Data is divided into 100 sec bins |
 |
|
| Module-wise count rates for Quadrant A Data is divided into 100 sec bins |
 |
 |
| Module-wise count rates for Quadrant B Data is divided into 100 sec bins |
 |
 |
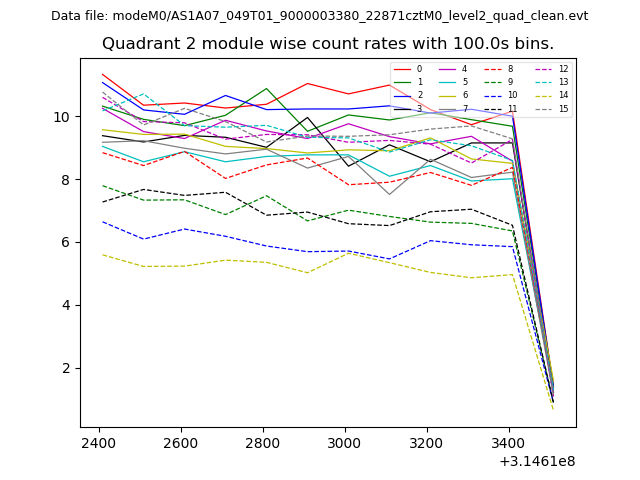
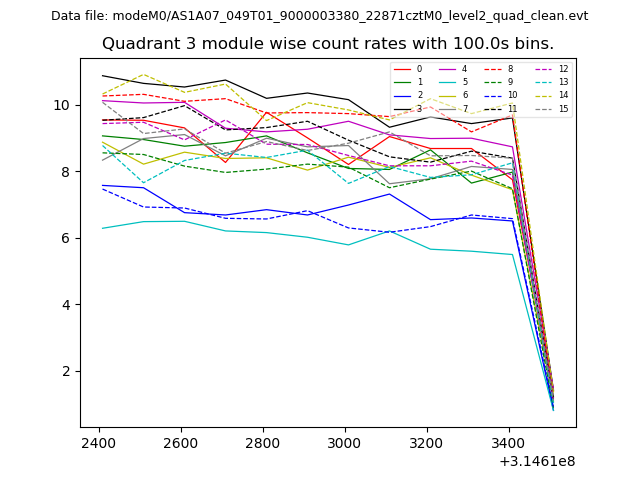
| Module-wise count rates for Quadrant C Data is divided into 100 sec bins |
 |
 |
| Module-wise count rates for Quadrant D Data is divided into 100 sec bins |
 |
 |
| Parameter | Plot |
|---|---|
| CZT HV Monitor | 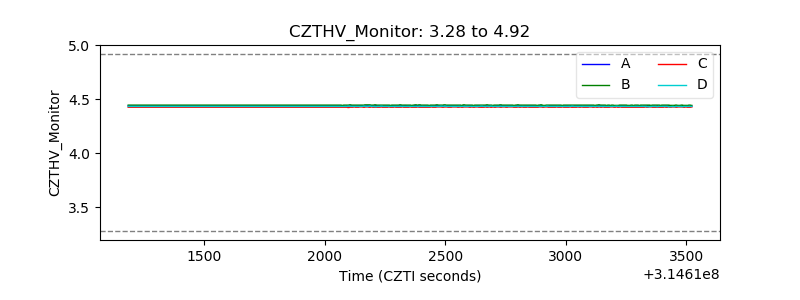 |
| D_VDD | 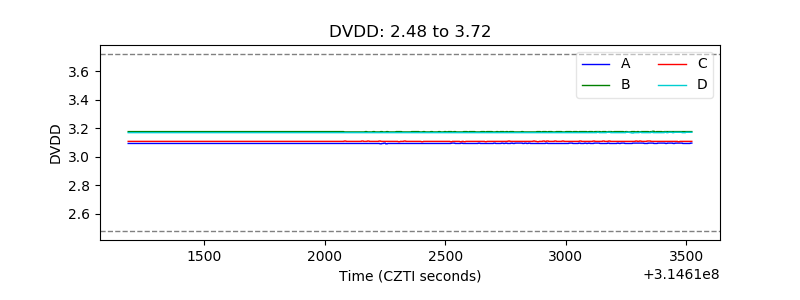 |
| Temperature 1 | 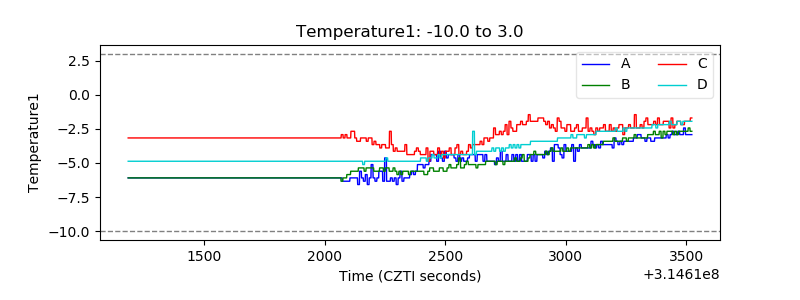 |
| Veto HV Monitor | 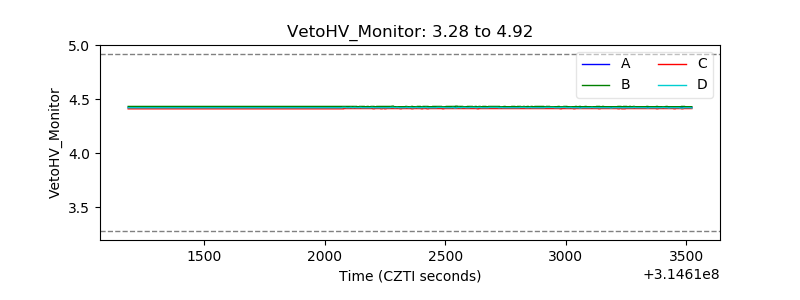 |
| Veto LLD | 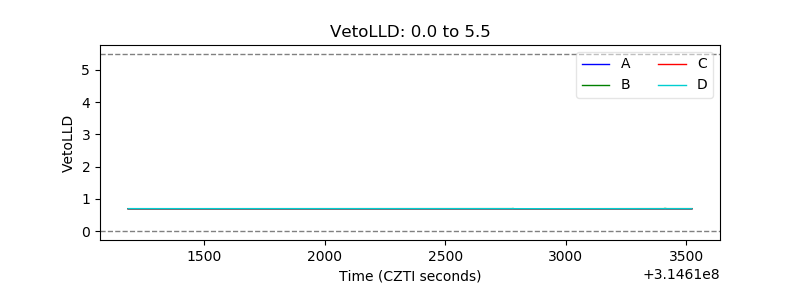 |
| Alpha Counter | 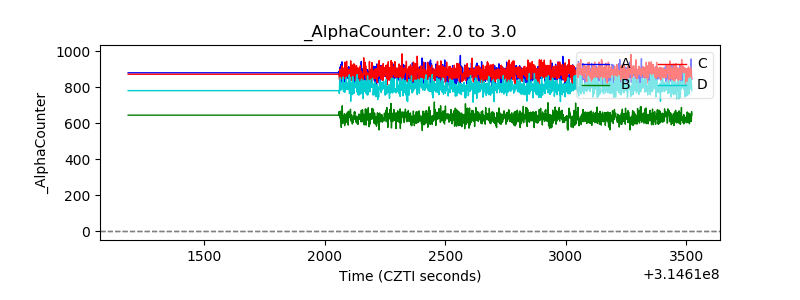 |
| _CPM_Rate |  |
| CZT Counter | 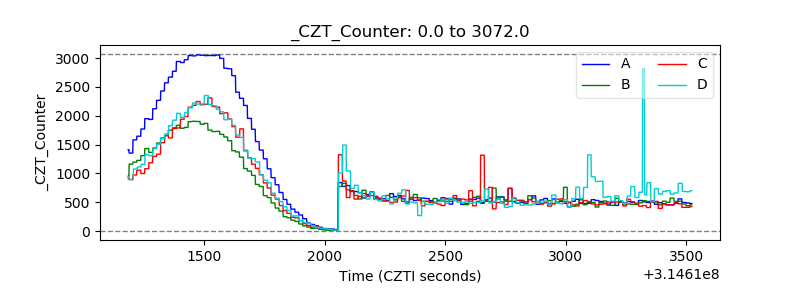 |
| +2.5 Volts monitor |  |
| +5 Volts monitor | 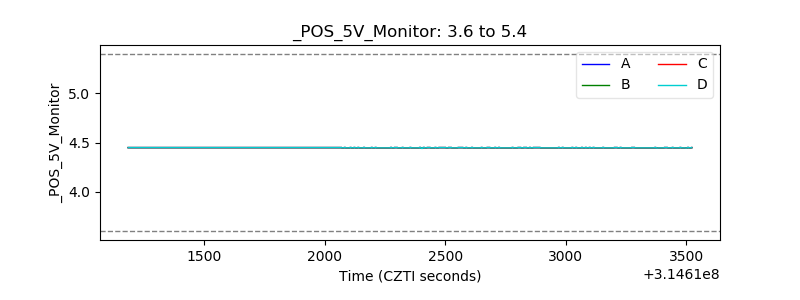 |
| _ROLL_ROT | 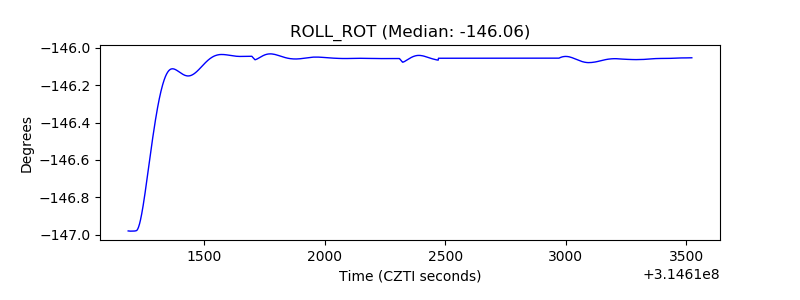 |
| _Roll_DEC | 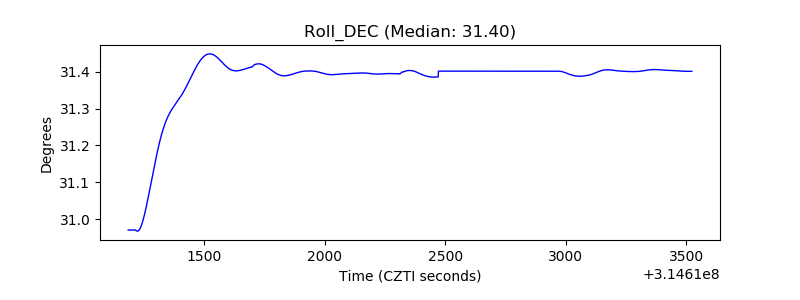 |
| _Roll_RA | 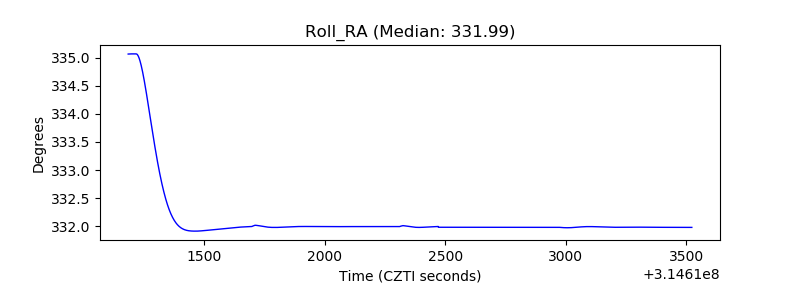 |
| Veto Counter | 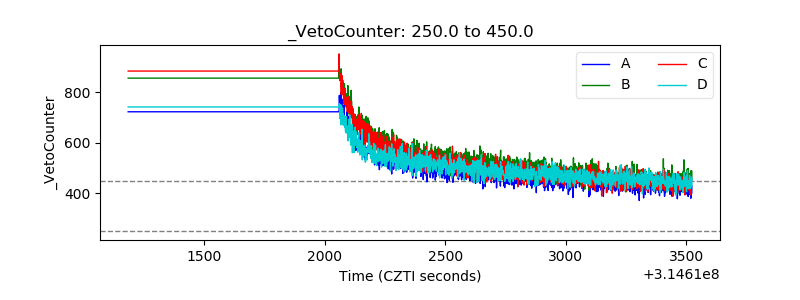 |