| Param | Original file | Final file |
|---|---|---|
| Filename | modeM0/AS1A07_049T01_9000003380_22872cztM0_level2.evt | modeM0/AS1A07_049T01_9000003380_22872cztM0_level2_quad_clean.evt |
| Size (bytes) | 479,260,800 | 103,654,080 |
| Size | 457.1 MB | 98.9 MB |
| Events in quadrant A | 3,182,420 | 690,494 |
| Events in quadrant B | 3,202,265 | 698,927 |
| Events in quadrant C | 3,138,123 | 656,386 |
| Events in quadrant D | 4,552,924 | 642,547 |
| Mode M0 | |||
|---|---|---|---|
| Quadrant | BADHDUFLAG | Total packets | Discarded packets |
| A | 0 | 13391 | 1 |
| B | 0 | 13434 | 1 |
| C | 0 | 13371 | 1 |
| D | 0 | 18021 | 7 |
| Mode M9 | |||
|---|---|---|---|
| Quadrant | BADHDUFLAG | Total packets | Discarded packets |
| A | 0 | 10 | 0 |
| B | 0 | 10 | 0 |
| C | 0 | 10 | 0 |
| D | 0 | 10 | 0 |
| Mode SS | |||
|---|---|---|---|
| Quadrant | BADHDUFLAG | Total packets | Discarded packets |
| A | 0 | 130 | 0 |
| B | 0 | 130 | 0 |
| C | 0 | 130 | 0 |
| D | 0 | 130 | 0 |
| Quadrant | Total seconds | Saturated seconds | Saturation percentage |
|---|---|---|---|
| A | 6468 | 88 | 1.360544% |
| B | 6469 | 117 | 1.808626% |
| C | 6469 | 100 | 1.545834% |
| D | 6467 | 114 | 1.762796% |
Noise dominated data is calculated using 1-second bins in cleaned event files. If a bin has >2000 counts, and if more than 50% of those come from <1% of pixels, then it is considered to be noise-dominated and hence unusable.
| Quadrant | # 1 sec bins | Bins with >0 counts | Bins with >2000 counts | High rate bins dominated by noise | Noise dominated (total time) | Noise dominated (detector-on time) | Marked lightcurve |
|---|---|---|---|---|---|---|---|
| A | 7469 | 6470 | 0 | 0 | 0.00% | 0.00% | 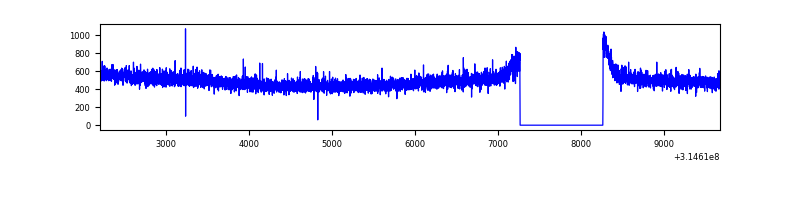 |
| B | 7469 | 6470 | 0 | 0 | 0.00% | 0.00% | 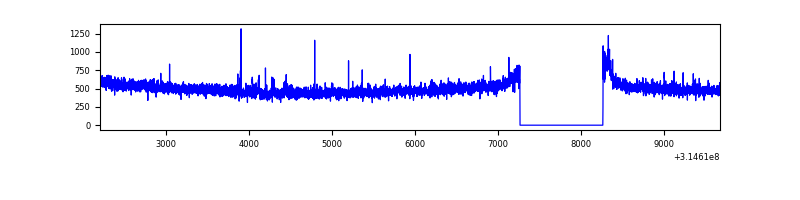 |
| C | 7469 | 6470 | 0 | 0 | 0.00% | 0.00% | 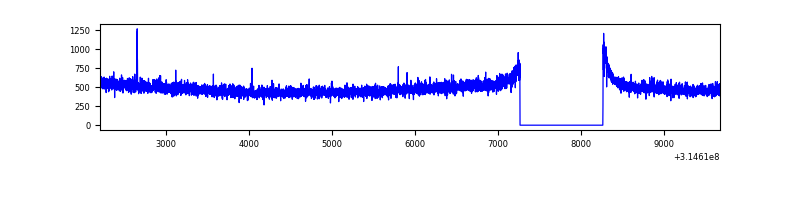 |
| D | 7469 | 6470 | 28 | 28 | 0.37% | 0.43% | 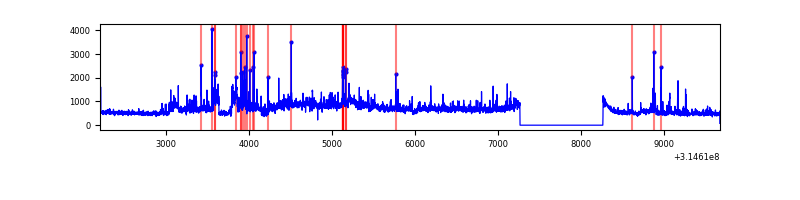 |
Top three noisy pixels from each quadrant. If the there are fewer than three noisy pixels in the level2.evt file, extra rows are filled as -1
| Pixel properties | Quadrant properties | ||||||
|---|---|---|---|---|---|---|---|
| Quadrant | DetID | PixID | Counts | Sigma | Mean | Median | Sigma |
| A | 13 | 254 | 10150 | 56.75 | 822 | 806 | 164.7 |
| A | 6 | 16 | 9176 | 50.83 | 822 | 806 | 164.7 |
| A | 0 | 226 | 6946 | 37.29 | 822 | 806 | 164.7 |
| B | 12 | 111 | 18539 | 113.76 | 811 | 792 | 156.0 |
| B | 11 | 111 | 16600 | 101.33 | 811 | 792 | 156.0 |
| B | 0 | 190 | 15640 | 95.17 | 811 | 792 | 156.0 |
| C | 14 | 238 | 123737 | 681.59 | 770 | 777 | 180.4 |
| C | 10 | 22 | 5913 | 28.47 | 770 | 777 | 180.4 |
| C | 13 | 61 | 5415 | 25.71 | 770 | 777 | 180.4 |
| D | 7 | 238 | 1125625 | 5772.52 | 791 | 766 | 194.9 |
| D | 1 | 52 | 110184 | 561.51 | 791 | 766 | 194.9 |
| D | 12 | 233 | 94751 | 482.31 | 791 | 766 | 194.9 |
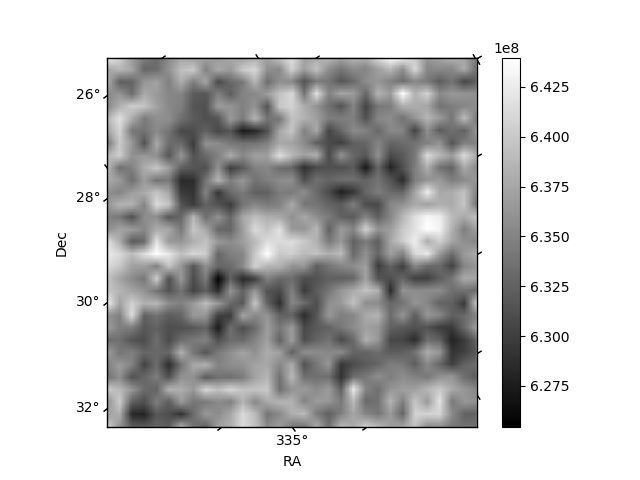
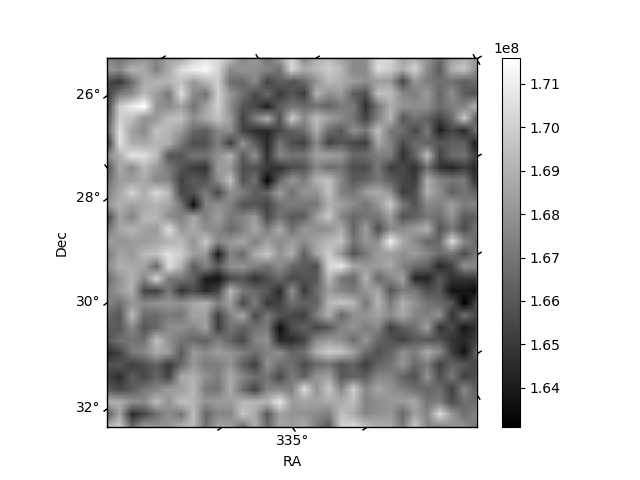
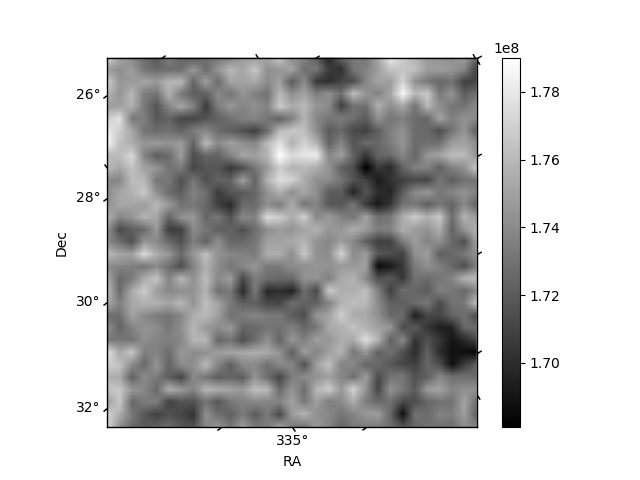
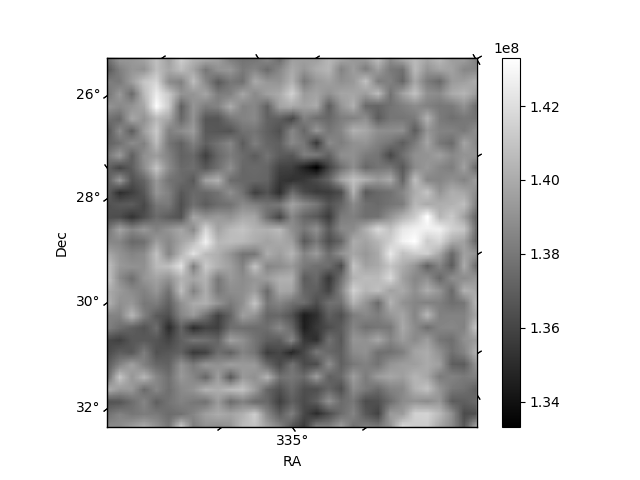
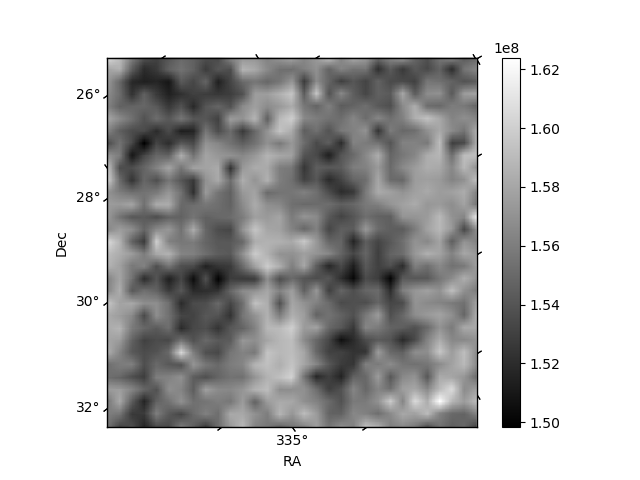
Histogram calculated using DETX and DETY for each event in the final _common_clean file
| Quadrant A | 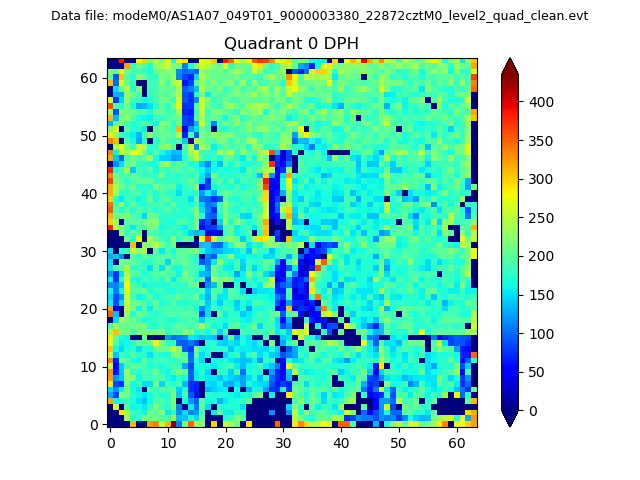 |
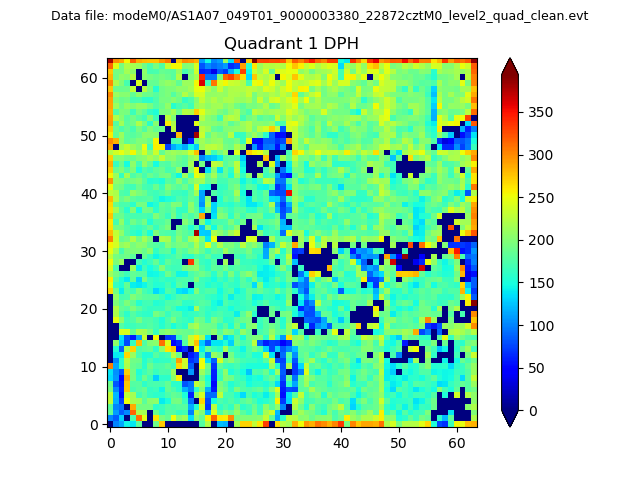 |
Quadrant B |
|---|---|---|---|
| Quadrant D |  |
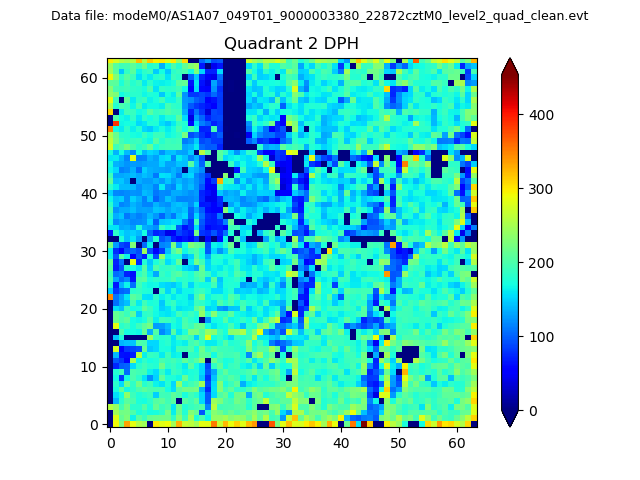 |
Quadrant C |
| Plot type | Count rate plots | Images |
|---|---|---|
| Comparison with Poisson distribution Blue bars denote a histogram of data divided into 1 sec bins. Red curve is a Poisson curve with rate = median count rate of data. |
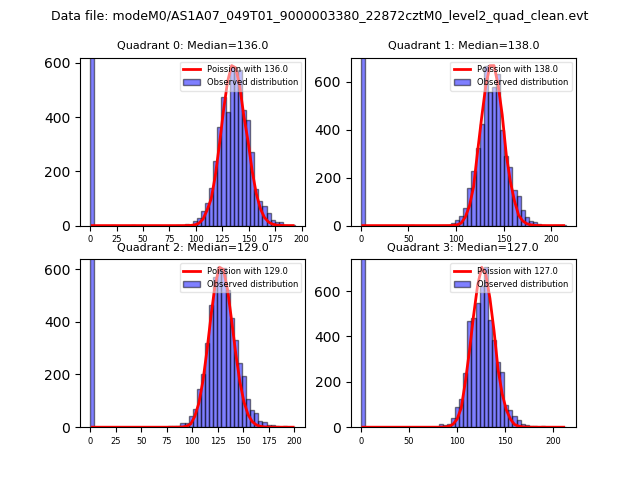 |
 |
| Quadrant-wise count rates Data is divided into 100 sec bins |
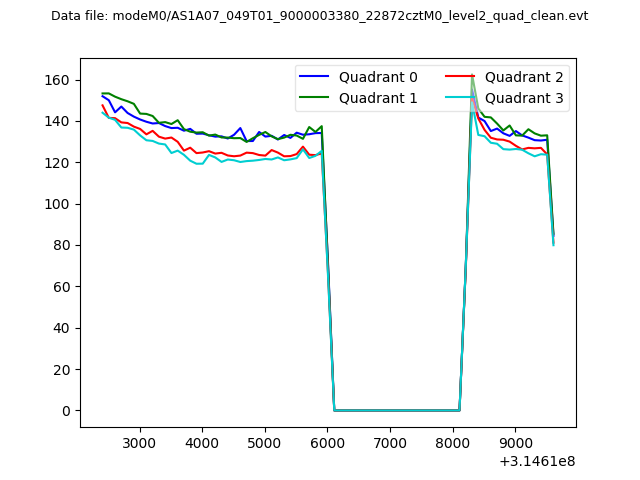 |
|
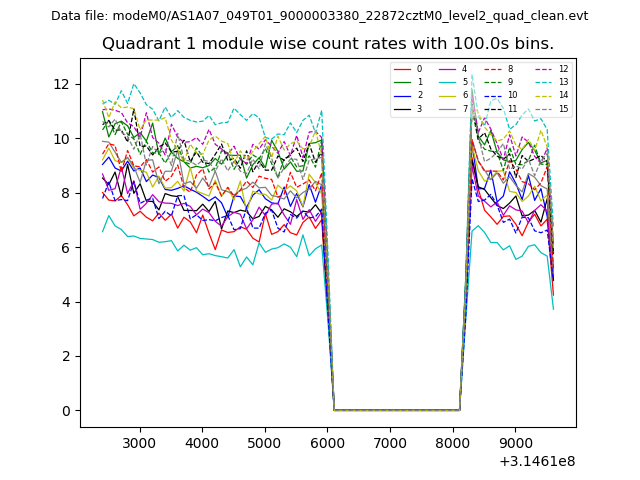
| Module-wise count rates for Quadrant A Data is divided into 100 sec bins |
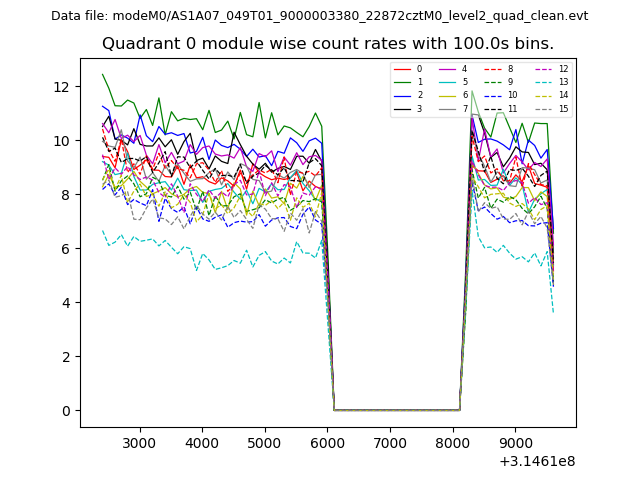 |
 |
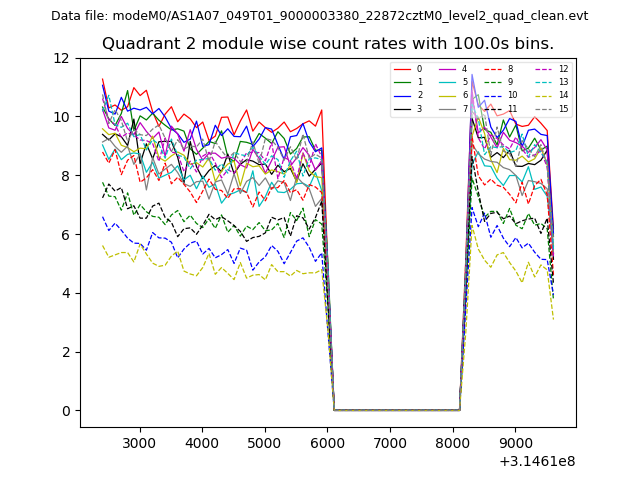
| Module-wise count rates for Quadrant B Data is divided into 100 sec bins |
 |
 |
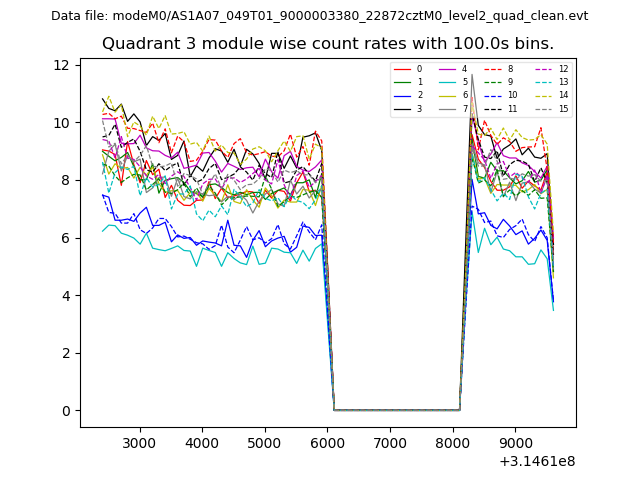
| Module-wise count rates for Quadrant C Data is divided into 100 sec bins |
 |
 |
| Module-wise count rates for Quadrant D Data is divided into 100 sec bins |
 |
 |
| Parameter | Plot |
|---|---|
| CZT HV Monitor | 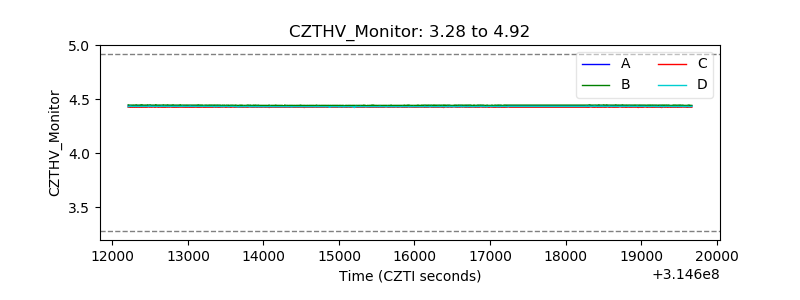 |
| D_VDD | 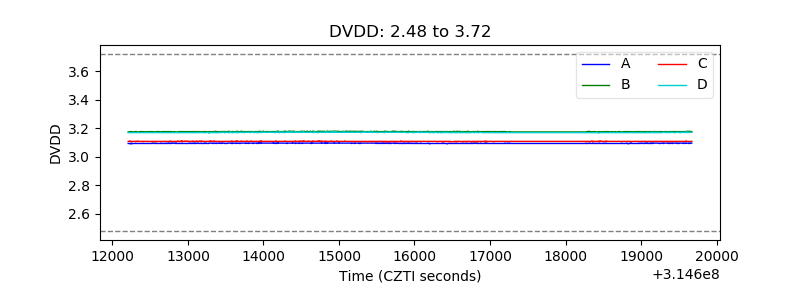 |
| Temperature 1 | 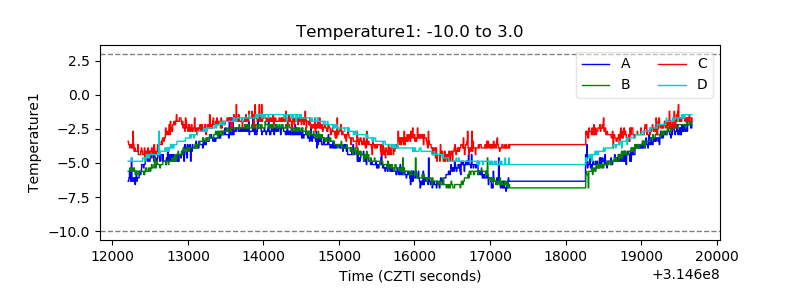 |
| Veto HV Monitor | 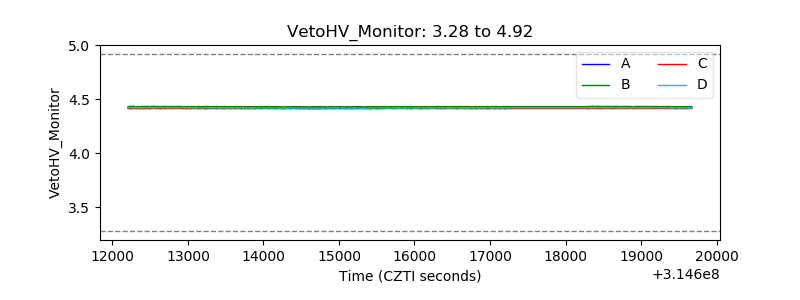 |
| Veto LLD | 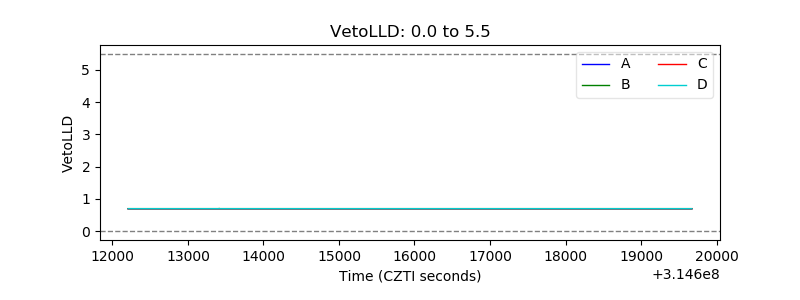 |
| Alpha Counter | 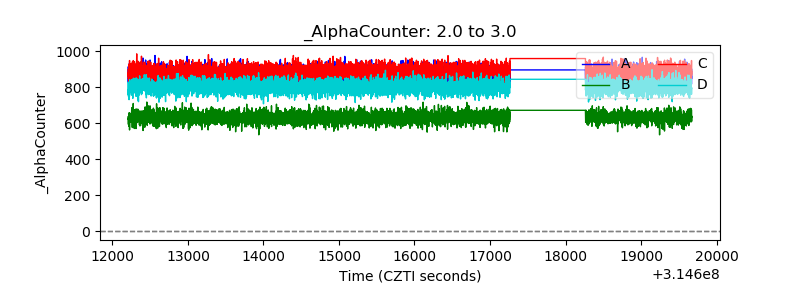 |
| _CPM_Rate |  |
| CZT Counter |  |
| +2.5 Volts monitor | 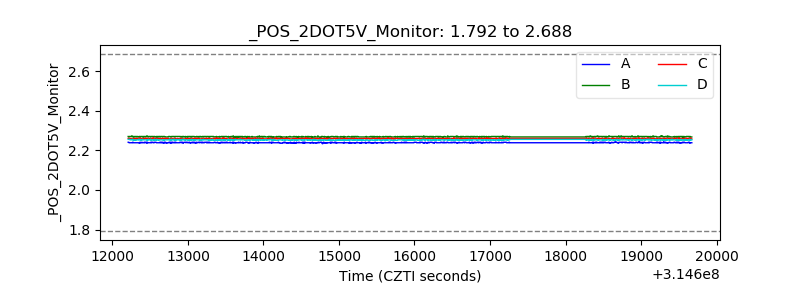 |
| +5 Volts monitor |  |
| _ROLL_ROT | 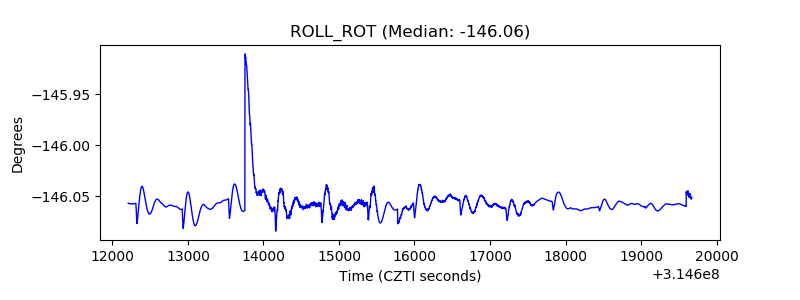 |
| _Roll_DEC | 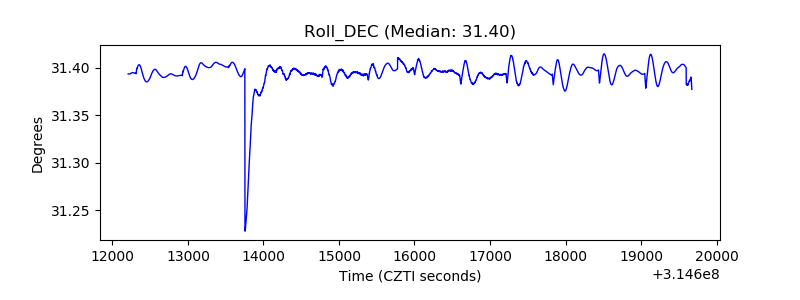 |
| _Roll_RA | 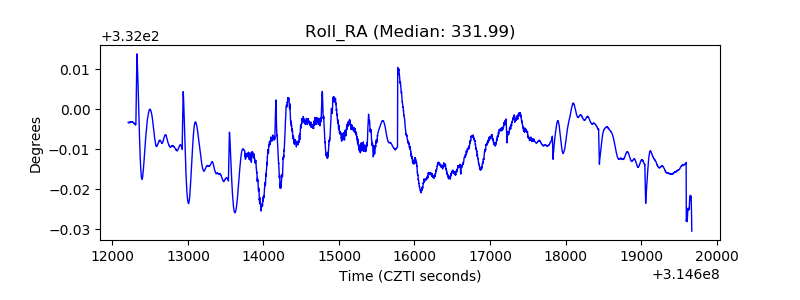 |
| Veto Counter | 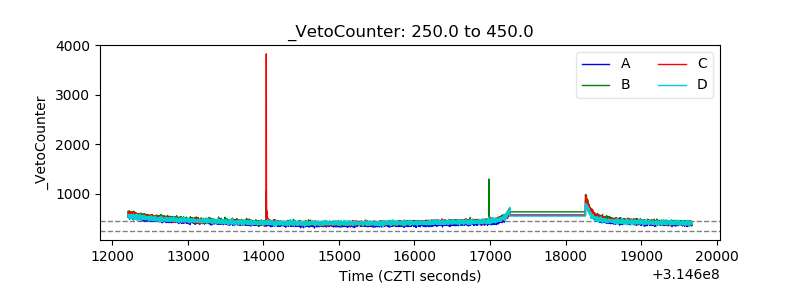 |