| Param | Original file | Final file |
|---|---|---|
| Filename | modeM0/AS1A07_049T01_9000003380_22874cztM0_level2.evt | modeM0/AS1A07_049T01_9000003380_22874cztM0_level2_quad_clean.evt |
| Size (bytes) | 542,845,440 | 92,767,680 |
| Size | 517.7 MB | 88.5 MB |
| Events in quadrant A | 3,247,726 | 602,064 |
| Events in quadrant B | 3,388,349 | 604,775 |
| Events in quadrant C | 3,279,539 | 578,518 |
| Events in quadrant D | 6,051,663 | 538,204 |
| Mode M0 | |||
|---|---|---|---|
| Quadrant | BADHDUFLAG | Total packets | Discarded packets |
| A | 0 | 14310 | 1 |
| B | 0 | 14554 | 1 |
| C | 0 | 14370 | 1 |
| D | 0 | 22822 | 1 |
| Mode M9 | |||
|---|---|---|---|
| Quadrant | BADHDUFLAG | Total packets | Discarded packets |
| A | 0 | 3 | 0 |
| B | 0 | 3 | 0 |
| C | 0 | 3 | 0 |
| D | 0 | 3 | 0 |
| Mode SS | |||
|---|---|---|---|
| Quadrant | BADHDUFLAG | Total packets | Discarded packets |
| A | 0 | 144 | 0 |
| B | 0 | 144 | 0 |
| C | 0 | 144 | 0 |
| D | 0 | 144 | 0 |
| Quadrant | Total seconds | Saturated seconds | Saturation percentage |
|---|---|---|---|
| A | 6963 | 43 | 0.617550% |
| B | 6964 | 73 | 1.048248% |
| C | 6964 | 75 | 1.076967% |
| D | 6964 | 528 | 7.581850% |
Noise dominated data is calculated using 1-second bins in cleaned event files. If a bin has >2000 counts, and if more than 50% of those come from <1% of pixels, then it is considered to be noise-dominated and hence unusable.
| Quadrant | # 1 sec bins | Bins with >0 counts | Bins with >2000 counts | High rate bins dominated by noise | Noise dominated (total time) | Noise dominated (detector-on time) | Marked lightcurve |
|---|---|---|---|---|---|---|---|
| A | 7333 | 6964 | 0 | 0 | 0.00% | 0.00% | 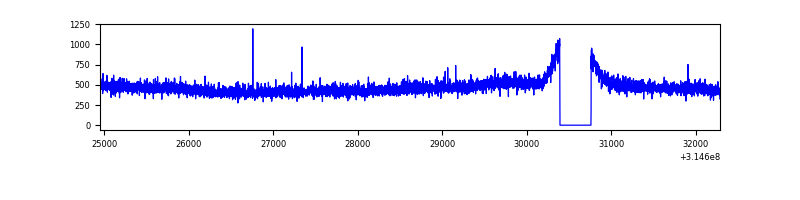 |
| B | 7334 | 6965 | 21 | 21 | 0.29% | 0.30% | 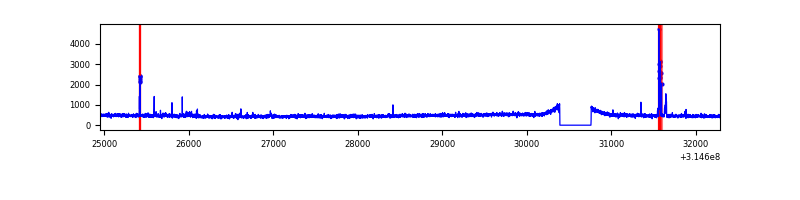 |
| C | 7334 | 6965 | 1 | 1 | 0.01% | 0.01% | 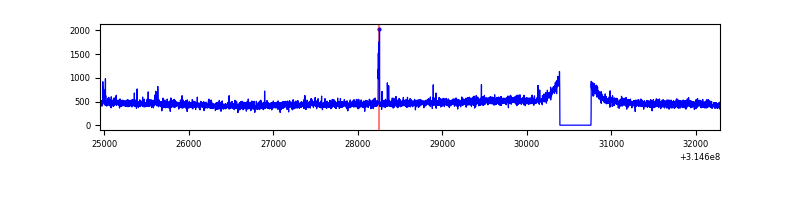 |
| D | 7334 | 6965 | 376 | 376 | 5.13% | 5.40% | 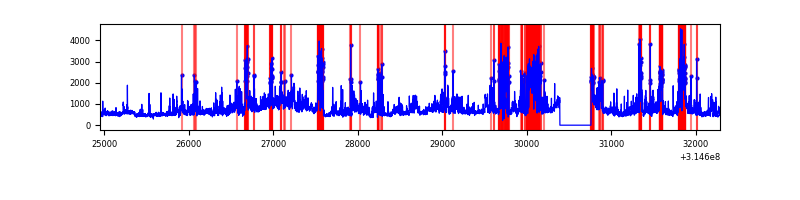 |
Top three noisy pixels from each quadrant. If the there are fewer than three noisy pixels in the level2.evt file, extra rows are filled as -1
| Pixel properties | Quadrant properties | ||||||
|---|---|---|---|---|---|---|---|
| Quadrant | DetID | PixID | Counts | Sigma | Mean | Median | Sigma |
| A | 13 | 254 | 11675 | 64.02 | 842 | 822 | 169.5 |
| A | 3 | 137 | 7343 | 38.47 | 842 | 822 | 169.5 |
| A | 0 | 226 | 7178 | 37.49 | 842 | 822 | 169.5 |
| B | 0 | 228 | 66141 | 407.12 | 832 | 809 | 160.5 |
| B | 0 | 190 | 21858 | 131.17 | 832 | 809 | 160.5 |
| B | 12 | 111 | 19512 | 116.55 | 832 | 809 | 160.5 |
| C | 14 | 238 | 126544 | 664.99 | 800 | 804 | 189.1 |
| C | 10 | 22 | 36662 | 189.64 | 800 | 804 | 189.1 |
| C | 13 | 61 | 5578 | 25.25 | 800 | 804 | 189.1 |
| D | 7 | 238 | 1365409 | 7102.88 | 790 | 768 | 192.1 |
| D | 12 | 233 | 487026 | 2530.94 | 790 | 768 | 192.1 |
| D | 1 | 52 | 400330 | 2079.7 | 790 | 768 | 192.1 |
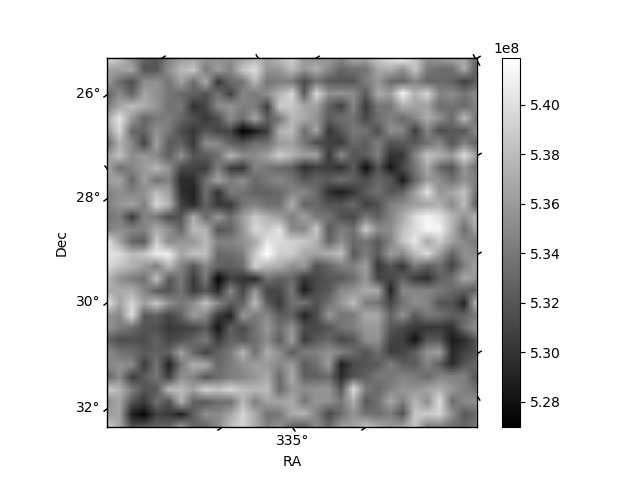
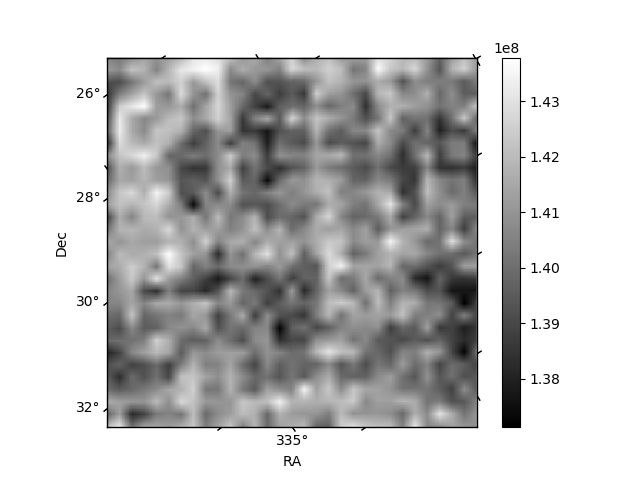
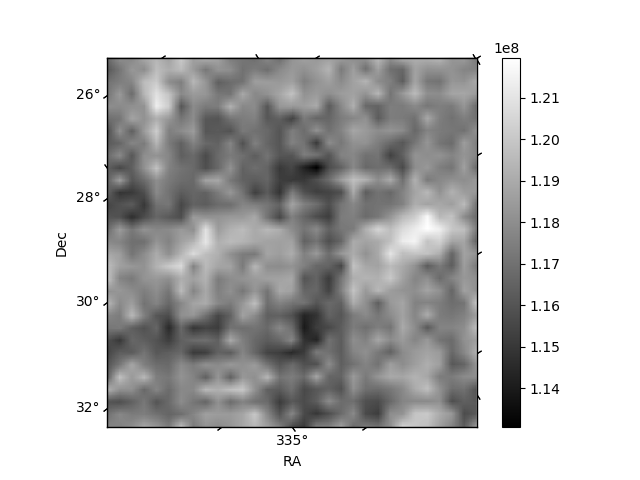
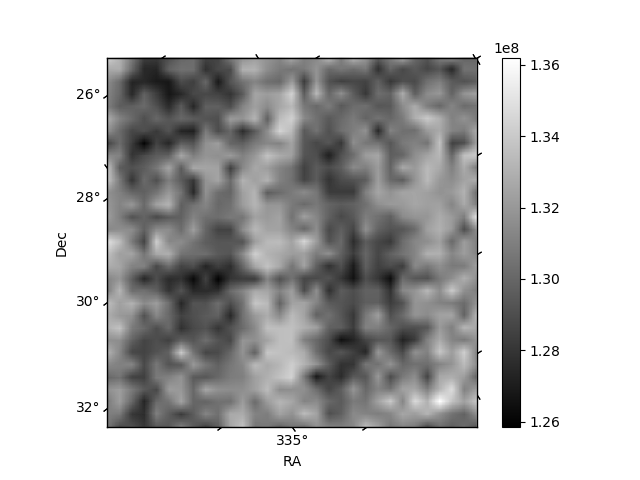
Histogram calculated using DETX and DETY for each event in the final _common_clean file
| Quadrant A | 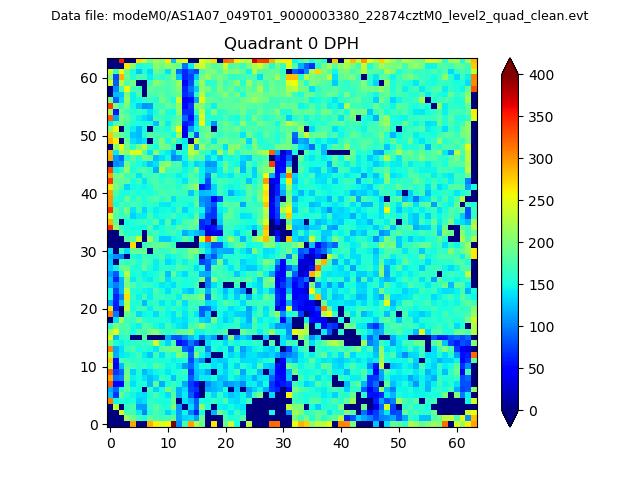 |
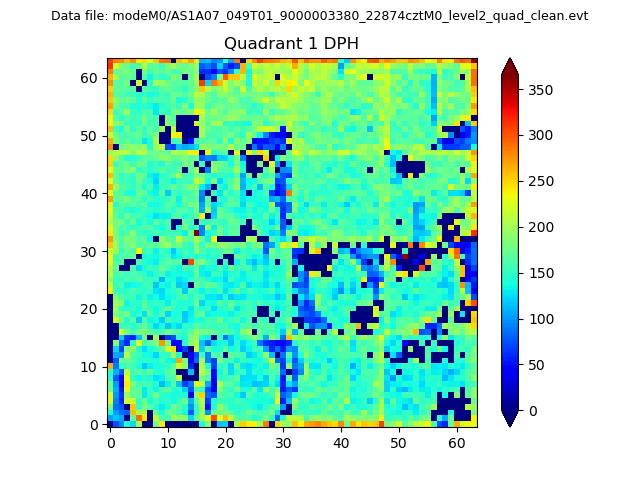 |
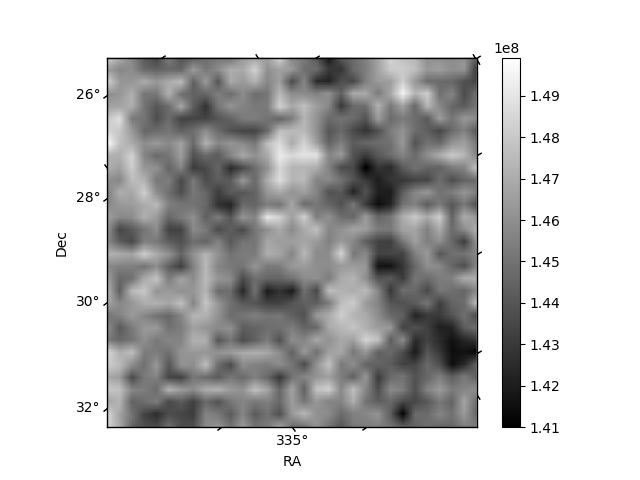
Quadrant B |
|---|---|---|---|
| Quadrant D | 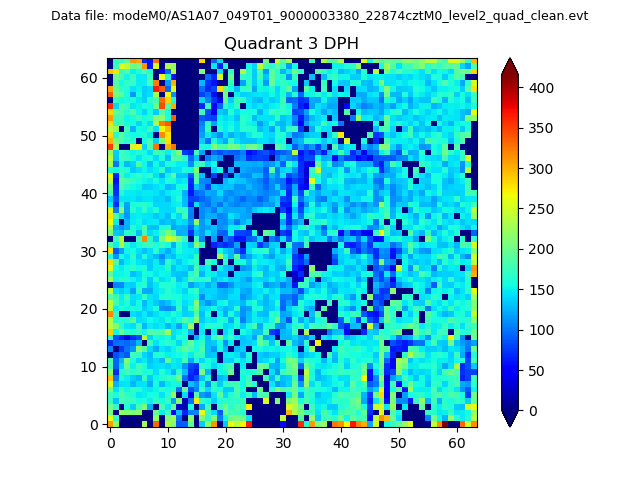 |
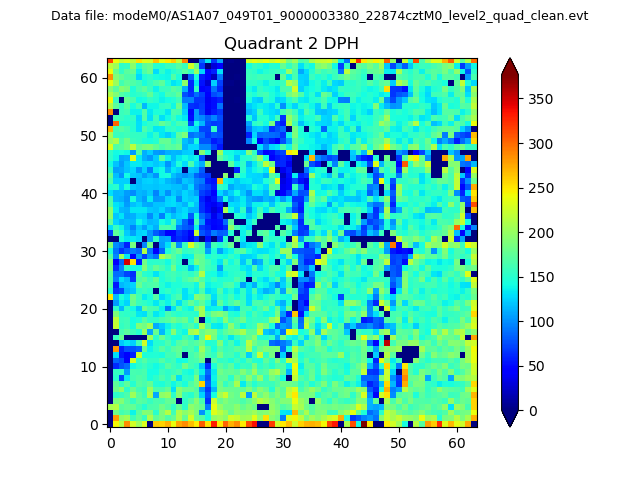 |
Quadrant C |
| Plot type | Count rate plots | Images |
|---|---|---|
| Comparison with Poisson distribution Blue bars denote a histogram of data divided into 1 sec bins. Red curve is a Poisson curve with rate = median count rate of data. |
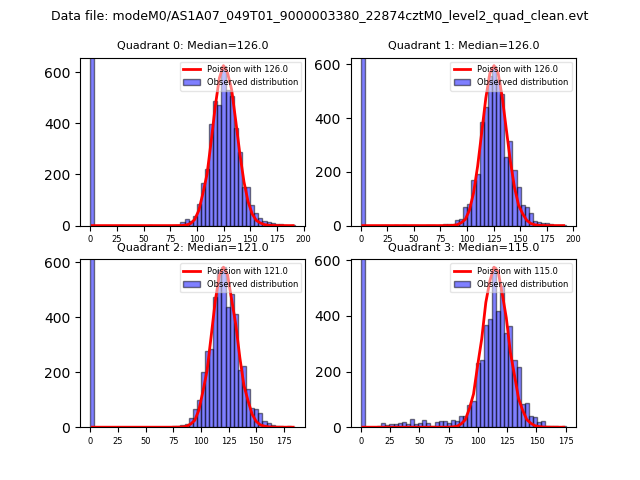 |
 |
| Quadrant-wise count rates Data is divided into 100 sec bins |
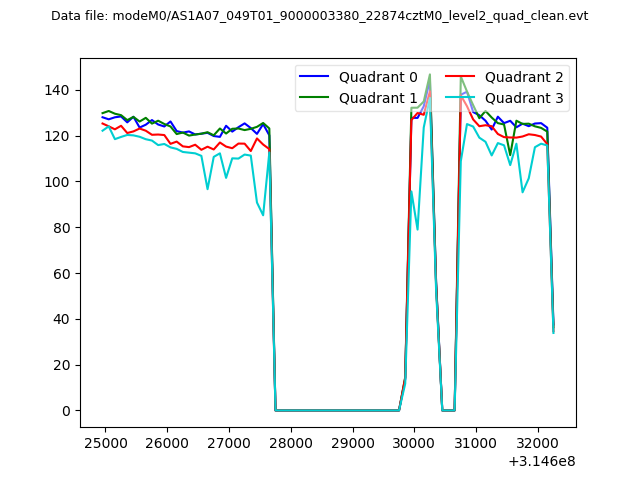 |
|
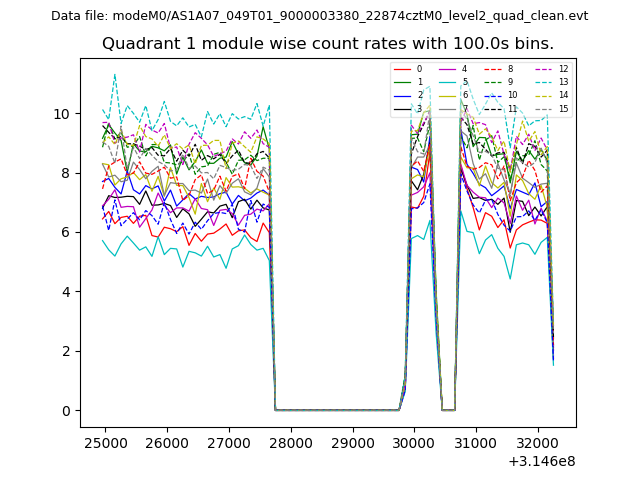
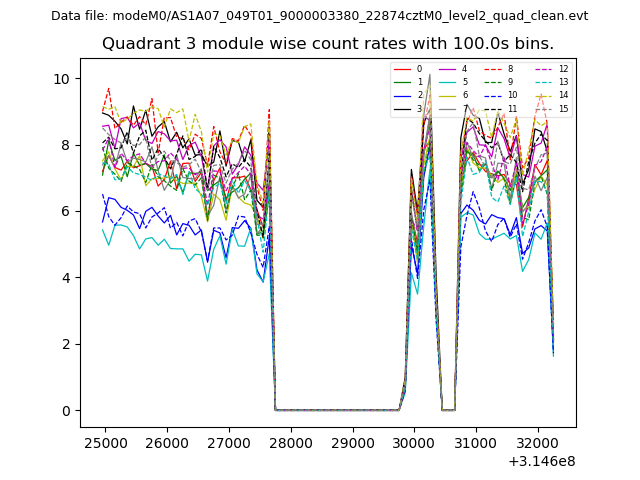
| Module-wise count rates for Quadrant A Data is divided into 100 sec bins |
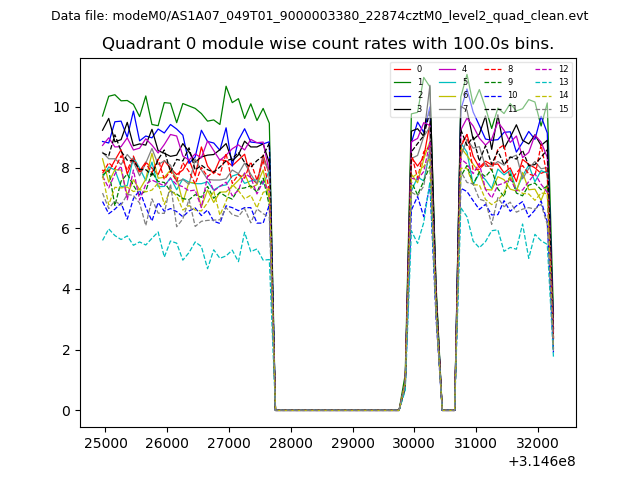 |
 |
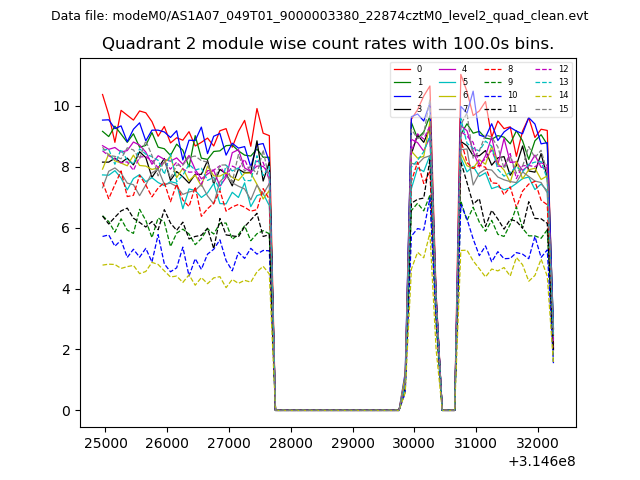
| Module-wise count rates for Quadrant B Data is divided into 100 sec bins |
 |
 |
| Module-wise count rates for Quadrant C Data is divided into 100 sec bins |
 |
 |
| Module-wise count rates for Quadrant D Data is divided into 100 sec bins |
 |
 |
| Parameter | Plot |
|---|---|
| CZT HV Monitor | 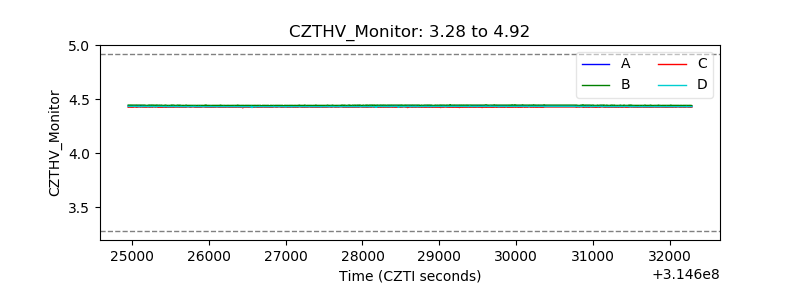 |
| D_VDD | 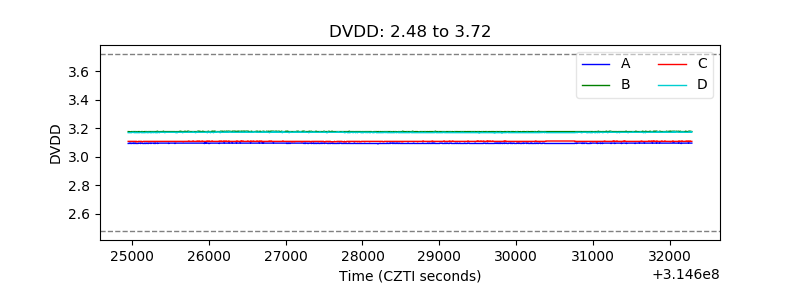 |
| Temperature 1 | 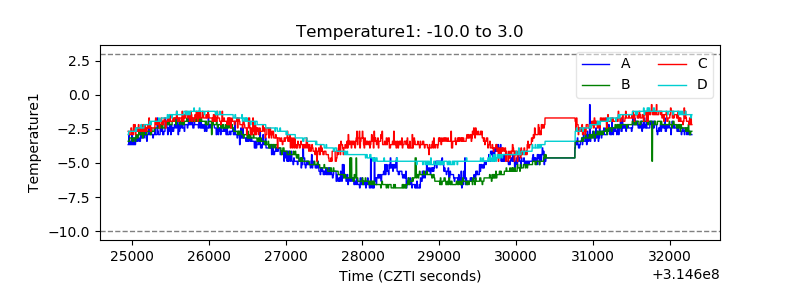 |
| Veto HV Monitor | 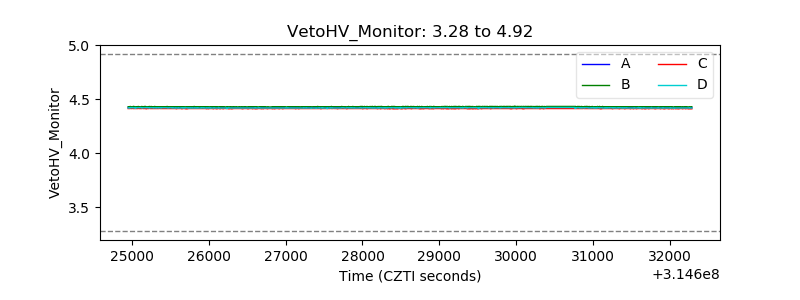 |
| Veto LLD | 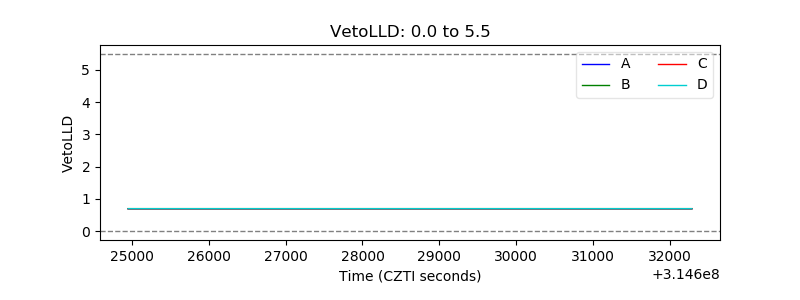 |
| Alpha Counter | 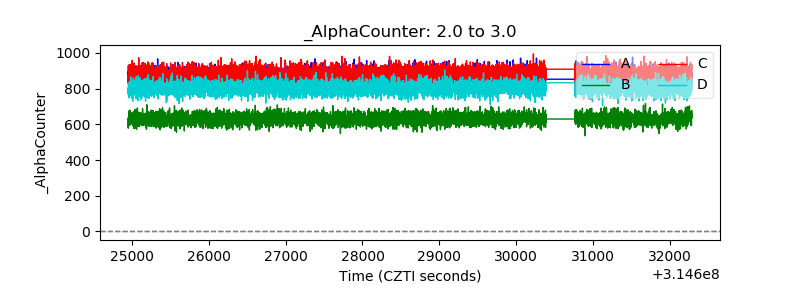 |
| _CPM_Rate | 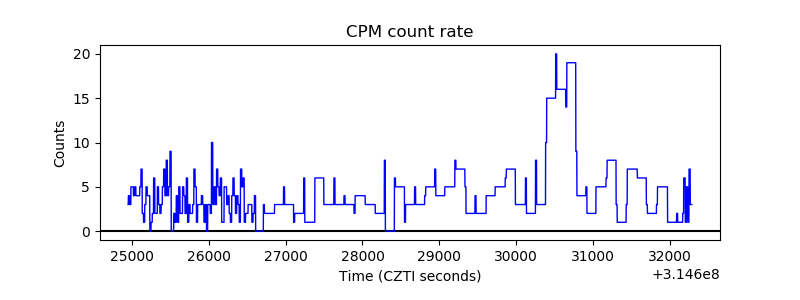 |
| CZT Counter | 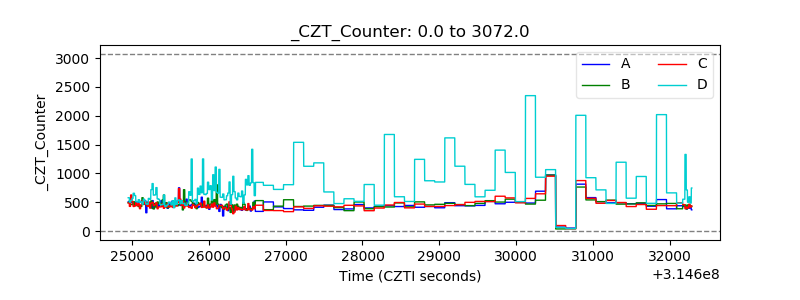 |
| +2.5 Volts monitor |  |
| +5 Volts monitor | 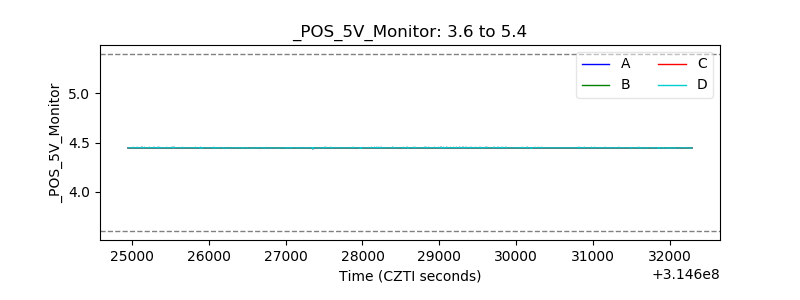 |
| _ROLL_ROT | 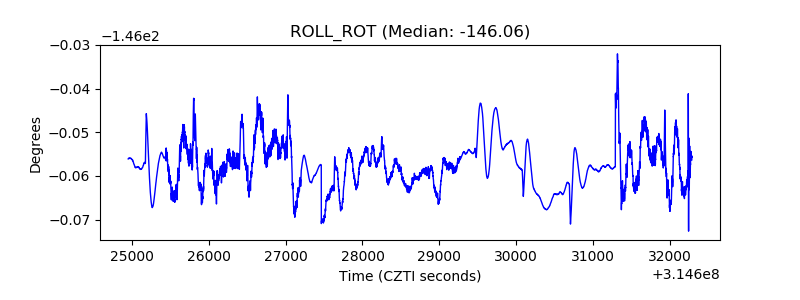 |
| _Roll_DEC | 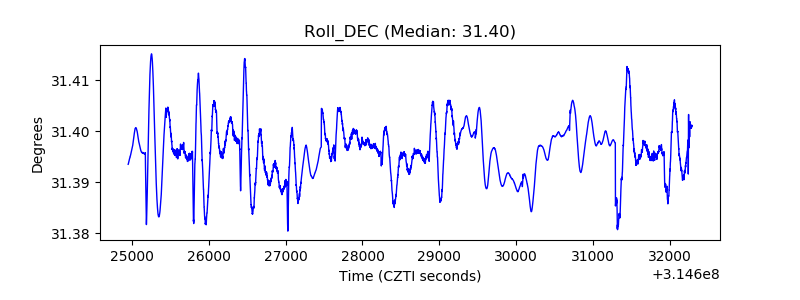 |
| _Roll_RA | 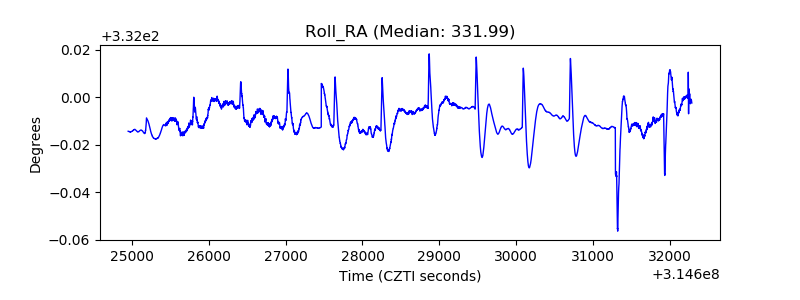 |
| Veto Counter | 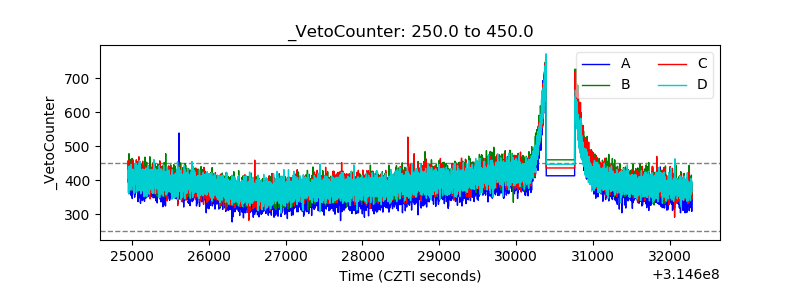 |