| Param | Original file | Final file |
|---|---|---|
| Filename | modeM0/AS1A07_049T01_9000003380_22875cztM0_level2.evt | modeM0/AS1A07_049T01_9000003380_22875cztM0_level2_quad_clean.evt |
| Size (bytes) | 506,678,400 | 97,171,200 |
| Size | 483.2 MB | 92.7 MB |
| Events in quadrant A | 3,321,310 | 628,014 |
| Events in quadrant B | 3,458,006 | 629,523 |
| Events in quadrant C | 3,333,639 | 602,516 |
| Events in quadrant D | 4,744,666 | 582,971 |
| Mode M0 | |||
|---|---|---|---|
| Quadrant | BADHDUFLAG | Total packets | Discarded packets |
| A | 0 | 14692 | 1 |
| B | 0 | 14917 | 1 |
| C | 0 | 14685 | 1 |
| D | 0 | 18840 | 3 |
| Mode M9 | |||
|---|---|---|---|
| Quadrant | BADHDUFLAG | Total packets | Discarded packets |
| A | 0 | 3 | 0 |
| B | 0 | 3 | 0 |
| C | 0 | 3 | 0 |
| D | 0 | 3 | 0 |
| Mode SS | |||
|---|---|---|---|
| Quadrant | BADHDUFLAG | Total packets | Discarded packets |
| A | 0 | 146 | 0 |
| B | 0 | 146 | 0 |
| C | 0 | 146 | 0 |
| D | 0 | 146 | 0 |
| Quadrant | Total seconds | Saturated seconds | Saturation percentage |
|---|---|---|---|
| A | 7175 | 44 | 0.613240% |
| B | 7176 | 76 | 1.059086% |
| C | 7176 | 83 | 1.156633% |
| D | 7175 | 216 | 3.010453% |
Noise dominated data is calculated using 1-second bins in cleaned event files. If a bin has >2000 counts, and if more than 50% of those come from <1% of pixels, then it is considered to be noise-dominated and hence unusable.
| Quadrant | # 1 sec bins | Bins with >0 counts | Bins with >2000 counts | High rate bins dominated by noise | Noise dominated (total time) | Noise dominated (detector-on time) | Marked lightcurve |
|---|---|---|---|---|---|---|---|
| A | 7506 | 7177 | 0 | 0 | 0.00% | 0.00% | 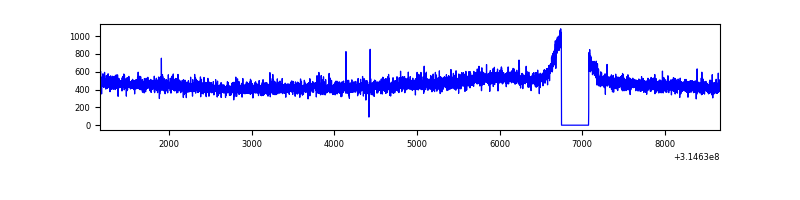 |
| B | 7507 | 7178 | 15 | 15 | 0.20% | 0.21% | 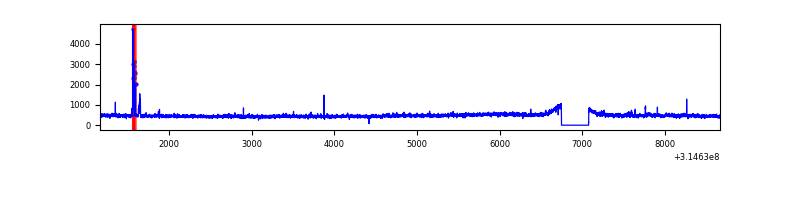 |
| C | 7507 | 7178 | 0 | 0 | 0.00% | 0.00% | 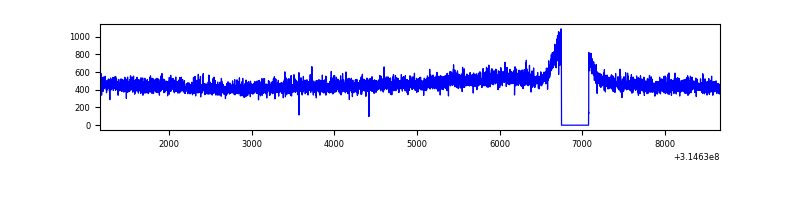 |
| D | 7506 | 7177 | 168 | 168 | 2.24% | 2.34% | 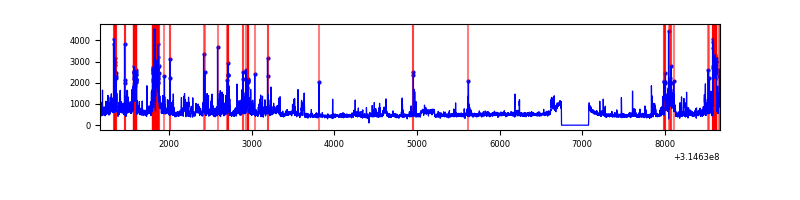 |
Top three noisy pixels from each quadrant. If the there are fewer than three noisy pixels in the level2.evt file, extra rows are filled as -1
| Pixel properties | Quadrant properties | ||||||
|---|---|---|---|---|---|---|---|
| Quadrant | DetID | PixID | Counts | Sigma | Mean | Median | Sigma |
| A | 13 | 254 | 11917 | 63.54 | 860 | 841 | 174.3 |
| A | 3 | 137 | 7471 | 38.03 | 860 | 841 | 174.3 |
| A | 0 | 226 | 7403 | 37.64 | 860 | 841 | 174.3 |
| B | 0 | 228 | 51149 | 302.76 | 851 | 827 | 166.2 |
| B | 0 | 189 | 36020 | 211.74 | 851 | 827 | 166.2 |
| B | 0 | 190 | 27672 | 161.51 | 851 | 827 | 166.2 |
| C | 14 | 238 | 128356 | 660.37 | 819 | 823 | 193.1 |
| C | 10 | 91 | 8254 | 38.48 | 819 | 823 | 193.1 |
| C | 13 | 61 | 5689 | 25.2 | 819 | 823 | 193.1 |
| D | 7 | 238 | 408689 | 2031.8 | 830 | 808 | 200.7 |
| D | 12 | 233 | 367724 | 1827.74 | 830 | 808 | 200.7 |
| D | 1 | 239 | 346946 | 1724.24 | 830 | 808 | 200.7 |
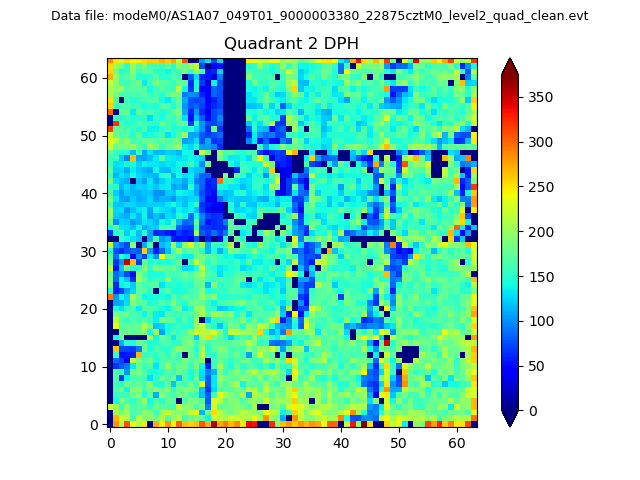
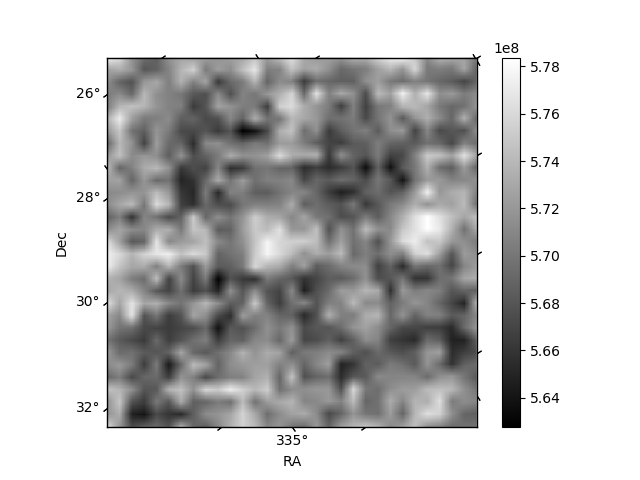
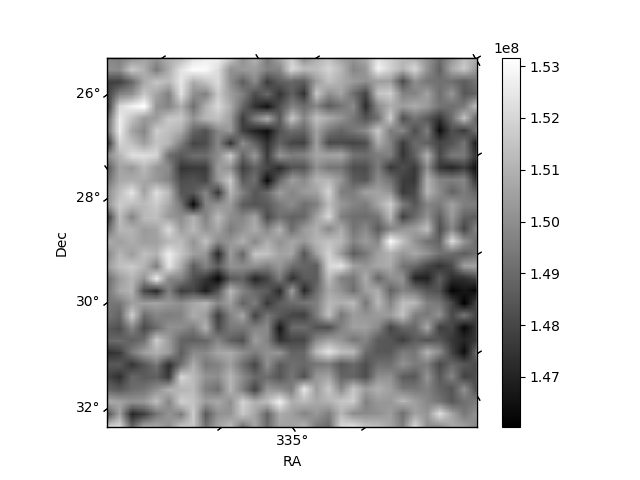
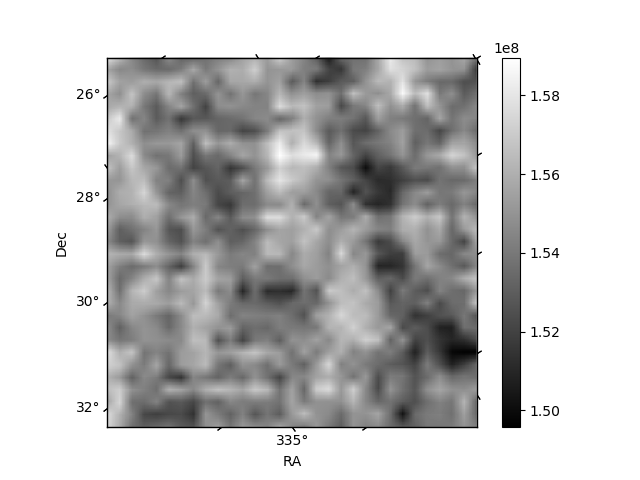
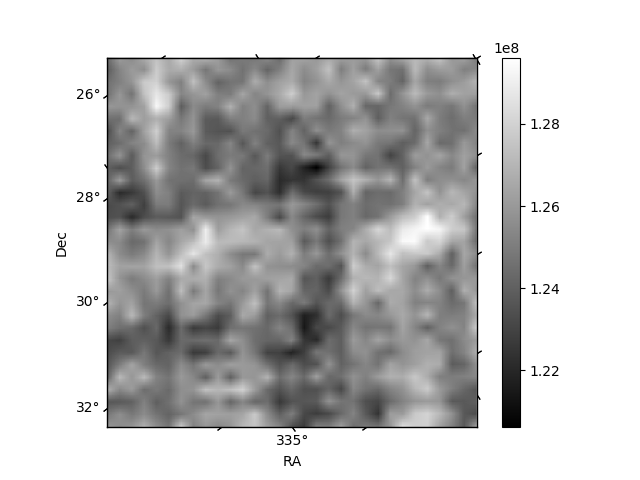
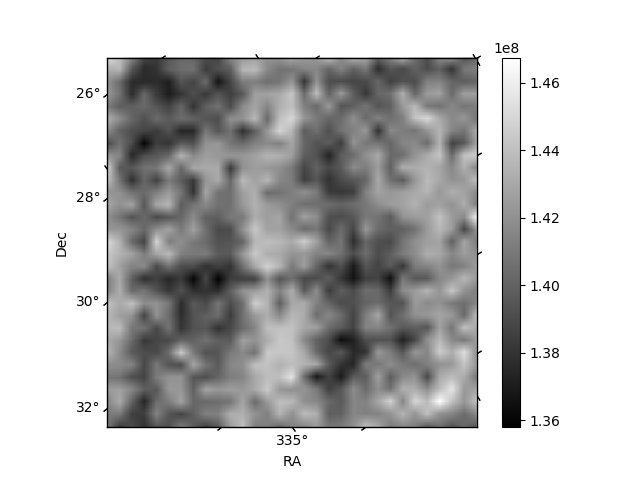
Histogram calculated using DETX and DETY for each event in the final _common_clean file
| Quadrant A | 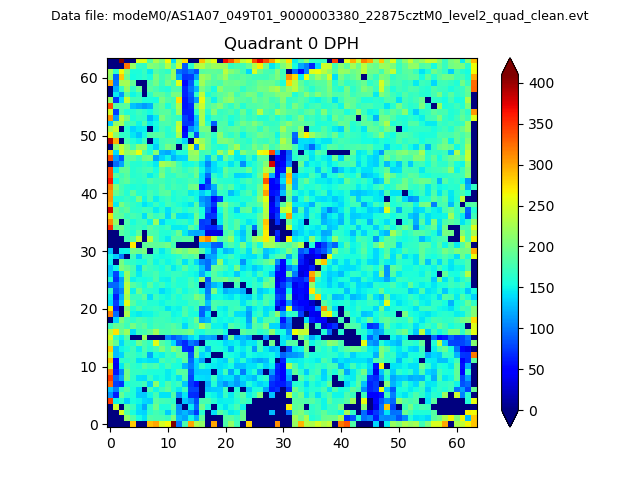 |
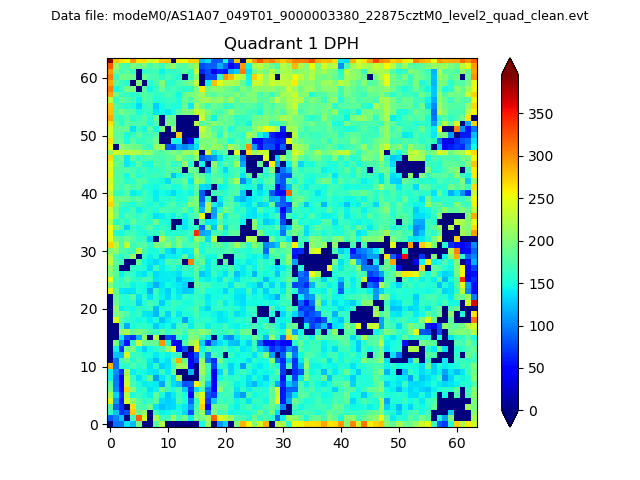 |
Quadrant B |
|---|---|---|---|
| Quadrant D | 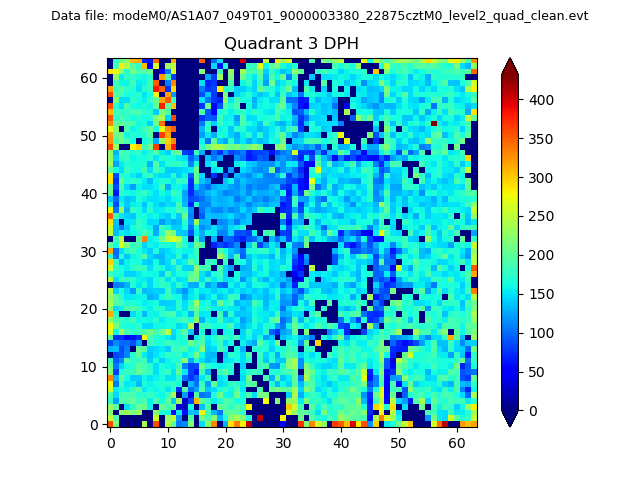 |
 |
Quadrant C |
| Plot type | Count rate plots | Images |
|---|---|---|
| Comparison with Poisson distribution Blue bars denote a histogram of data divided into 1 sec bins. Red curve is a Poisson curve with rate = median count rate of data. |
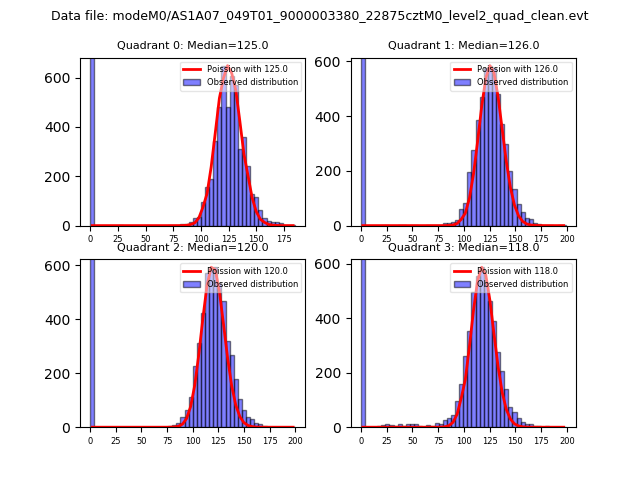 |
 |
| Quadrant-wise count rates Data is divided into 100 sec bins |
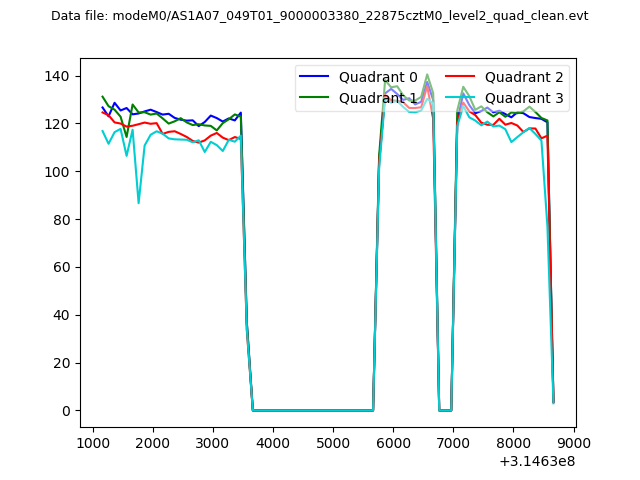 |
|
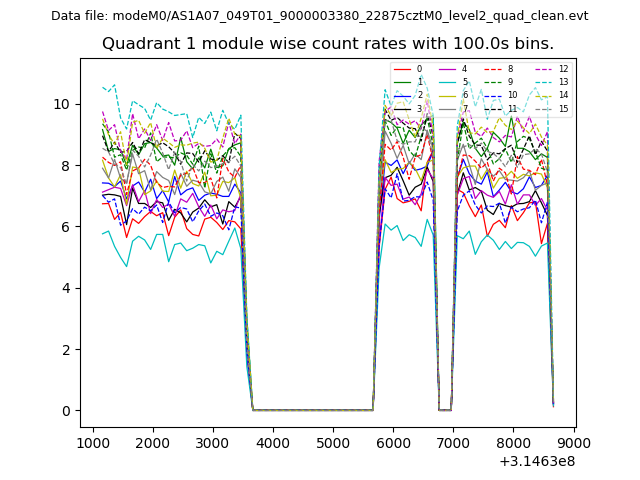
| Module-wise count rates for Quadrant A Data is divided into 100 sec bins |
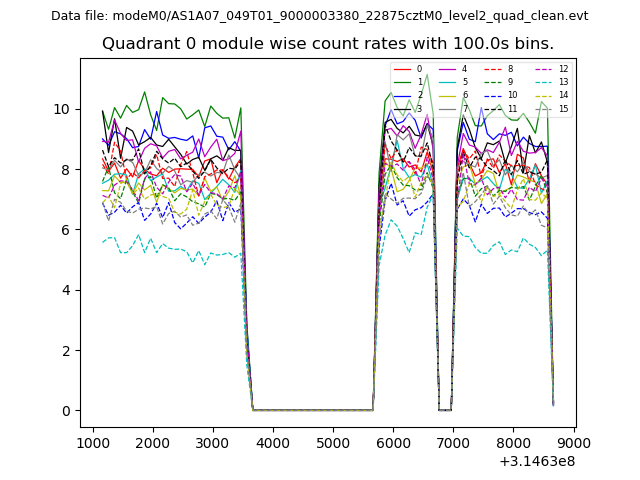 |
 |
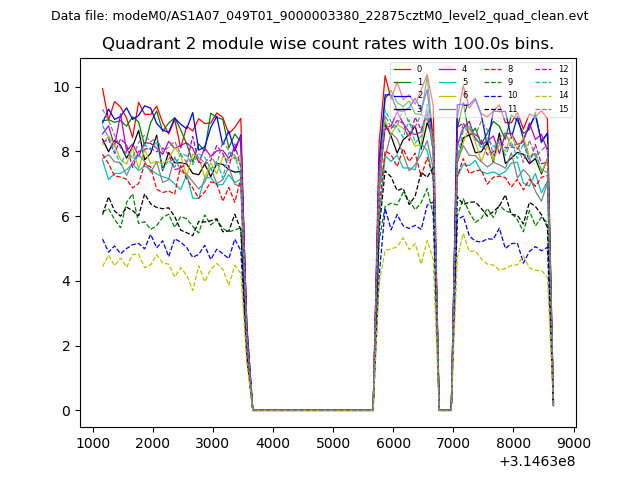
| Module-wise count rates for Quadrant B Data is divided into 100 sec bins |
 |
 |
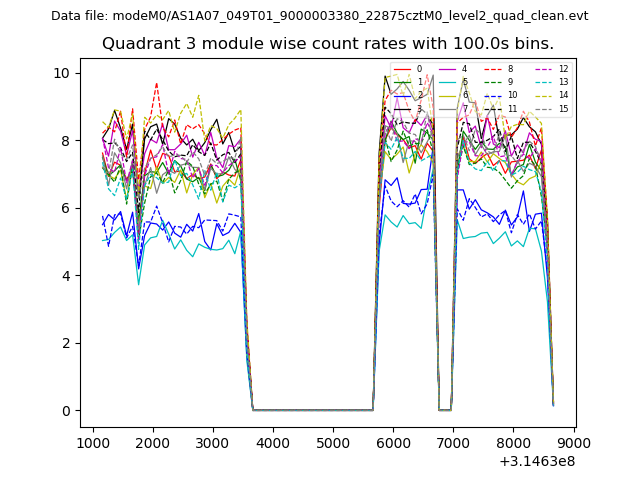
| Module-wise count rates for Quadrant C Data is divided into 100 sec bins |
 |
 |
| Module-wise count rates for Quadrant D Data is divided into 100 sec bins |
 |
 |
| Parameter | Plot |
|---|---|
| CZT HV Monitor | 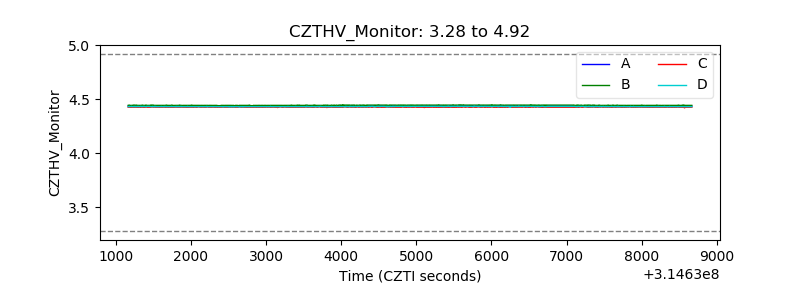 |
| D_VDD | 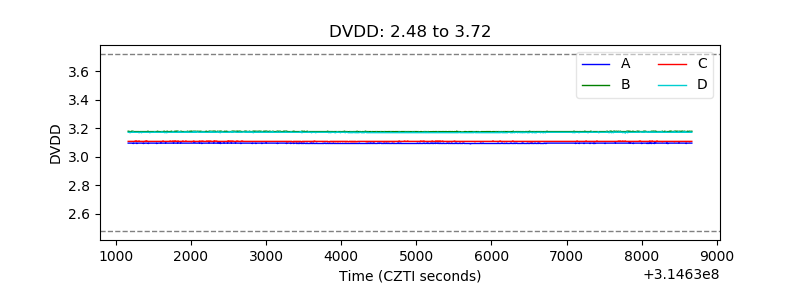 |
| Temperature 1 | 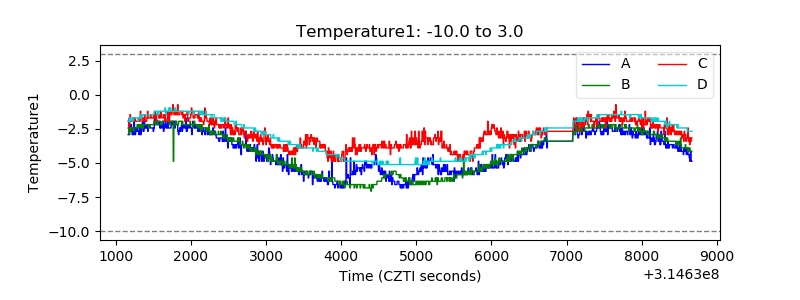 |
| Veto HV Monitor | 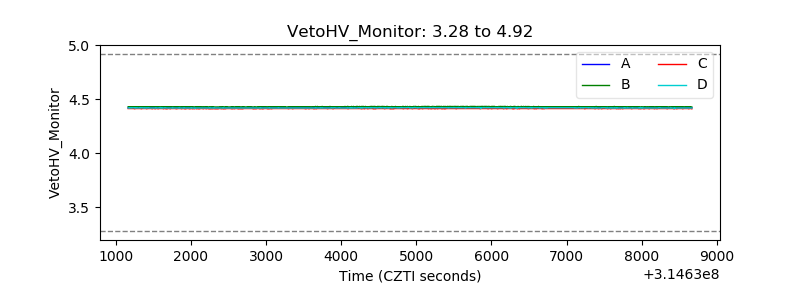 |
| Veto LLD | 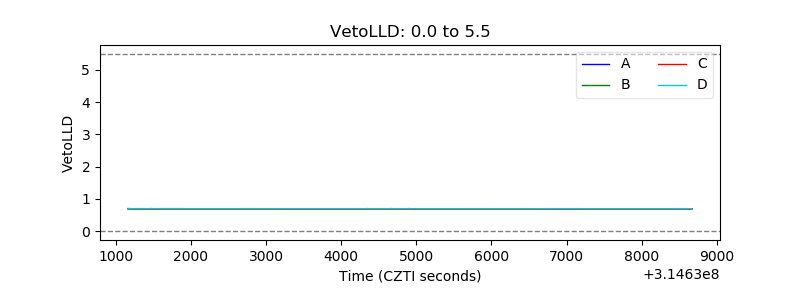 |
| Alpha Counter | 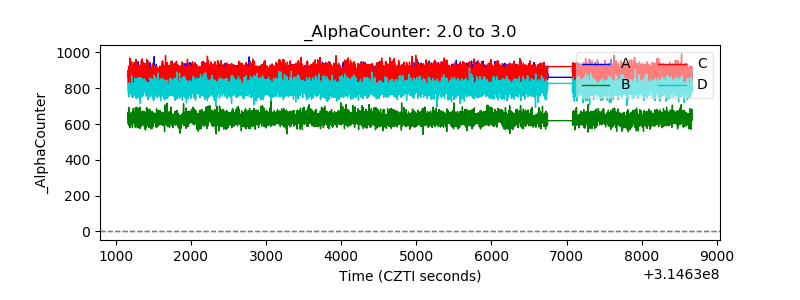 |
| _CPM_Rate | 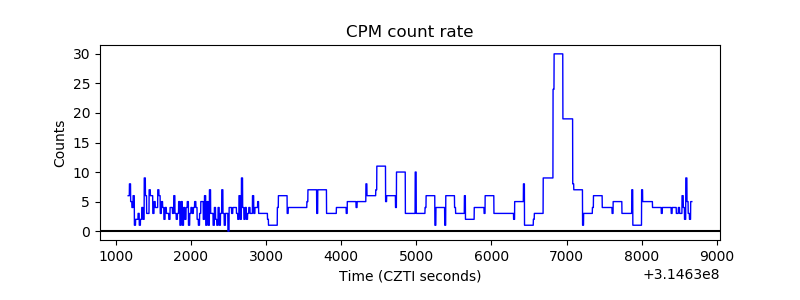 |
| CZT Counter | 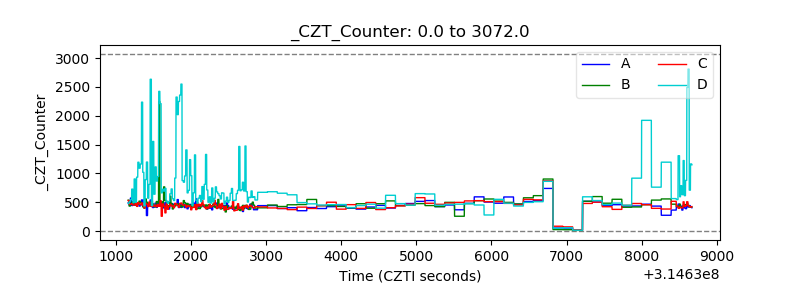 |
| +2.5 Volts monitor |  |
| +5 Volts monitor |  |
| _ROLL_ROT | 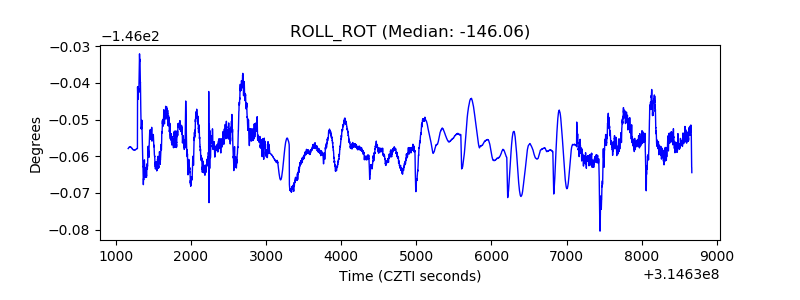 |
| _Roll_DEC | 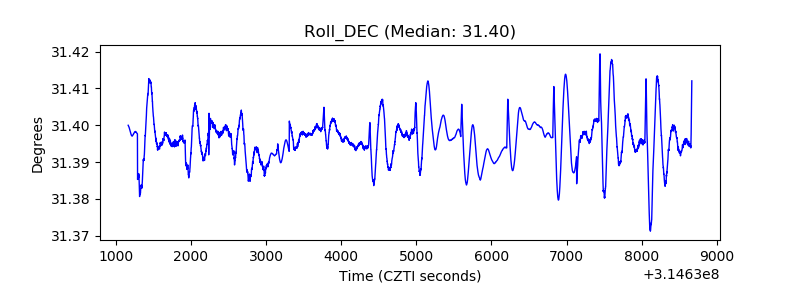 |
| _Roll_RA | 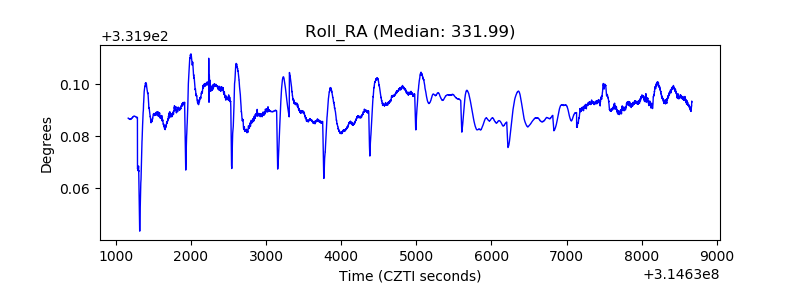 |
| Veto Counter | 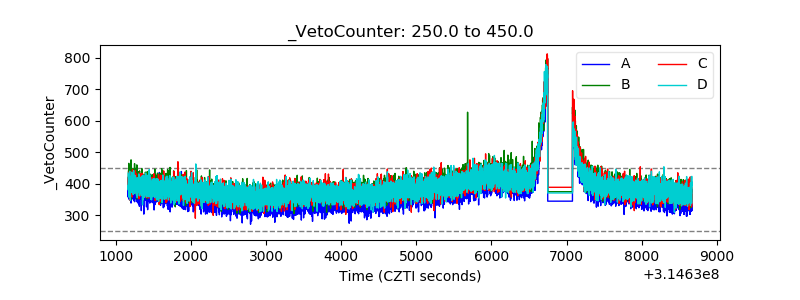 |