| Param | Original file | Final file |
|---|---|---|
| Filename | modeM0/AS1A07_049T01_9000003380_22881cztM0_level2.evt | modeM0/AS1A07_049T01_9000003380_22881cztM0_level2_quad_clean.evt |
| Size (bytes) | 486,771,840 | 68,722,560 |
| Size | 464.2 MB | 65.5 MB |
| Events in quadrant A | 3,242,974 | 418,299 |
| Events in quadrant B | 3,301,599 | 426,800 |
| Events in quadrant C | 3,284,112 | 405,298 |
| Events in quadrant D | 4,462,588 | 367,377 |
| Mode M0 | |||
|---|---|---|---|
| Quadrant | BADHDUFLAG | Total packets | Discarded packets |
| A | 0 | 13805 | 2 |
| B | 0 | 13919 | 2 |
| C | 0 | 13918 | 2 |
| D | 0 | 17758 | 2 |
| Mode M9 | |||
|---|---|---|---|
| Quadrant | BADHDUFLAG | Total packets | Discarded packets |
| A | 0 | 17 | 0 |
| B | 0 | 18 | 0 |
| C | 0 | 18 | 0 |
| D | 0 | 18 | 0 |
| Mode SS | |||
|---|---|---|---|
| Quadrant | BADHDUFLAG | Total packets | Discarded packets |
| A | 0 | 140272886971272 | 46 |
| B | 0 | -1 | -1 |
| C | 0 | -1 | -1 |
| D | 0 | -1 | -1 |
| Quadrant | Total seconds | Saturated seconds | Saturation percentage |
|---|---|---|---|
| A | 6639 | 43 | 0.647688% |
| B | 6638 | 50 | 0.753239% |
| C | 6638 | 79 | 1.190118% |
| D | 6638 | 380 | 5.724616% |
Noise dominated data is calculated using 1-second bins in cleaned event files. If a bin has >2000 counts, and if more than 50% of those come from <1% of pixels, then it is considered to be noise-dominated and hence unusable.
| Quadrant | # 1 sec bins | Bins with >0 counts | Bins with >2000 counts | High rate bins dominated by noise | Noise dominated (total time) | Noise dominated (detector-on time) | Marked lightcurve |
|---|---|---|---|---|---|---|---|
| A | 7699 | 6640 | 5 | 5 | 0.06% | 0.08% | 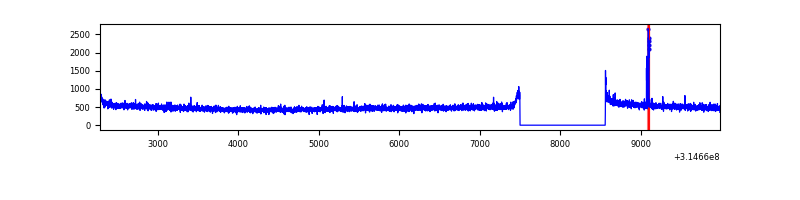 |
| B | 7698 | 6639 | 1 | 1 | 0.01% | 0.02% | 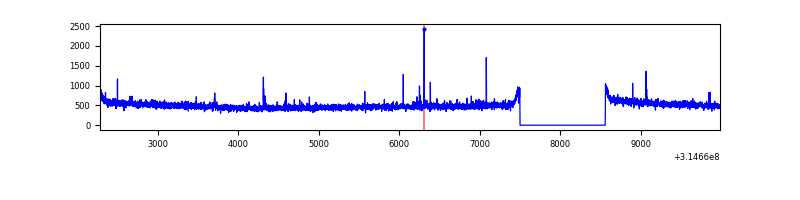 |
| C | 7698 | 6639 | 1 | 1 | 0.01% | 0.02% | 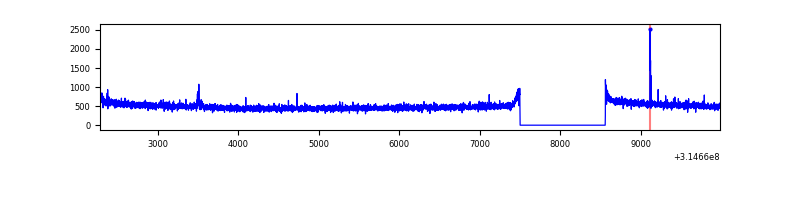 |
| D | 7698 | 6639 | 301 | 301 | 3.91% | 4.53% | 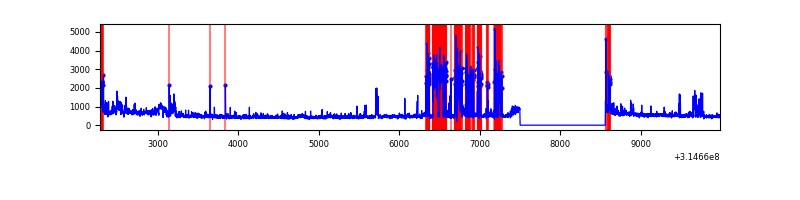 |
Top three noisy pixels from each quadrant. If the there are fewer than three noisy pixels in the level2.evt file, extra rows are filled as -1
| Pixel properties | Quadrant properties | ||||||
|---|---|---|---|---|---|---|---|
| Quadrant | DetID | PixID | Counts | Sigma | Mean | Median | Sigma |
| A | 0 | 23 | 26173 | 151.27 | 833 | 816 | 167.6 |
| A | 13 | 254 | 9861 | 53.96 | 833 | 816 | 167.6 |
| A | 0 | 226 | 8733 | 47.23 | 833 | 816 | 167.6 |
| B | 12 | 111 | 19406 | 115.95 | 834 | 813 | 160.4 |
| B | 11 | 111 | 17061 | 101.32 | 834 | 813 | 160.4 |
| B | 14 | 111 | 15300 | 90.34 | 834 | 813 | 160.4 |
| C | 14 | 238 | 128148 | 679.57 | 802 | 808 | 187.4 |
| C | 2 | 16 | 25573 | 132.16 | 802 | 808 | 187.4 |
| C | 13 | 61 | 5503 | 25.06 | 802 | 808 | 187.4 |
| D | 1 | 52 | 967237 | 5064.36 | 785 | 764 | 190.8 |
| D | 7 | 238 | 281056 | 1468.74 | 785 | 764 | 190.8 |
| D | 12 | 233 | 99152 | 515.56 | 785 | 764 | 190.8 |
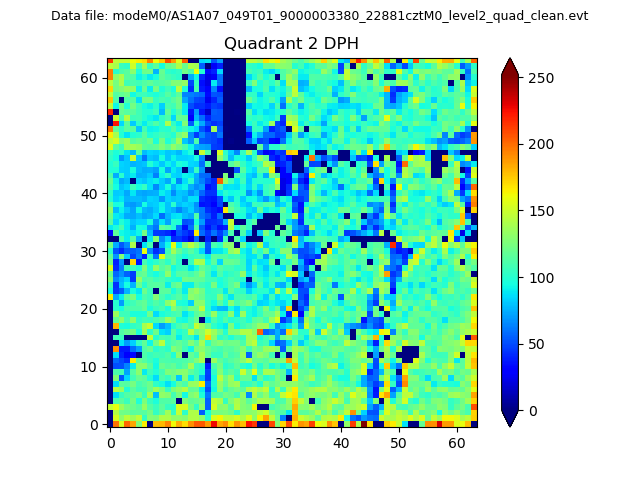
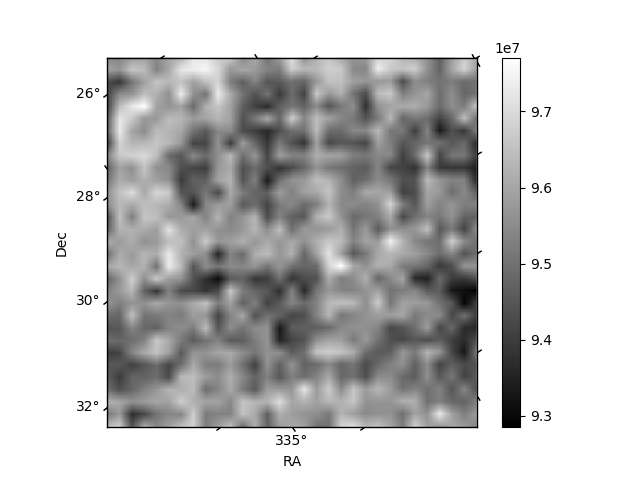
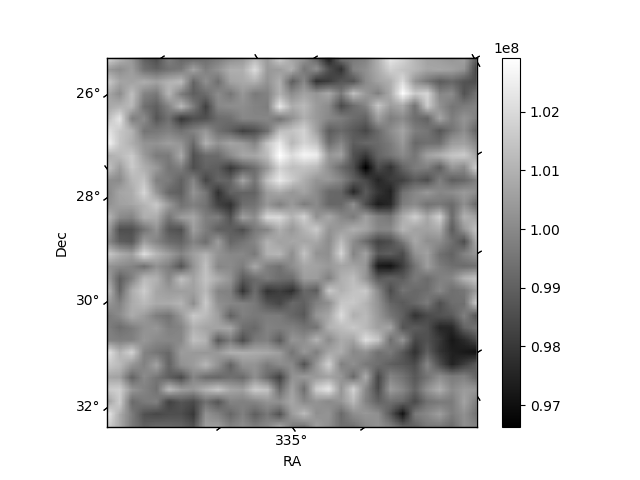
Histogram calculated using DETX and DETY for each event in the final _common_clean file
| Quadrant A |  |
 |
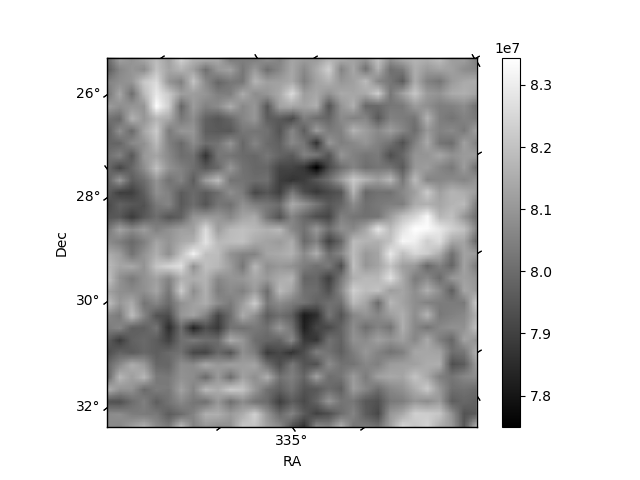
Quadrant B |
|---|---|---|---|
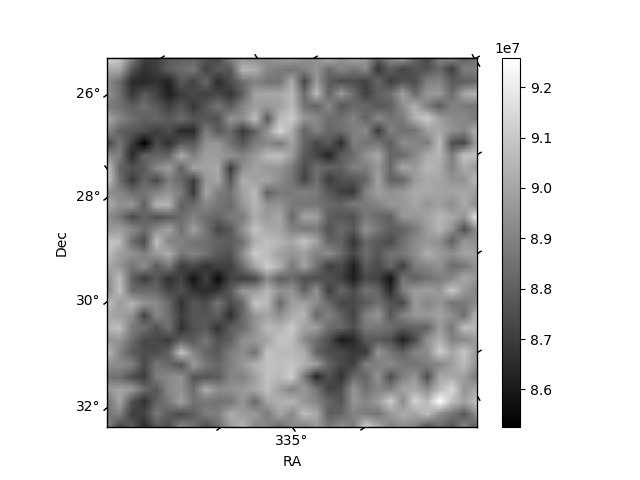
| Quadrant D | 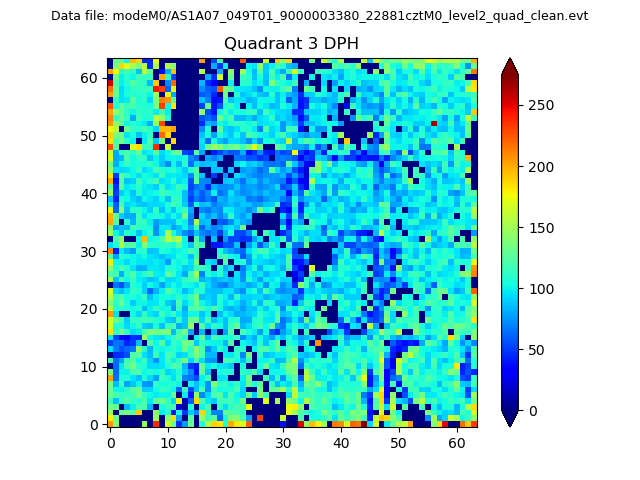 |
 |
Quadrant C |
| Plot type | Count rate plots | Images |
|---|---|---|
| Comparison with Poisson distribution Blue bars denote a histogram of data divided into 1 sec bins. Red curve is a Poisson curve with rate = median count rate of data. |
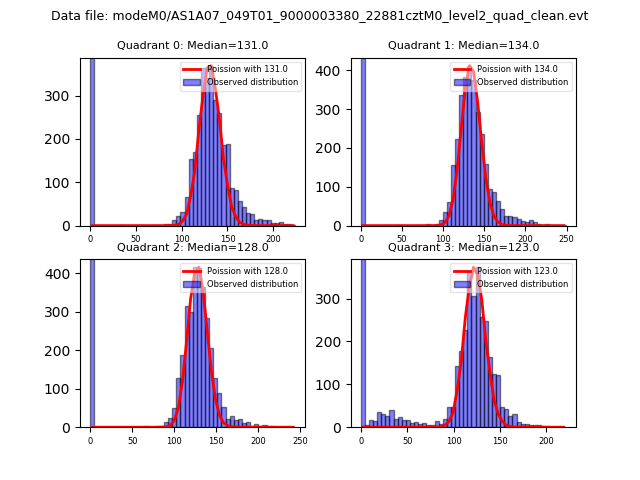 |
 |
| Quadrant-wise count rates Data is divided into 100 sec bins |
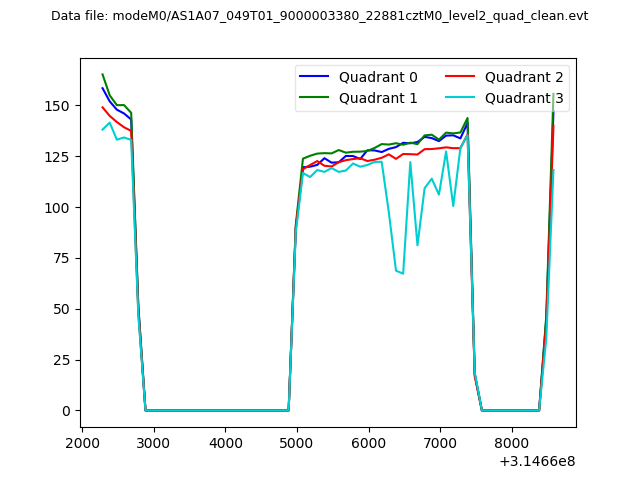 |
|
| Module-wise count rates for Quadrant A Data is divided into 100 sec bins |
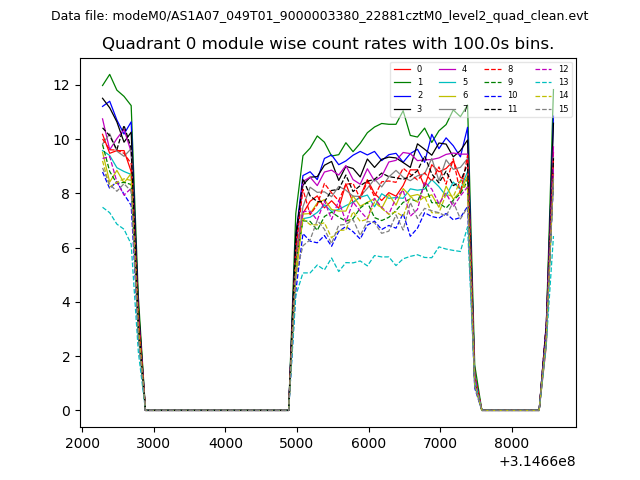 |
 |
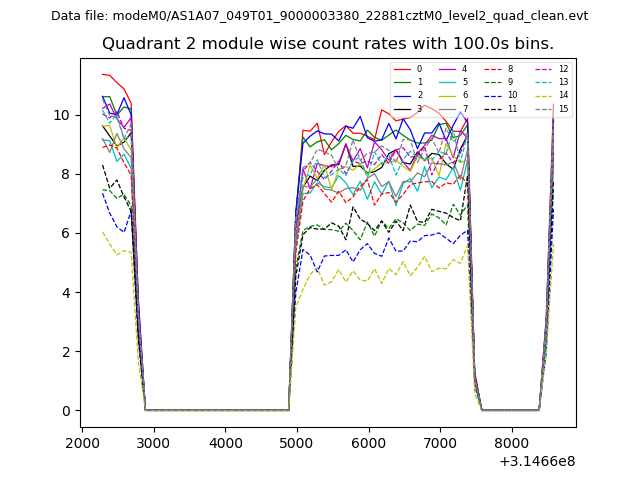
| Module-wise count rates for Quadrant B Data is divided into 100 sec bins |
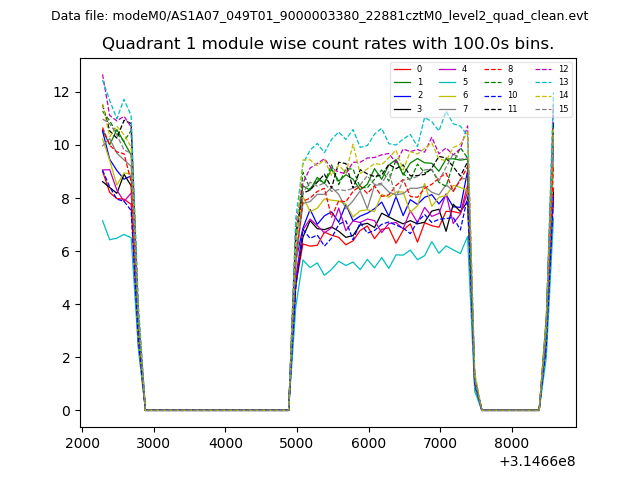 |
 |
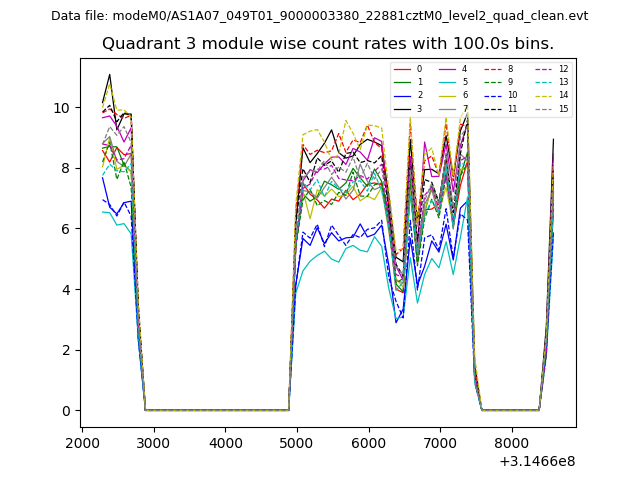
| Module-wise count rates for Quadrant C Data is divided into 100 sec bins |
 |
 |
| Module-wise count rates for Quadrant D Data is divided into 100 sec bins |
 |
 |
| Parameter | Plot |
|---|---|
| CZT HV Monitor | 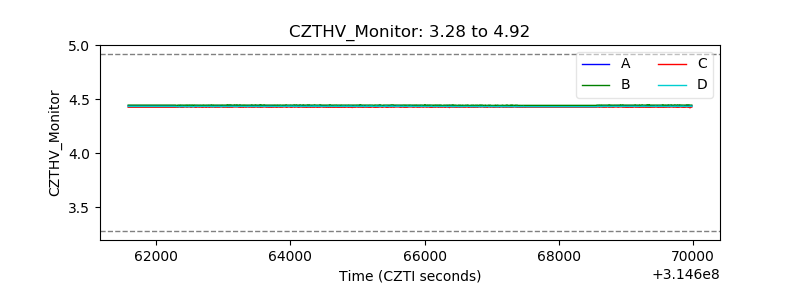 |
| D_VDD | 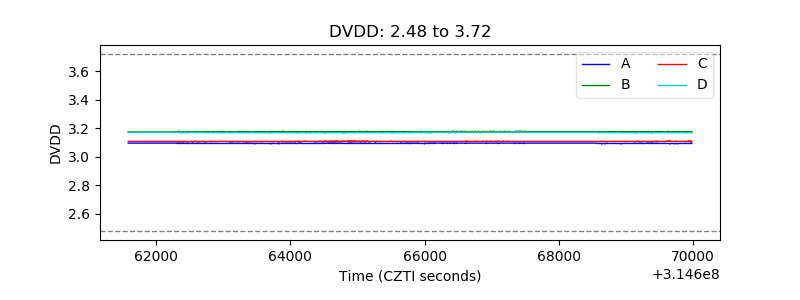 |
| Temperature 1 | 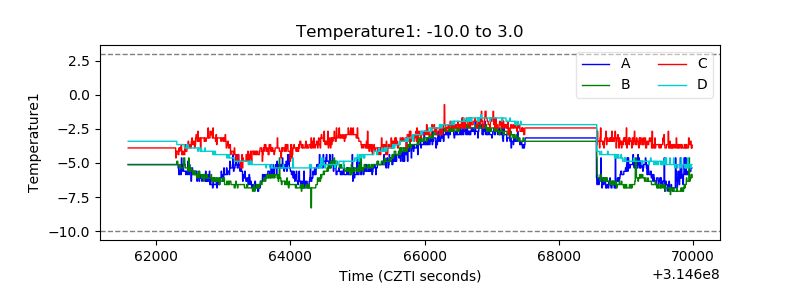 |
| Veto HV Monitor |  |
| Veto LLD | 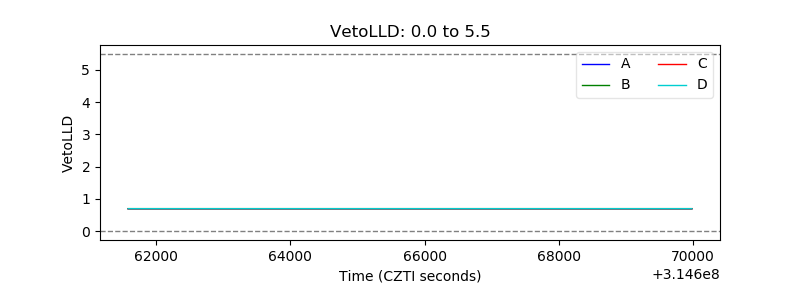 |
| Alpha Counter | 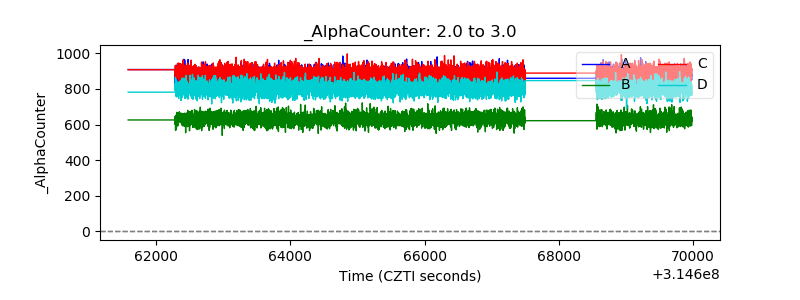 |
| _CPM_Rate | 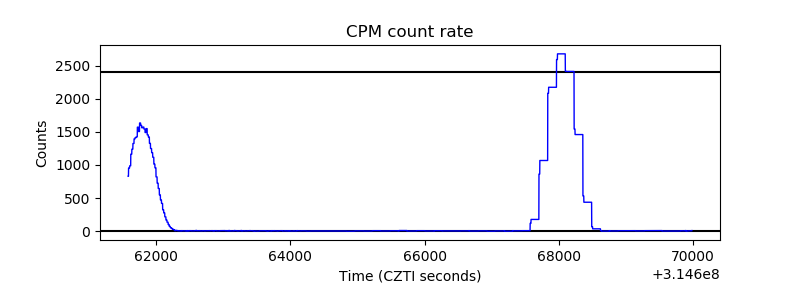 |
| CZT Counter | 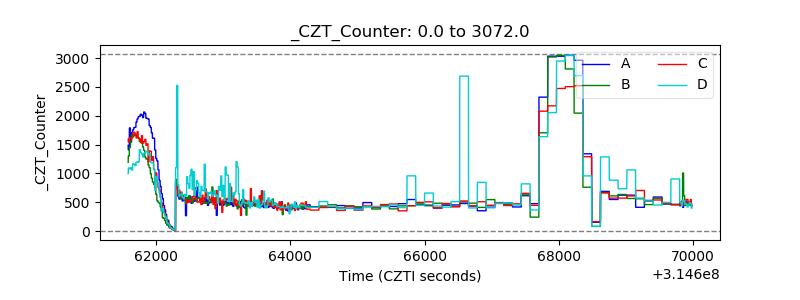 |
| +2.5 Volts monitor |  |
| +5 Volts monitor |  |
| _ROLL_ROT | 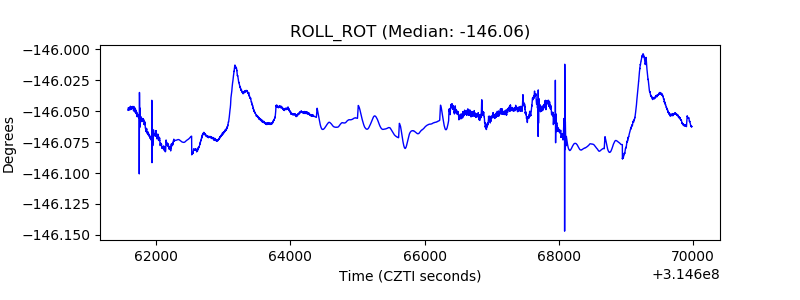 |
| _Roll_DEC |  |
| _Roll_RA | 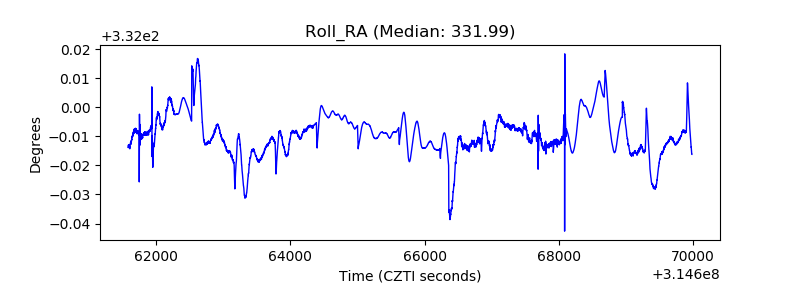 |
| Veto Counter | 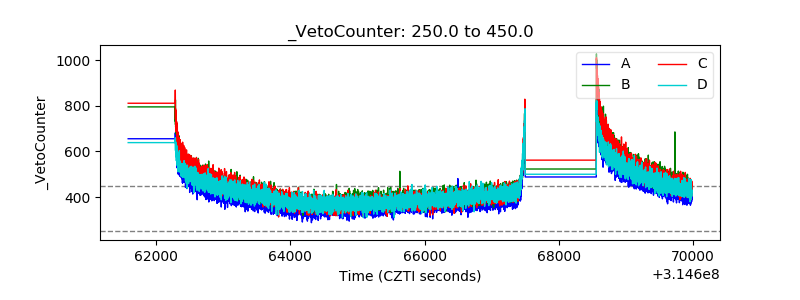 |