| Param | Original file | Final file |
|---|---|---|
| Filename | modeM0/AS1A07_049T01_9000003380_22882cztM0_level2.evt | modeM0/AS1A07_049T01_9000003380_22882cztM0_level2_quad_clean.evt |
| Size (bytes) | 131,757,120 | 6,672,960 |
| Size | 125.7 MB | 6.4 MB |
| Events in quadrant A | 933,132 | 19,223 |
| Events in quadrant B | 942,851 | 20,324 |
| Events in quadrant C | 948,063 | 18,242 |
| Events in quadrant D | 1,044,946 | 15,432 |
| Mode M0 | |||
|---|---|---|---|
| Quadrant | BADHDUFLAG | Total packets | Discarded packets |
| A | 0 | 3814 | 1 |
| B | 0 | 3833 | 1 |
| C | 0 | 3847 | 1 |
| D | 0 | 4223 | 1 |
| Mode M9 | |||
|---|---|---|---|
| Quadrant | BADHDUFLAG | Total packets | Discarded packets |
| A | 0 | 5 | 0 |
| B | 0 | 6 | 0 |
| C | 0 | 6 | 0 |
| D | 0 | 6 | 0 |
| Mode SS | |||
|---|---|---|---|
| Quadrant | BADHDUFLAG | Total packets | Discarded packets |
| A | 0 | 36 | 0 |
| B | 0 | 36 | 0 |
| C | 0 | 36 | 0 |
| D | 0 | 36 | 0 |
| Quadrant | Total seconds | Saturated seconds | Saturation percentage |
|---|---|---|---|
| A | 1740 | 13 | 0.747126% |
| B | 1740 | 12 | 0.689655% |
| C | 1740 | 32 | 1.839080% |
| D | 1740 | 26 | 1.494253% |
Noise dominated data is calculated using 1-second bins in cleaned event files. If a bin has >2000 counts, and if more than 50% of those come from <1% of pixels, then it is considered to be noise-dominated and hence unusable.
| Quadrant | # 1 sec bins | Bins with >0 counts | Bins with >2000 counts | High rate bins dominated by noise | Noise dominated (total time) | Noise dominated (detector-on time) | Marked lightcurve |
|---|---|---|---|---|---|---|---|
| A | 1740 | 1740 | 5 | 5 | 0.29% | 0.29% | 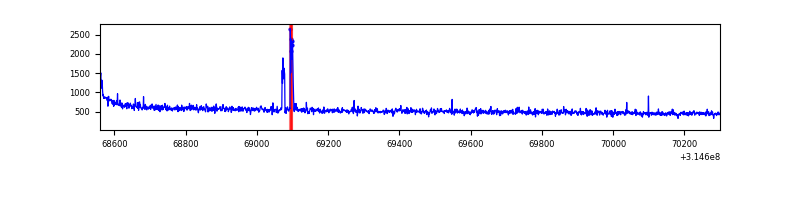 |
| B | 1740 | 1740 | 0 | 0 | 0.00% | 0.00% | 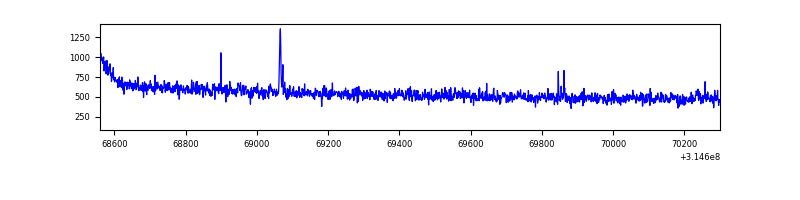 |
| C | 1740 | 1740 | 1 | 1 | 0.06% | 0.06% | 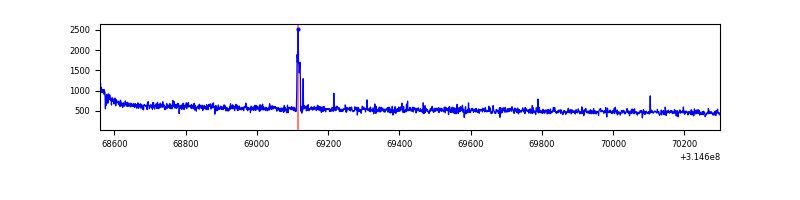 |
| D | 1740 | 1740 | 15 | 15 | 0.86% | 0.86% | 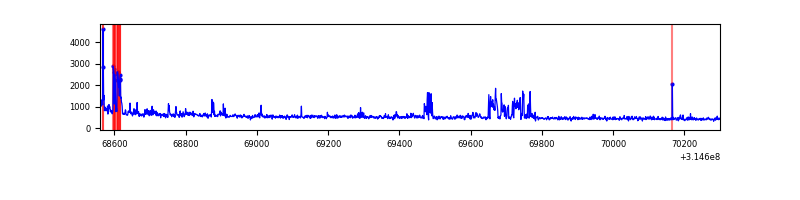 |
Top three noisy pixels from each quadrant. If the there are fewer than three noisy pixels in the level2.evt file, extra rows are filled as -1
| Pixel properties | Quadrant properties | ||||||
|---|---|---|---|---|---|---|---|
| Quadrant | DetID | PixID | Counts | Sigma | Mean | Median | Sigma |
| A | 0 | 23 | 22528 | 458.97 | 234 | 230 | 48.6 |
| A | 2 | 79 | 4435 | 86.55 | 234 | 230 | 48.6 |
| A | 0 | 226 | 3264 | 62.45 | 234 | 230 | 48.6 |
| B | 3 | 64 | 6528 | 136.03 | 238 | 232 | 46.3 |
| B | 4 | 173 | 6243 | 129.88 | 238 | 232 | 46.3 |
| B | 12 | 111 | 5326 | 110.06 | 238 | 232 | 46.3 |
| C | 14 | 238 | 37391 | 674.77 | 229 | 231 | 55.1 |
| C | 2 | 16 | 15703 | 280.95 | 229 | 231 | 55.1 |
| C | 13 | 61 | 1620 | 25.22 | 229 | 231 | 55.1 |
| D | 7 | 238 | 94521 | 1677.96 | 225 | 218 | 56.2 |
| D | 1 | 52 | 54805 | 971.28 | 225 | 218 | 56.2 |
| D | 13 | 153 | 25147 | 443.57 | 225 | 218 | 56.2 |
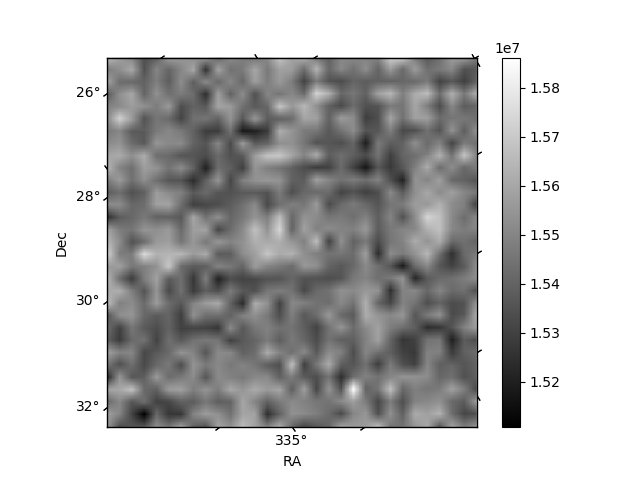
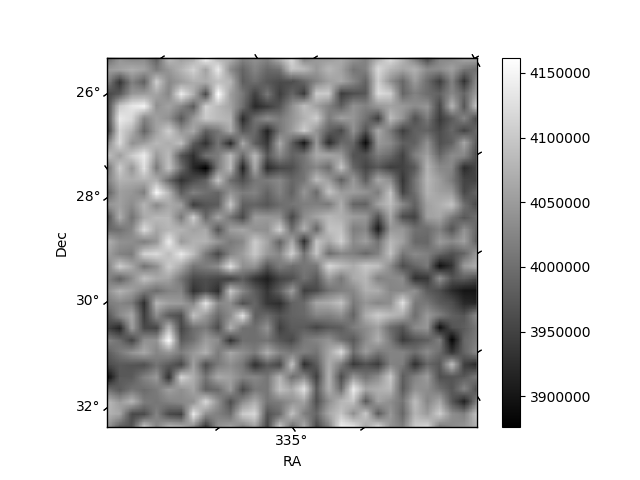
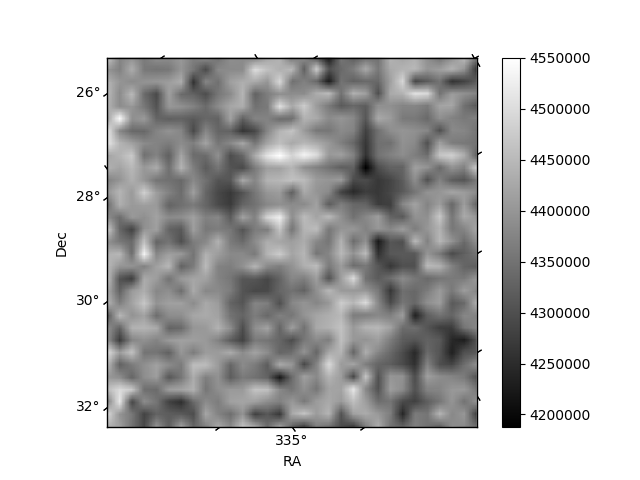
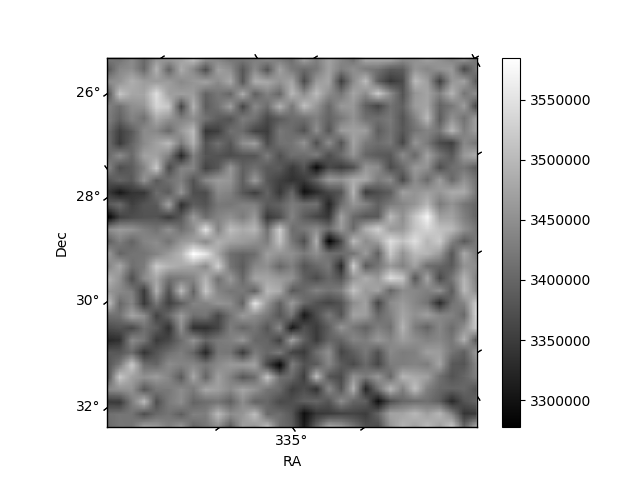
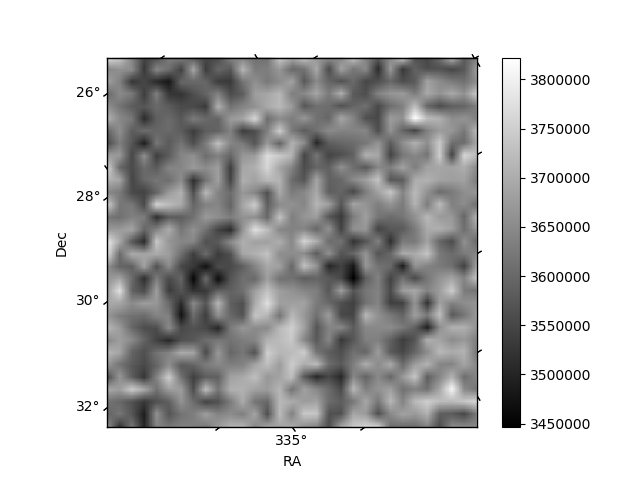
Histogram calculated using DETX and DETY for each event in the final _common_clean file
| Quadrant A | 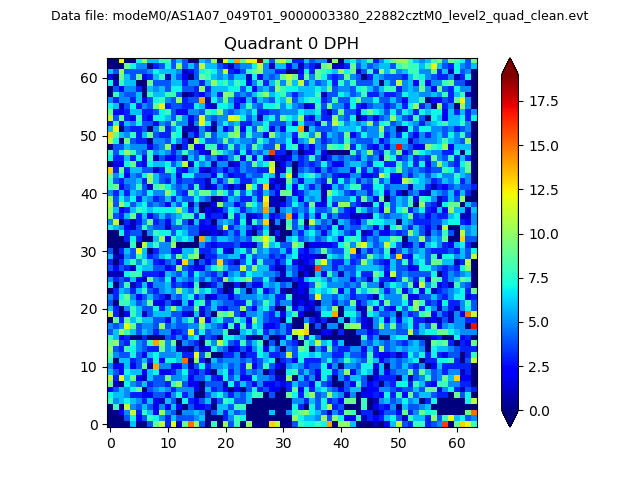 |
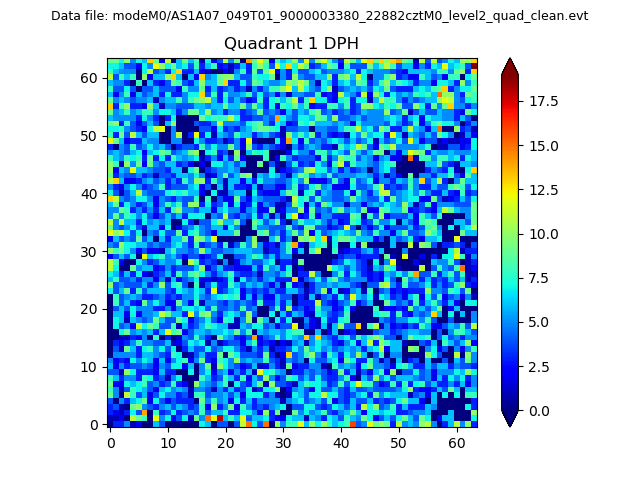 |
Quadrant B |
|---|---|---|---|
| Quadrant D | 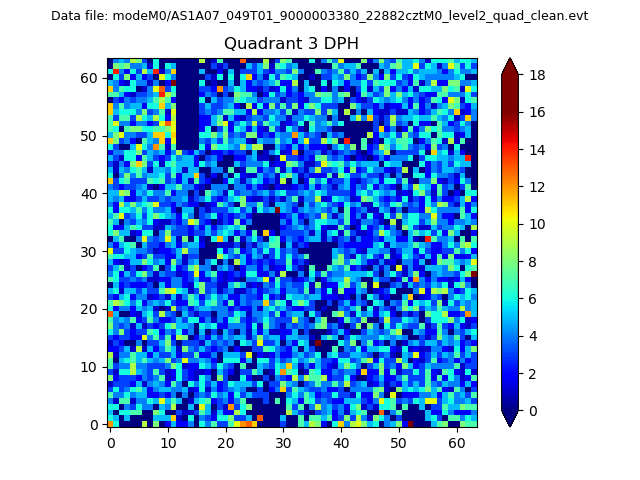 |
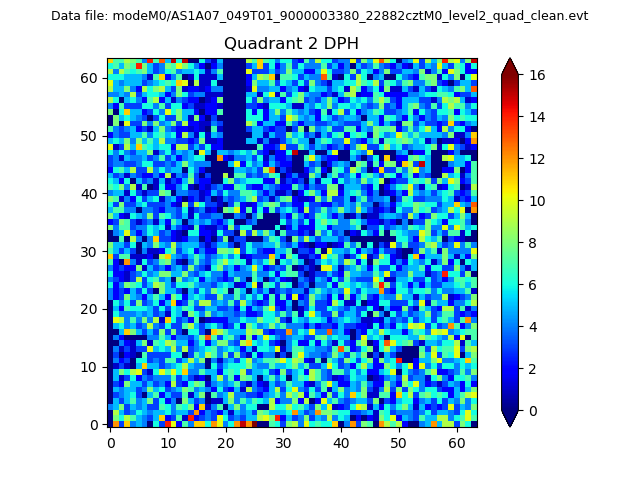 |
Quadrant C |
| Plot type | Count rate plots | Images |
|---|---|---|
| Comparison with Poisson distribution Blue bars denote a histogram of data divided into 1 sec bins. Red curve is a Poisson curve with rate = median count rate of data. |
 |
 |
| Quadrant-wise count rates Data is divided into 100 sec bins |
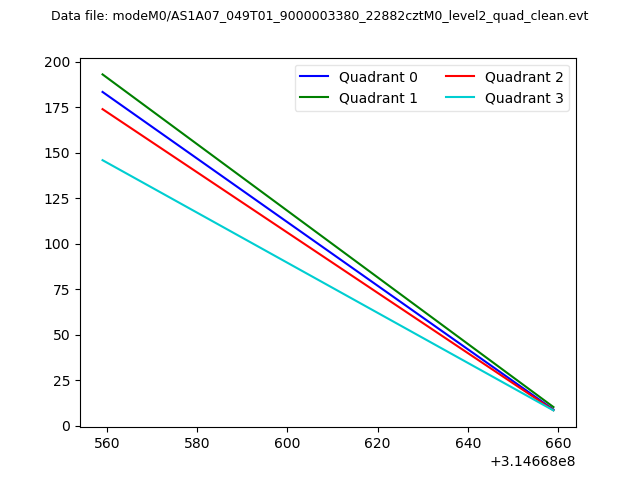 |
|
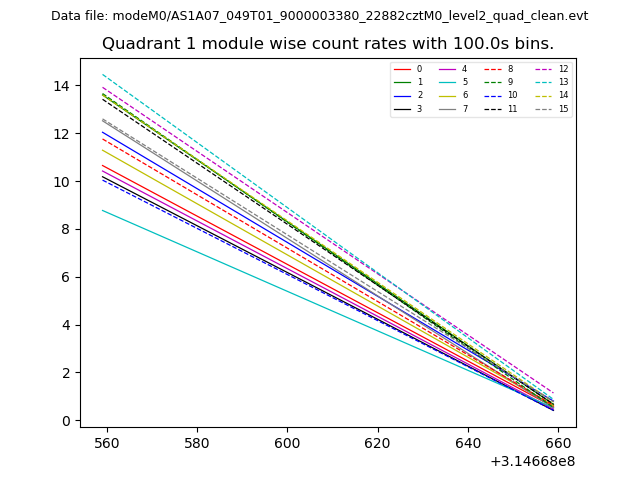
| Module-wise count rates for Quadrant A Data is divided into 100 sec bins |
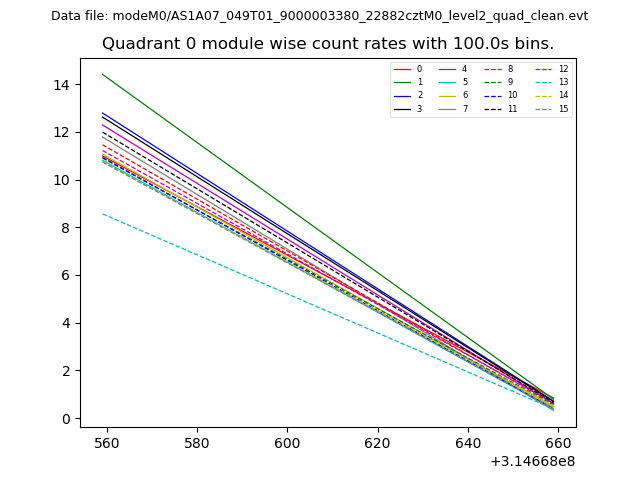 |
 |
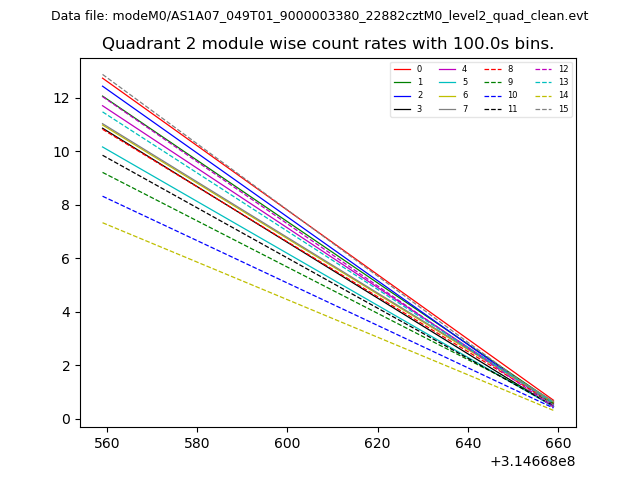
| Module-wise count rates for Quadrant B Data is divided into 100 sec bins |
 |
 |
| Module-wise count rates for Quadrant C Data is divided into 100 sec bins |
 |
 |
| Module-wise count rates for Quadrant D Data is divided into 100 sec bins |
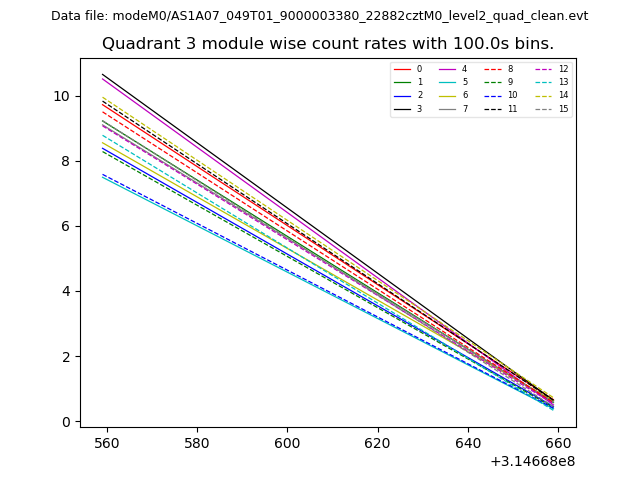 |
 |
| Parameter | Plot |
|---|---|
| CZT HV Monitor | 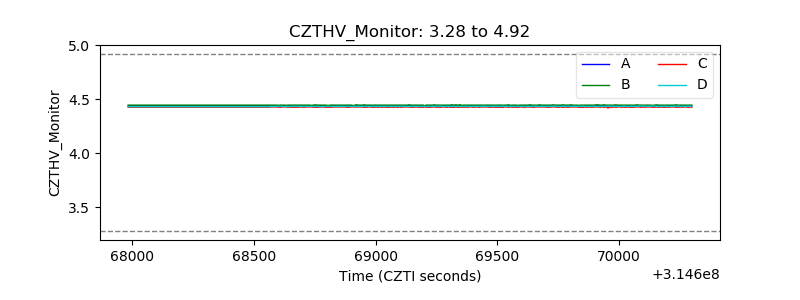 |
| D_VDD | 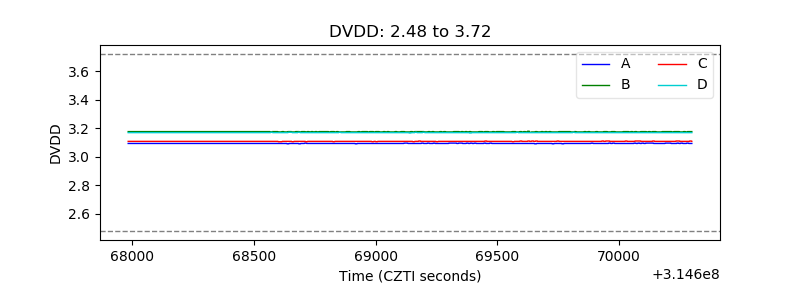 |
| Temperature 1 | 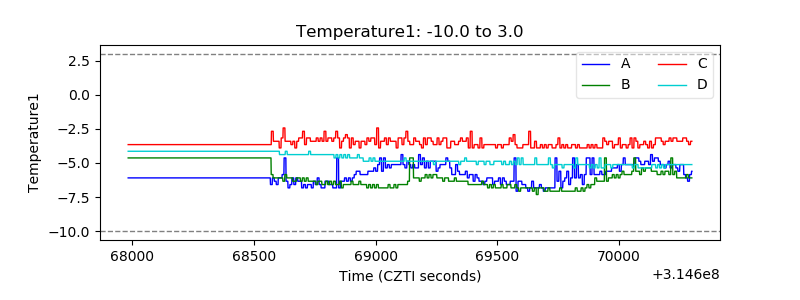 |
| Veto HV Monitor | 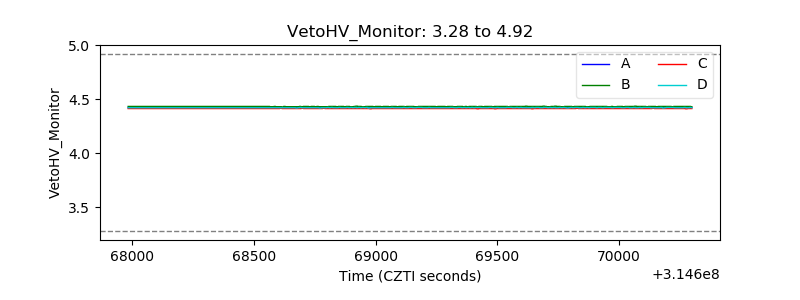 |
| Veto LLD | 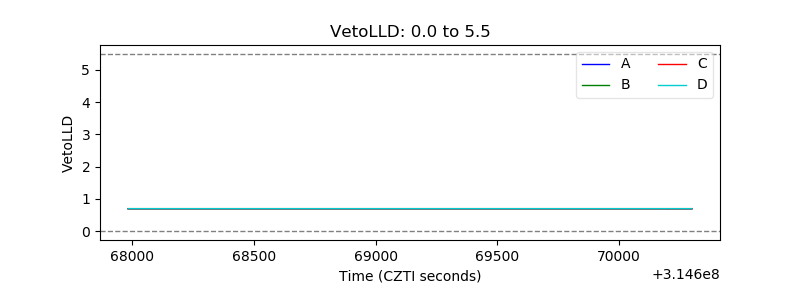 |
| Alpha Counter | 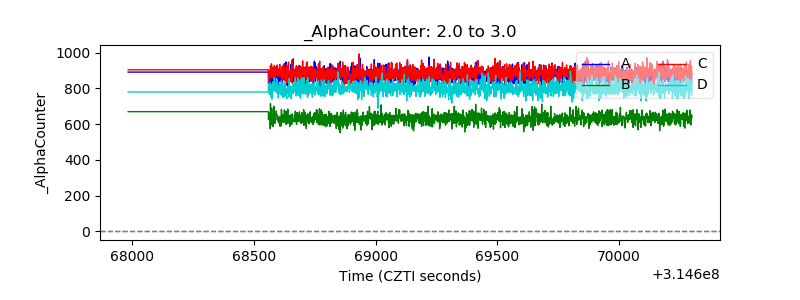 |
| _CPM_Rate |  |
| CZT Counter | 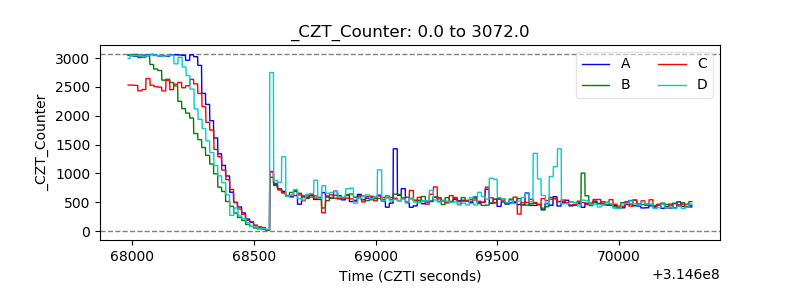 |
| +2.5 Volts monitor |  |
| +5 Volts monitor |  |
| _ROLL_ROT | 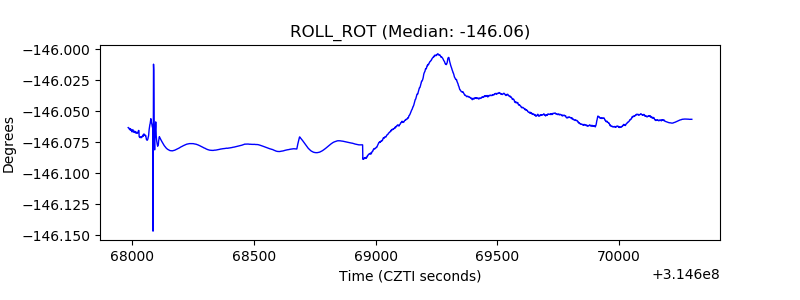 |
| _Roll_DEC | 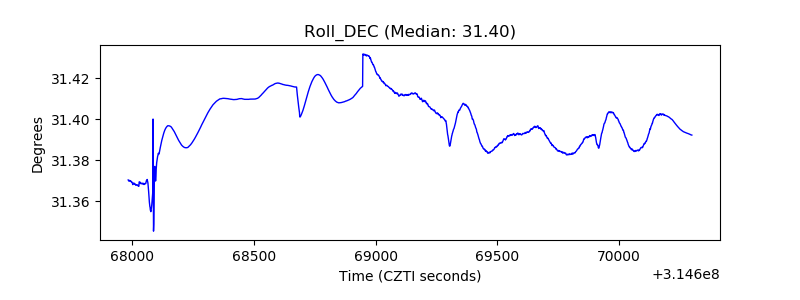 |
| _Roll_RA | 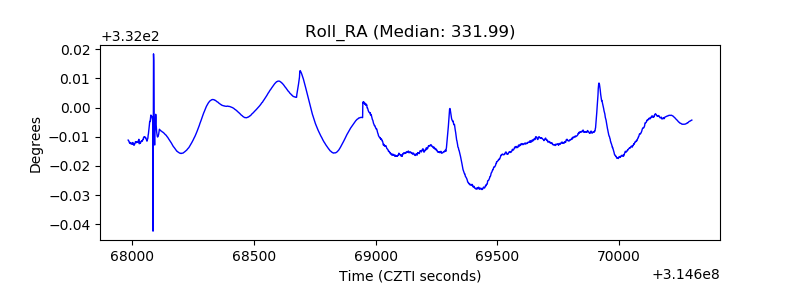 |
| Veto Counter | 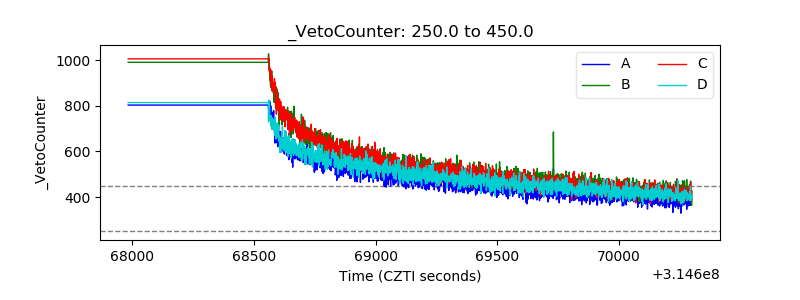 |