| Param | Original file | Final file |
|---|---|---|
| Filename | modeM0/AS1A08_009T01_9000003382cztM0_level2.fits | modeM0/AS1A08_009T01_9000003382cztM0_level2_quad_clean.evt |
| Size (bytes) | 1,384,200,000 | 1,345,023,360 |
| Size | 1.3 GB | 1.3 GB |
| Events in quadrant A | 8,612,316 | 8,189,869 |
| Events in quadrant B | 8,226,818 | 8,239,809 |
| Events in quadrant C | 8,295,472 | 7,777,621 |
| Events in quadrant D | 7,009,419 | 6,754,199 |
| Mode M9 | |||
|---|---|---|---|
| Quadrant | BADHDUFLAG | Total packets | Discarded packets |
| A | 0 | 245 | 0 |
| B | 0 | 246 | 0 |
| C | 0 | 246 | 0 |
| D | 0 | 246 | 0 |
| Mode M0 | |||
|---|---|---|---|
| Quadrant | BADHDUFLAG | Total packets | Discarded packets |
| A | 0 | 293723 | 0 |
| B | 0 | 300849 | 0 |
| C | 0 | 296277 | 0 |
| D | 0 | 429145 | 0 |
| Mode SS | |||
|---|---|---|---|
| Quadrant | BADHDUFLAG | Total packets | Discarded packets |
| A | 0 | 2902 | 0 |
| B | 0 | 2904 | 0 |
| C | 0 | 2904 | 0 |
| D | 0 | 2902 | 0 |
| Quadrant | Total seconds | Saturated seconds | Saturation percentage |
|---|---|---|---|
| A | 142636 | 1333 | 0.934547% |
| B | 142655 | 1659 | 1.162946% |
| C | 142644 | 2112 | 1.480609% |
| D | 142643 | 9948 | 6.974054% |
Noise dominated data is calculated using 1-second bins in cleaned event files. If a bin has >2000 counts, and if more than 50% of those come from <1% of pixels, then it is considered to be noise-dominated and hence unusable.
| Quadrant | # 1 sec bins | Bins with >0 counts | Bins with >2000 counts | High rate bins dominated by noise | Noise dominated (total time) | Noise dominated (detector-on time) | Marked lightcurve |
|---|---|---|---|---|---|---|---|
| A | 209035 | 142711 | 0 | 0 | 0.00% | 0.00% |  |
| B | 209035 | 142739 | 0 | 0 | 0.00% | 0.00% |  |
| C | 209035 | 142703 | 0 | 0 | 0.00% | 0.00% | 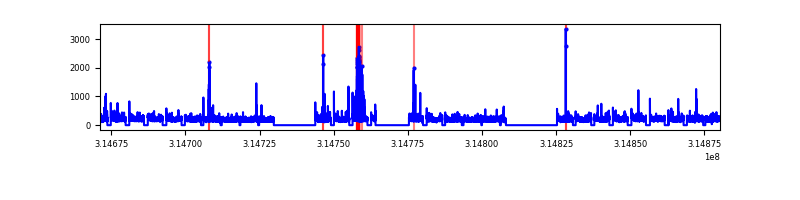 |
| D | 209035 | 142651 | 0 | 0 | 0.00% | 0.00% | 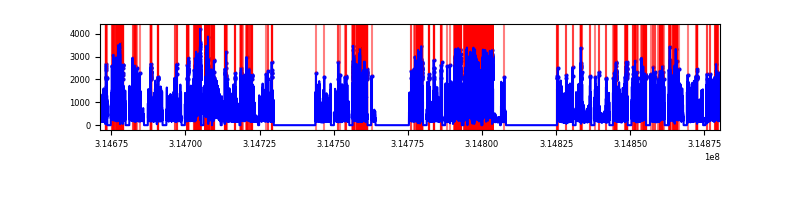 |
Top three noisy pixels from each quadrant. If the there are fewer than three noisy pixels in the level2.evt file, extra rows are filled as -1
| Pixel properties | Quadrant properties | ||||||
|---|---|---|---|---|---|---|---|
| Quadrant | DetID | PixID | Counts | Sigma | Mean | Median | Sigma |
| A | 0 | 29 | 8490 | 11.41 | 2246 | 2114 | 558.8 |
| A | 7 | 110 | 7063 | 8.86 | 2246 | 2114 | 558.8 |
| A | 0 | 30 | 6561 | 7.96 | 2246 | 2114 | 558.8 |
| B | 2 | 9 | 6826 | 11.41 | 2175 | 2085 | 415.7 |
| B | 2 | 8 | 5670 | 8.62 | 2175 | 2085 | 415.7 |
| B | 14 | 254 | 5424 | 8.03 | 2175 | 2085 | 415.7 |
| C | 1 | 80 | 6404 | 7.8 | 2191 | 2056 | 557.3 |
| C | 1 | 81 | 6370 | 7.74 | 2191 | 2056 | 557.3 |
| C | 3 | 234 | 5800 | 6.72 | 2191 | 2056 | 557.3 |
| D | 7 | 3 | 5020 | 5.94 | 2006 | 1828 | 537.0 |
| D | 6 | 67 | 4978 | 5.87 | 2006 | 1828 | 537.0 |
| D | 10 | 189 | 4953 | 5.82 | 2006 | 1828 | 537.0 |
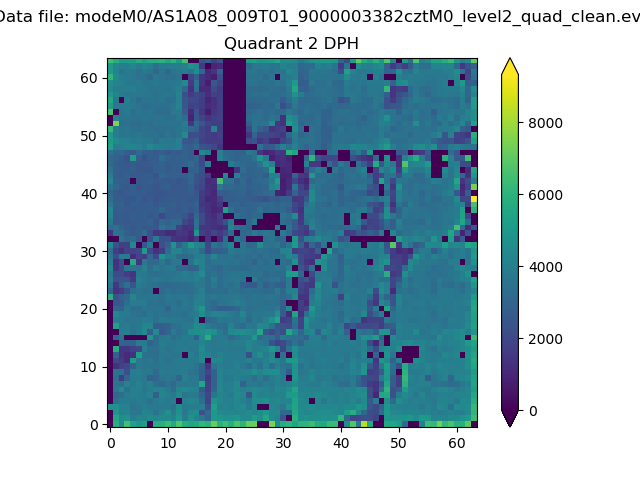
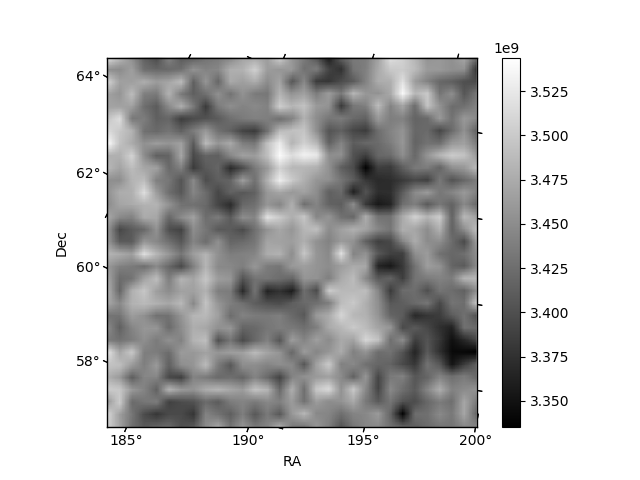
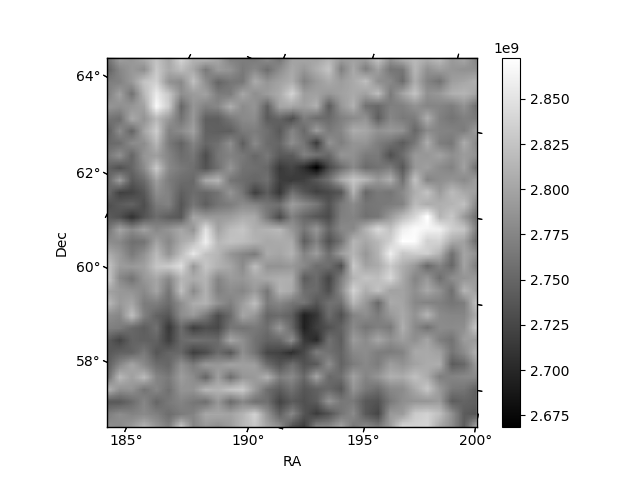
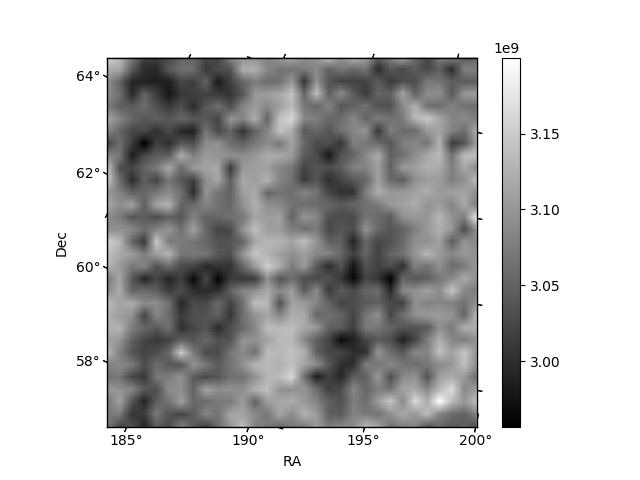
Histogram calculated using DETX and DETY for each event in the final _common_clean file
| Quadrant A | 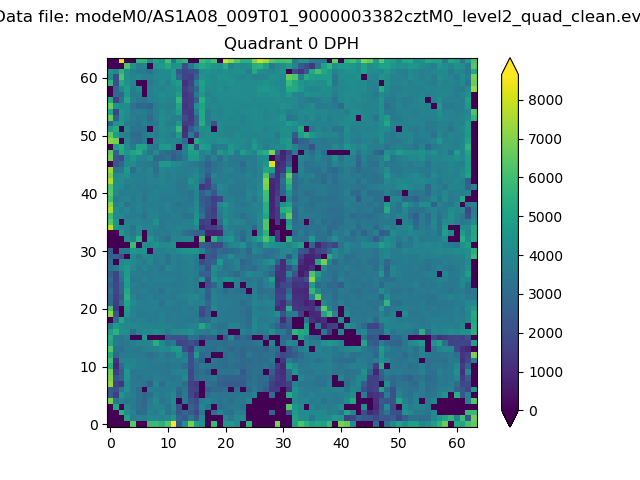 |
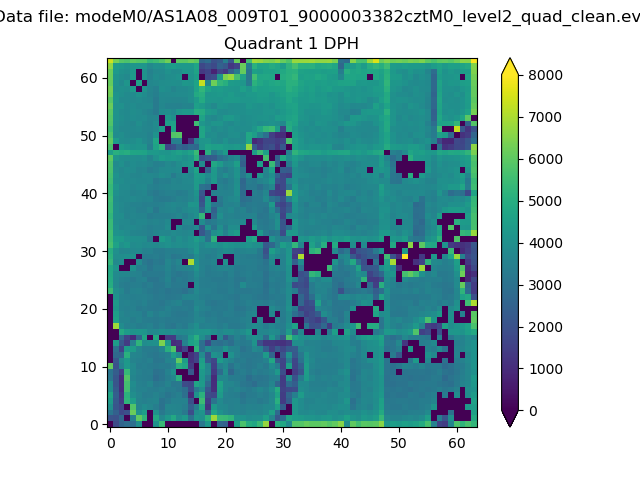 |
Quadrant B |
|---|---|---|---|
| Quadrant D | 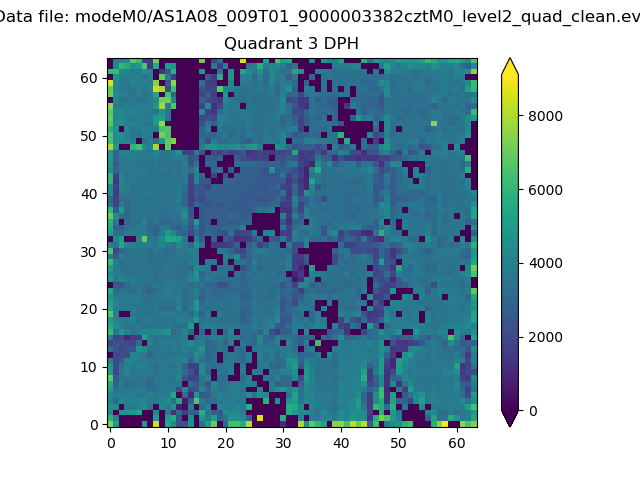 |
 |
Quadrant C |
| Plot type | Count rate plots | Images |
|---|---|---|
| Comparison with Poisson distribution Blue bars denote a histogram of data divided into 1 sec bins. Red curve is a Poisson curve with rate = median count rate of data. |
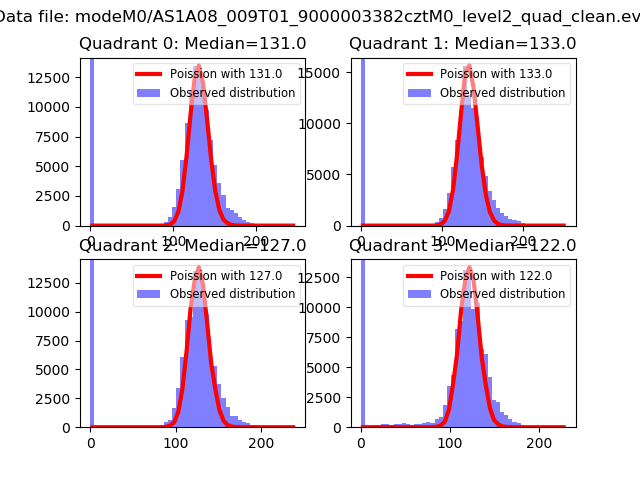 |
 |
| Quadrant-wise count rates Data is divided into 100 sec bins |
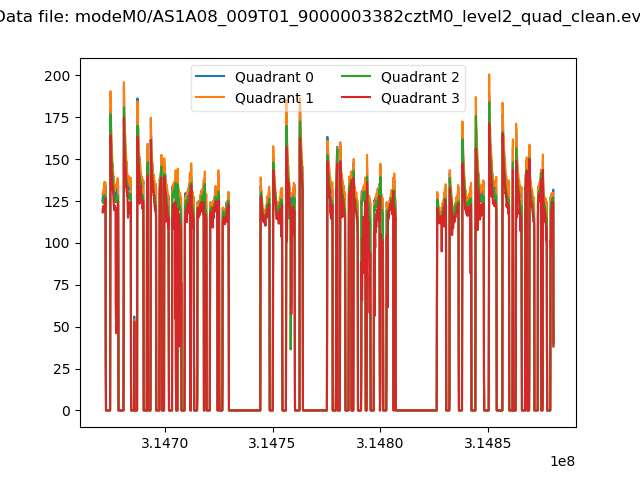 |
|
| Module-wise count rates for Quadrant A Data is divided into 100 sec bins |
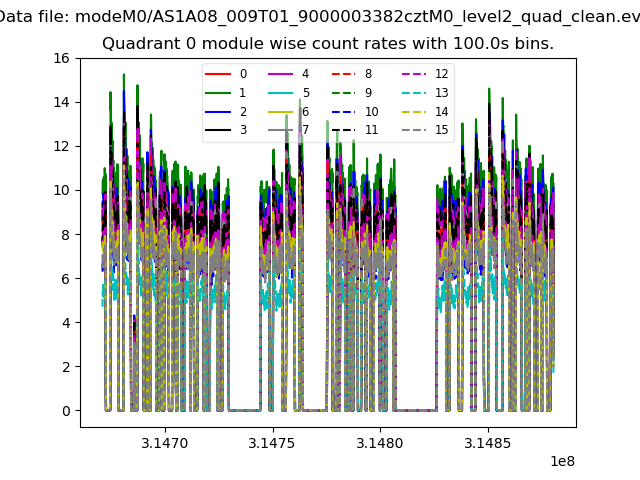 |
 |
| Module-wise count rates for Quadrant B Data is divided into 100 sec bins |
 |
 |
| Module-wise count rates for Quadrant C Data is divided into 100 sec bins |
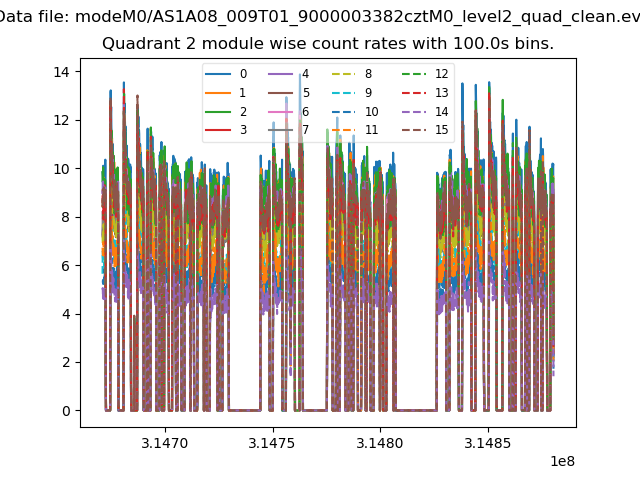 |
 |
| Module-wise count rates for Quadrant D Data is divided into 100 sec bins |
 |
 |
| Parameter | Plot |
|---|---|
| CZT HV Monitor | 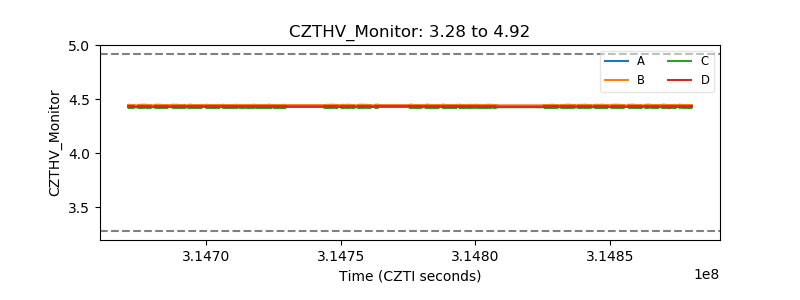 |
| D_VDD | 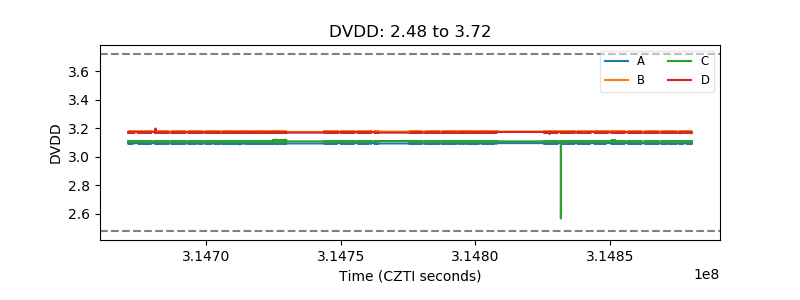 |
| Temperature 1 | 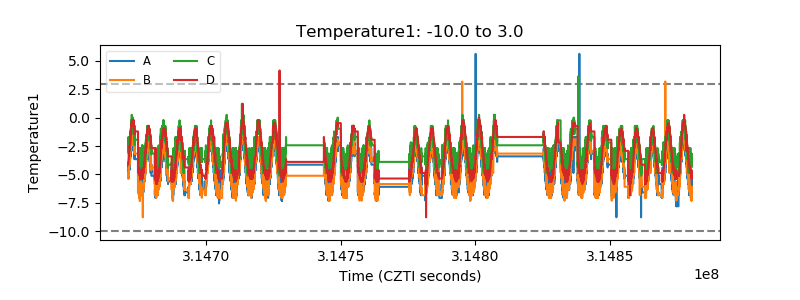 |
| Veto HV Monitor | 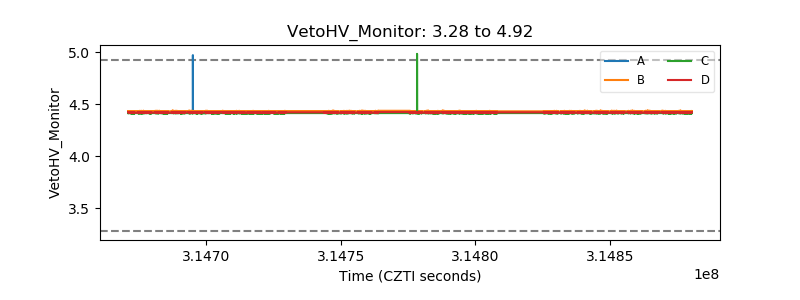 |
| Veto LLD | 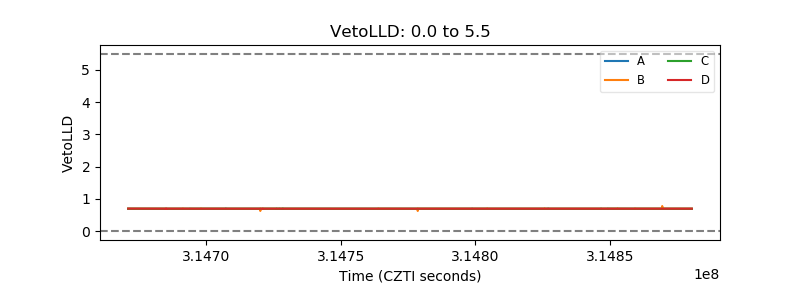 |
| Alpha Counter | 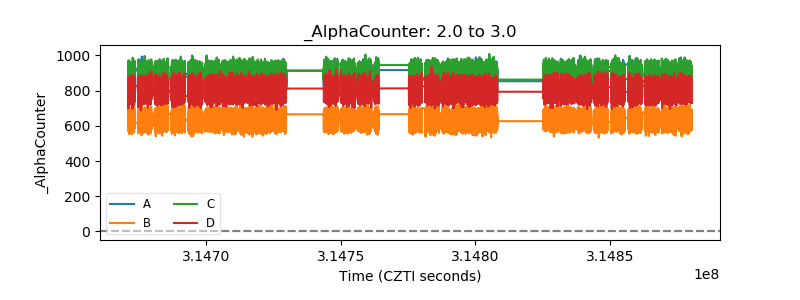 |
| _CPM_Rate | 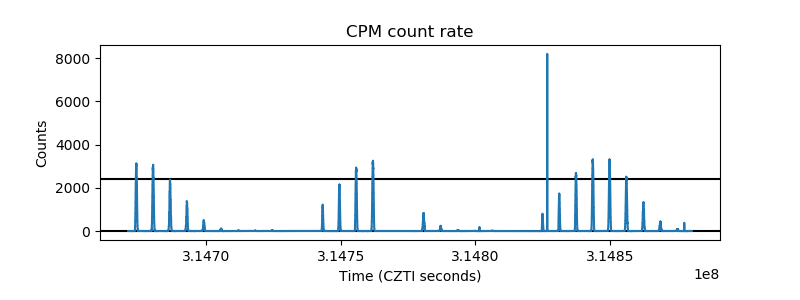 |
| CZT Counter | 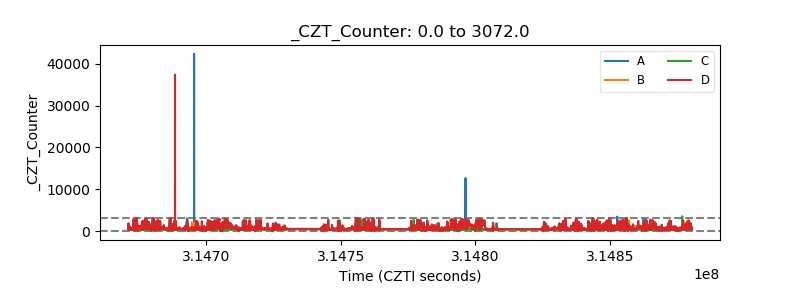 |
| +2.5 Volts monitor | 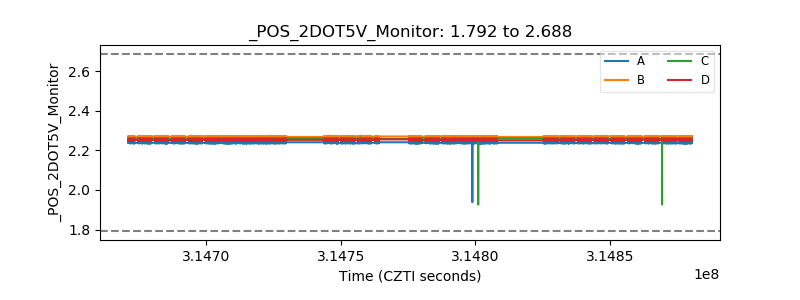 |
| +5 Volts monitor | 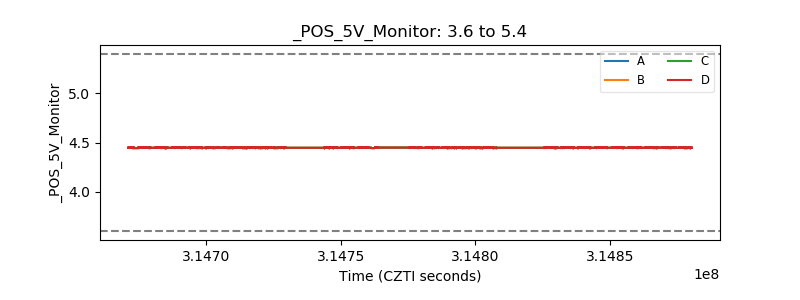 |
| _ROLL_ROT | 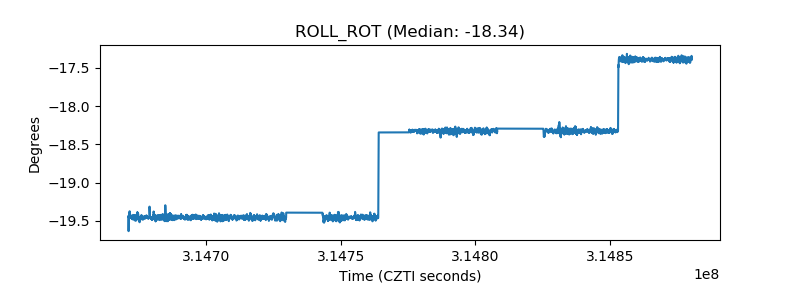 |
| _Roll_DEC |  |
| _Roll_RA | 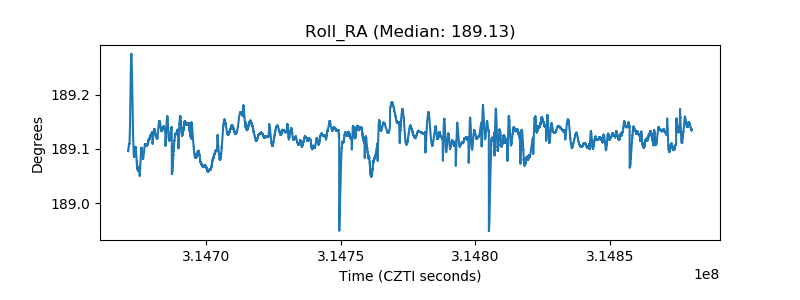 |
| Veto Counter | 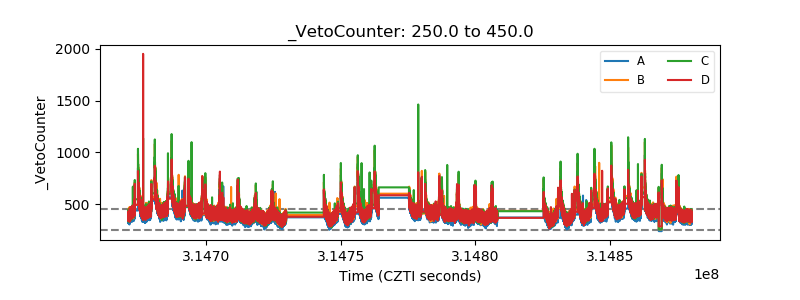 |